- *Corresponding Author:
- V. Jannin
Gattefossé SAS, 36 Chemin de Genas 69804 Saint-Priest Cedex, France
E-mail: vjannin@gattefosse.com
| Date of Submission | 21 July 2017 |
| Date of Revision | 13 March 2018 |
| Date of Acceptance | 16 September 2018 |
| Indian J Pharm Sci 2018;80(6):1011-1020 |
This is an open access article distributed under the terms of the Creative Commons Attribution-NonCommercial-ShareAlike 3.0 License, which allows others to remix, tweak, and build upon the work non-commercially, as long as the author is credited and the new creations are licensed under the identical terms
Abstract
Glyceryl behenate based-matrix tablets allowed obtaining a sustained release of theophylline for up to 12 hours. The diluent selected as pore-forming agent (lactose or dibasic calcium phosphate anhydrous) affected the drug release and its stability after 3-months storage at 40°. Lactose-containing matrix tablets exhibited a quicker drug release than those containing dibasic calcium phosphate anhydrous because of its higher water-solubility. After 3-month storage at 40°, tablets containing lactose showed the same drug release whereas a significantly slower release was observed for dibasic calcium phosphate anhydrous-containing tablets. Synchrotron radiation-based X-ray micro computed tomography was used for the evaluation of eventual changes in the microstructure of the matrix tablets during dissolution and after long-term storage. X-ray images provided new insights into the interplay of pharmaceutical ingredients and the importance of excipient surface structure on drug release overtime. The solid-lipid excipient could be adsorbed on the textured surface of mesoporous dibasic calcium phosphate anhydrous resulting in reduced water permeability of the matrix and therefore slower drug release. These findings provide formulators with fundamental formulation considerations for the development of sustained release matrix tablets using glyceryl dibehenate as release retarding agent.
Keywords
Lipid matrix, tablet microstructure, sustained-release, dissolution, X-ray micro computed tomography
X-ray micro computed tomography has been used in the last decades as a non-destructive imaging tool to study in volume the structure of granules and tablets [1]. In particular, it has been applied to ascertain the good mixing of granules within tablets [2], and to elucidate the drug release mechanism of some controlled-release formulations. For example, it enabled to follow the hydration and erosion of cellulose ether-based [3,4] or methyl acrylate-based [5] matrices during dissolution as well as the drug release from osmotic pump tablets [6]. To our knowledge X-ray micro computed tomography has not been used yet for the evaluation of the microstructure of lipid matrix tablets before and during dissolution, and after storage at 40° and 75 % relative humidity.
Lipid-based excipients offer a large variety of drug delivery solutions either to increase the oral bioavailability of poorly water-soluble drugs or to prolong the release of drugs with short half-life for longer efficacy. Excipients used for these applications are composed of fatty acids and esters containing fatty acids; e.g. acylglycerols [7]. Lipid matrix tablets [8] containing lipid excipients having a melting point higher than 40° and a low polarity are used to sustain drug release [9]. Among such lipids, glyceryl dibehenate (Compritol® 888 ATO, melting point ranging from 69° to 74° and hydrophilic-lipophilic value of 1) was originally introduced as a lubricant [10] but is now widely used by various techniques to obtain sustained-release tablets: direct compression [11-17], wet granulation [18,19], melt granulation [12-14,16,20-23], hot-melt coating [24], and hot-melt extrusion [25,26].
Lipid matrices used for sustained-release purpose are non-erodible and inert matrices that prolong the release of the drug by the creation of a hydrophobic network within the tablet. It slows down the hydration of the dosage form and control the dissolution and release of the drug into the dissolution medium. The drug is then released by diffusion through the lipid matrix following a first order Eqn. that can be modelled for tablets or lipid implants [27-29]. Since the lipid excipient is hydrophobic and water-insoluble, drug release is enabled by the addition of hydrophilic pore-formers such as lactose [14], dibasic calcium phosphate anhydrous or poloxamers [30] to the formulation. The water-solubility of these additional excipients affects drug release and should be chosen carefully [31].
One of the most reported disadvantages of lipid excipients in solid dosage forms is their physical variability upon storage and potential impact on drug release [32]. However, the polymorphism of solid lipids and especially that of glyceryl dibehenate is well described in the literature [33] and its impact on the evolution of drug release was recently evaluated in depth. The authors had demonstrated that drug release variation from glyceryl dibehenate containing sustained-release tablets after storage was not due to polymorph changes of the lipid matrix former [34]. Indeed, the same polymorph of glyceryl dibehenate provided two different drug release kinetics prior to and after storage, whereas the dissolution profiles from tablets with two distinct glyceryl dibehenate polymorphs were the same. Since then different assumptions have been made to explain the underlying changes in drug release from glyceryl dibehenate matrix tablets: (i) the tablet microstructure could have changed during storage at 40°, (ii) the texture of glyceryl dibehenate within the matrix could evolve due to (partial) melting and/or (iii) in combination with glyceryl dibehenate, the diluent texture and porosity could be of some importance. The following study aimed investigating the microstructure of glyceryl dibehenate-based sustained-release tablets in dry as well as in wet state before and after long-term storage for 3 mo at 40° by using synchrotron radiationbased X-ray micro computed tomography.
Materials and Methods
Theophylline anhydrous was chosen as the model drug for the formulation of sustained-release lipid matrix tablets (#5LBF2355V, Sigma Aldrich, Saint-Quentin Fallavier, France). Among the selected excipients, glyceryl dibehenate (Compritol® 888 ATO, Gattefossé, Saint-Priest, France) was chosen as matrix forming agent, dibasic calcium phosphate anhydrous (DCPA, Fujicalin® SG, Fuji Chemical Industry, France) or lactose (Flowlac® 100, Meggle Pharma, Wasserburg, Germany) as diluents, and magnesium stearate (Sigma Aldrich) as lubricant. The diluents- lactose and DCPA were chosen referring to their different water-solubility to study the impact on storage stability of lipid matrix tablets.
Tablet compression and characterization
Manufacturing of sustained-release tablets: Theophylline and other excipients (except magnesium stearate) were weighed, according to formulations described in Table 1, and then mixed in a Turbula blender (Turbula T2C, WAB Maschinenfabrik, Basel, Switzerland) at 90 rpm for 10 min. Magnesium stearate was added to the mix and blended anew at 90 rpm for 1 min. These physical powder blends were compressed in to 333 mg tablets using an eccentric tablet press (Korsch EKO, Berlin, Germany) with 10 mm flat faced tooling (compression force 18 kN, compression speed 30 tablets per minute). The batch size was 250 g and about 200 tablets were produced.
| Component | Composition (%, w/w) |
|
|---|---|---|
| F1- DCPA | F2- lactose | |
| Theophylline | 30.00 | 30.00 |
| Glyceryl dibehenate (Compritol® 888 ATO) | 19.50 | 19.50 |
| DCPA (Fujicalin® SG) | 50.00 | -- |
| Lactose (Flowlac® 100) | -- | 50.00 |
| Magnesium stearate | 0.50 | 0.50 |
Table 1: Selected formulations of theophylline sustained-release tablets
Tablet characterization
Tablet weight uniformity was determined for 20 tablets. Crushing strength (N) of 10 tablets each was evaluated using a hardness tester (TBH30, Erweka, Heusenstamm, Germany). Tablet thickness, (mm) and diameter (mm) were measured using a digital micrometer. Tablet tensile strength (N/mm²), was calculated according to Eqn. 1 [35], tensile strength = 2P/ πDT, where, P is crushing strength, D is tablet diameter and T is tablet thickness.
Drug release from sustained-release tablets was conducted in 900 ml phosphate buffer pH 4.5 referring to the USP monograph for extended-release tablets dissolution test 2 (USP 39-NF 34) using the USP II paddle apparatus (AT7 smart, Sotax, Basel, Switzerland) at 37° and 75 rpm for 12 h. At pre-determined time points, samples were withdrawn automatically and analysed spectrophotometrically at 271 nm (8453, Agilent Technologies, Santa Clara, USA).
Dissolution experiments were conducted on three tablets (n=3).
In order to compare dissolution profiles, the similarity factor f2 and difference factor f1 were calculated (Eqns. 2 and 3 [36,37]). f2 = 50×log{ [1+(1/n) Σ(Rt–Tt)2] –0.5×100} and f1 = { [Sn t=1 |Rt–Tt|]⁄ [Sn t=1 Rt]}×100, where, n= number of time points, Rt= dissolution value of the reference batch at time t, Tt= dissolution value of the test batch at time t.
The similarity factor f2 is used to assess the similarity between two dissolution profiles. Factor f1 is used to assess the difference between two dissolution profiles. For example, when two profiles are identical, f2 is equal to 100 and f1 is equal to zero. Dissolution profiles are considered as similar if f2 is between 50 and 100 and f1 is between 0 and 15 [36,37].
Surface hydrophobicity and wettability
Surface hydrophobicity and wettability of tablets were evaluated from contact angle measurements using a goniometer ILMS (GBX, Romans sur Isère, France), equipped with an image analysis software (Windrop++, GBX). A droplet of distilled water (3 μl) was deposited onto the tablet surface with a precision syringe. Then, the method is based on image processing and curve fitting for contact angle measurement from a theoretical meridian drop profile, measuring contact angle between the baseline of the drop and the tangent at the drop boundary. Video acquisition of a magnified image of the drop profile was conveyed to a computer via a CCD camera (TELI, Nikon), which enables to quantify changes in droplet shape recorded as digital images overtime. Data experimentally acquired are the contact angle as function of time t [38].
Storage conditions of tablets
Tablets were exposed to ICH accelerated conditions (40° at 75 % relative humidity) in closed glass vials for 3 mo.
Statistical analysis
The results were expressed as mean±standard deviation (SD). The data were compared using the Student t-test with a 95 % confidence interval. A statistically significant difference was considered with a p-value <0.05.
X-ray micro computed tomography analysis
Measurements were carried out in a non-destructive and non-invasive way, i.e. from intact tablets without any sample preparation. High-resolution X-ray microtomography acquisitions were performed at beamline BM05 at the European Synchrotron Radiation Facility (Grenoble, France). Each data collection consisted in a set of 8000 radiographies acquired in 0.045-degree increment over 360 degrees of rotation of the sample specimen. The detector (Fast Readout Low Noise – FreLoN- 14-bit CCD camera) resolution was 3.03 μm, leading to a reconstruction with an isotropic voxel size of 3.033 μm3. The energy of the incident X-ray parallel beam and the distance between the sample and the detector was 88 keV and 1 m, respectively for tablets at t=0 and 84 keV and 0.5 m, respectively for tablets after storage. These two sets of data collection parameters can be considered as identical for tablet samples. A large propagation distance enhances the phase contrast that allowed distinguishing between components that have small difference of density. 3D images were reconstructed using a standard filtered back projection algorithm. No further image treatment was necessary. Dry tablets (room temperature and RH) and tablets after 6-h immersion in 900 ml of phosphate buffer (pH 4.5 and 37°) with stirring at 75 rpm were analysed. Quantitative analysis of porosity, expressed as the ratio (volume of pores)/(total volume), was performed from a basic segmentation of the reconstructed volume using threshold adjustment and manual refinement from ImageJ software [39].
In addition, all materials were analysed by scanning electron microscopy-field emission guns (SEM-FEG, Supra55VP, Carl Zeiss AG, Switzerland) at low voltage (1.2 kV for all materials except theophylline at 0.8 kV) to visualize the shape of ingredients and hence facilitate the identification of materials by X-ray tomography.
Results and Discussion
Drug release from glyceryl dibehenate matrices is dominated by diffusion as described by Velghe et al. [40]. The aqueous medium enters the matrix and dissolves the drug that in turn diffuses out of the matrix following its concentration gradient. The diffusion kinetics, thus the time for the aqueous medium to enter the tablet matrix and the dissolved drug to diffuse out, is governed by the creation of pores and water channels. Formulating glyceryl dibehenate tablets with water-soluble drug and diluents will hence lead to faster drug release than that from matrices with water-insoluble ingredients [41,42]. In the present study tablets contained theophylline with a water-solubility of 9.7 mg/ml in pH 4.5 at 37°, lactose solubility was 216 mg/ml and that of DCPA was 0.2 mg/ml, this material solubility varied with pH and is least soluble at pH 4.2 [43].
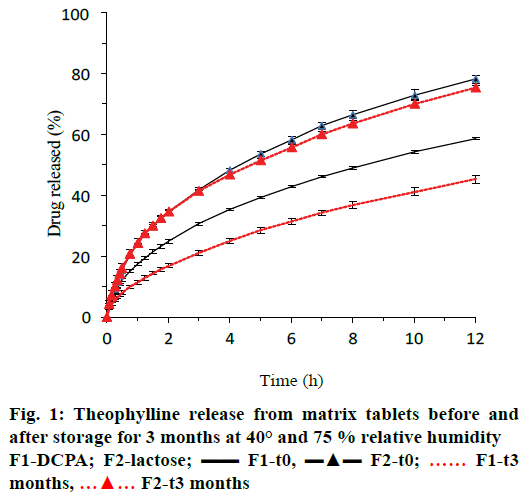
Figure 1 showed that theophylline release prior to storage (t0) was 15.5 and 19.6 % more from lactose containing tablets (formulation F2, blue triangles) after 6 and 12 h of dissolution than from tablets with DCPA (formulation F1, blue lines). After 3-mo storage at 40° and 75 % relative humidity, drug release significantly decreased for tablets with DCPA but not for those with lactose as indicated by the red curves in Figure 1 and the similarity or difference factor f2 or f1 in Table 2.
| Formulation | Weight (mg) |
Tensile strength (N/mm²) |
Drug dissolved at t=6h (%) |
Similarity factor (f2) vs. t0 | Difference factor (f1) vs. t0 |
|---|---|---|---|---|---|
| F1-DCPA, t0 | 333±1 | 1.91±0.15 | 42.81±0.37 | -- | -- |
| F1-DCPA, t3 | 333±1 | 1.84±0.16 | 31.40±0.98 | 49 | 27 |
| F2-lactose, t0 | 332±2 | 1.28±0.17 | 58.27±0.99 | -- | -- |
| F2-lactose, t3 | 332±2 | 1.61±0.61 | 55.89±0.99 | 82 | 3 |
Table 2: Physical characteristics of matrix tablets
Tablet properties after manufacturing (t0) and after 3 mo of storage at 40° and 75 % relative humidity (t3) are summarized in Table 2. Tablet weight was not affected by storage conditions. Tensile strength increased for tablets containing lactose, however, the increase was not statistically significant.
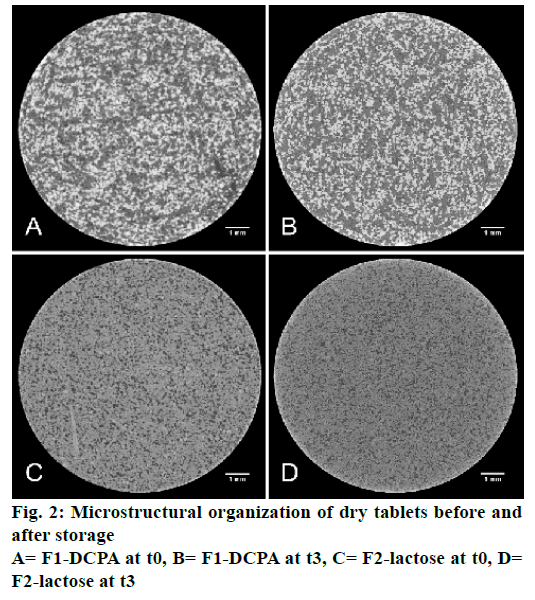
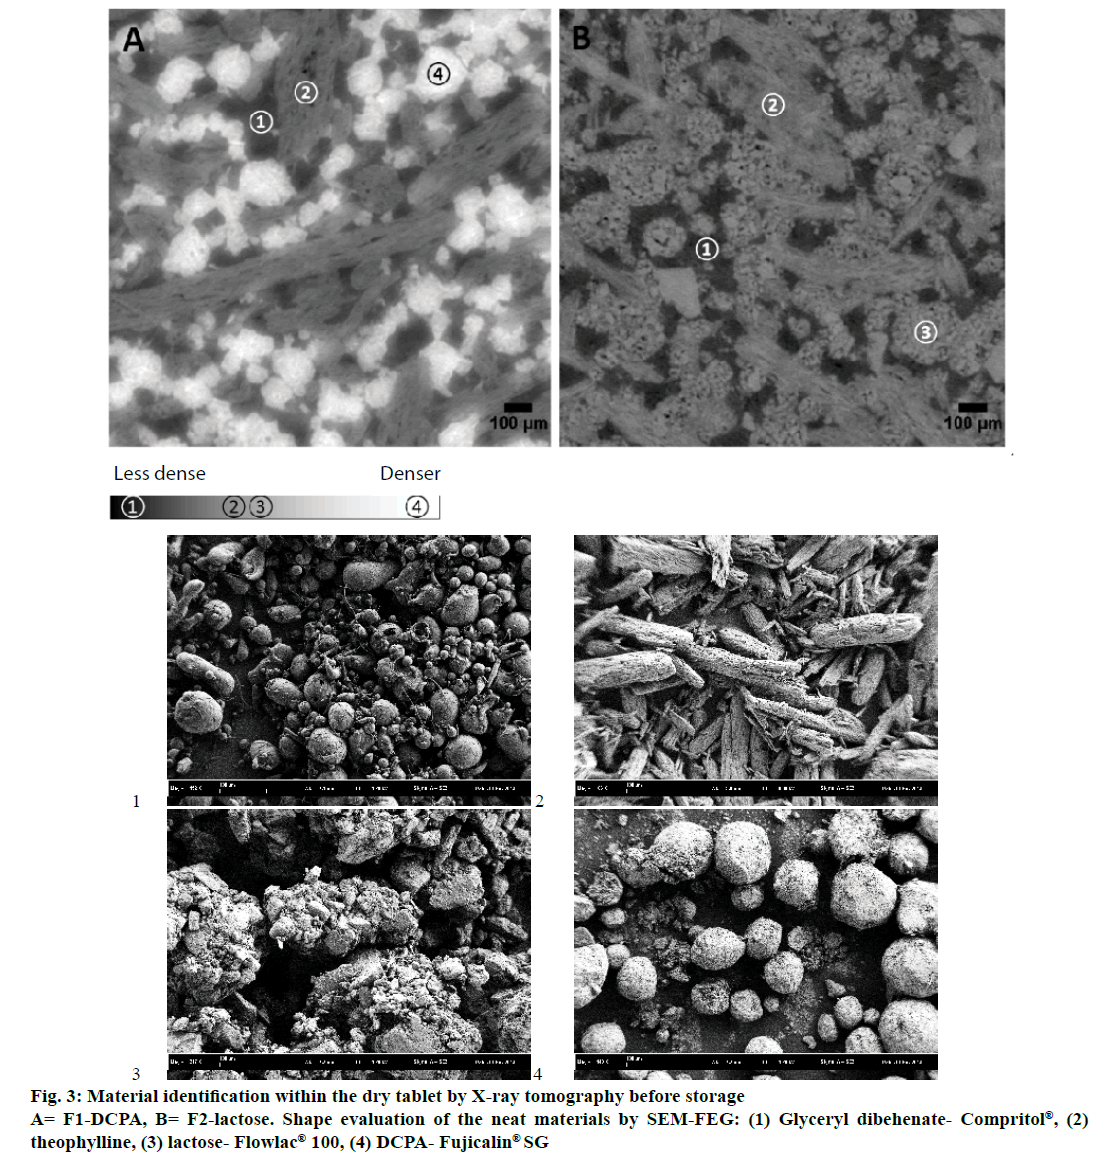
X-ray microtomography provided visual insights into the microstructure of glyceryl dibehenate tablets before and after 3 mo of storage and without destruction of the matrix (Figure 2). Each material formulated had a distinct density that corresponds to a colour code, where dense materials appeared white, less dense materials grey and pores (air) black. Consequently, DCPA being the densest material was white followed by lactose and theophylline in grey and glyceryl dibehenate in dark grey due to its lower density (Figure 3A and B). To further simplify material identification within the tablet matrix, the shape of each product was also analysed by SEM-FEG (Figure 3). Theophylline crystals exhibited a characteristic bundle shape whereas lactose had a porous grain shape. Glyceryl dibehenate was found to be spherical prior to compression, but loses its specific shape afterwards due plastic deformation and low yield strength.
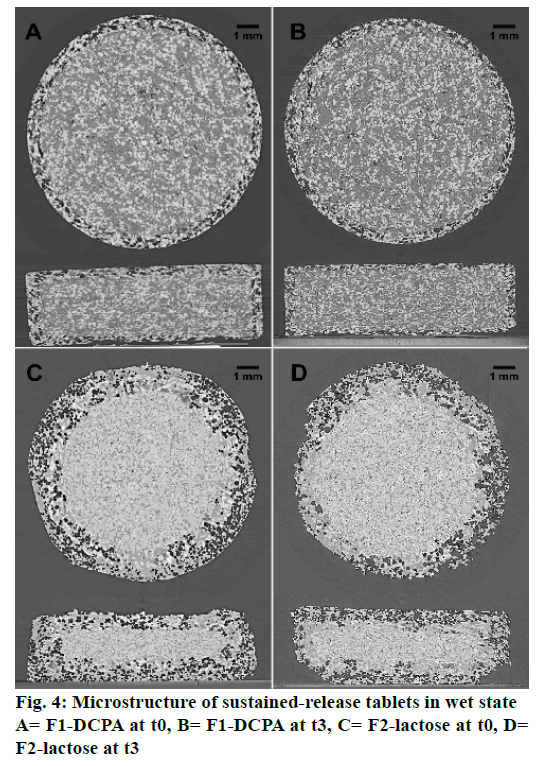
X-ray microtomography further allowed evaluating the tablet microstructure in wet state after 6 h of immersion in the dissolution medium under agitation at 75 rpm. As illustrated in Figure 4, water diffused slowly from the tablet surface towards the matrix core. The (more or less) water-soluble compounds (drug and diluents) dissolved at the tablet edges creating a porous network (herein referred to as “corona”, Figure 5C) of water-insoluble ingredients (glyceryl dibehenate). Since DCPA is much less soluble in aqueous media than lactose, the porous corona of formulation F1 was notably thinner after 6 h of dissolution in pH 4.5 than that of formulation F2 (Figure 4A vs. C). Consequently, drug release was faster for lactose containing tablets as shown in Figure 1.
A slight reduction in the corona thickness could be observed after 3 mo of storage for formulation F1- DCPA (Figure 4B). Due to the sharp intersection between the porous corona in wet state and the dry core of tablets containing DCPA, it was possible to calculate the difference in the corona thickness after 6 h of dissolution before and after storage of the tablets. As shown in Table 3, the difference in corona thickness is correlated to the one in drug release kinetics observed in Figure 1. However, as there was no such sharp intersection between the dry core of lactose containing tablets and the porous network at the surface it was impossible drawing a valid conclusion using this approach. We therefore did not make further assumptions with this data.
| Tablet | Radius* (mm) | Height * (mm) | Core volume** (mm3) | Corona volume** (mm3) | Calculated release at t=6 h*** (%) | Drug dissolved at t=6 h (%) |
|---|---|---|---|---|---|---|
| F1-DCPA, t0 | 4.458 | 2.146 | 133.92 | 97.13 | 42.04 | 42.81±0.37 |
| F1-DCPA, t3 | 4.555 | 2.374 | 154.67 | 76.38 | 33.06 | 31.40±0.98 |
*Radius and height of the dry tablet core were estimated from X-ray microtomography images. **Total initial tablet volume was 231.05 mm3. ***Drug release calculated = 1–(core volume at t=6 h/total initial tablet volume)
Table 3: Calculated difference in drug release from formulation f1-dcpa before (t0) and after storage (t3)
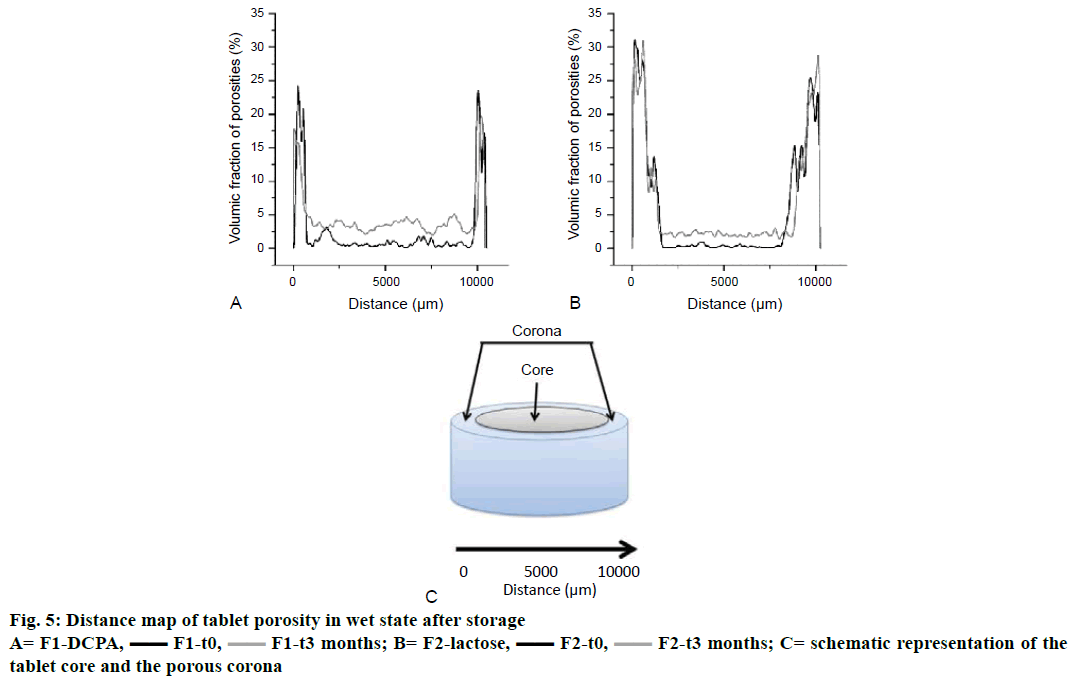
The porosity of the matrix was measured for both formulations by scanning the whole tablet horizontally from left to right over the entire tablet diameter, hence from the corona surface on left hand all through the tablet core and the corona surface on right hand, described as the distance from 0 to 10 000 μm on the x-axes in Figure 5 (corresponding to 10 mm in diameter tablets). According to the observations made in Figure 4, the corona of formulation F2-lactose after wetting for 6 h and with no storage exhibited higher porosity (31 % from 0 to 1000 μm) than formulation F1-DCPA (24 % from 0 to 800 μm, (black curves). Towards the centre of the tablet, porosity experienced a sharp decrease until 9500 and 8000 μm for DCPA and lactose containing tablets, respectively. After 6 h of immersion, water penetrated the matrix for the first 500-2000 μm only. The remaining drug and excipients in the centre of the tablets were therefore not dissolved yet, resulting in such low porosity values in the tablet core. Porosity increased again at the corona on the right site of the tablet.
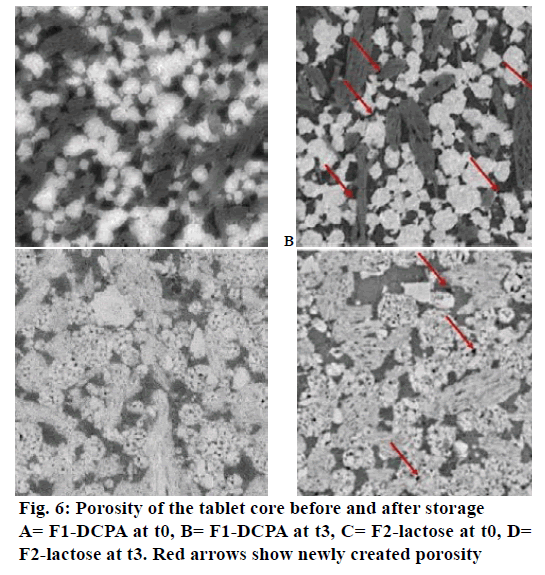
Interestingly, two different observations were made after long-term storage of tablets, firstly porosity of the corona decreased for formulation F1-DCPA from 24 to 18 % and not for formulation F2-lactose (Figure 5, grey curves) and secondly porosity in the tablet core increased for both formulations although to a higher extent for DCPA than for lactose containing tablets (Figure 6). The red arrows in Figure 6 indicated the new created pores in the centre of the matrix. It could be seen that pores in formulation F1 mainly occurred around the white DCPA particles (Figure 6A and B), whereas the pores in formulation F2 rather increased intra-granularly within the lactose particles (Figure 6C and 6D).
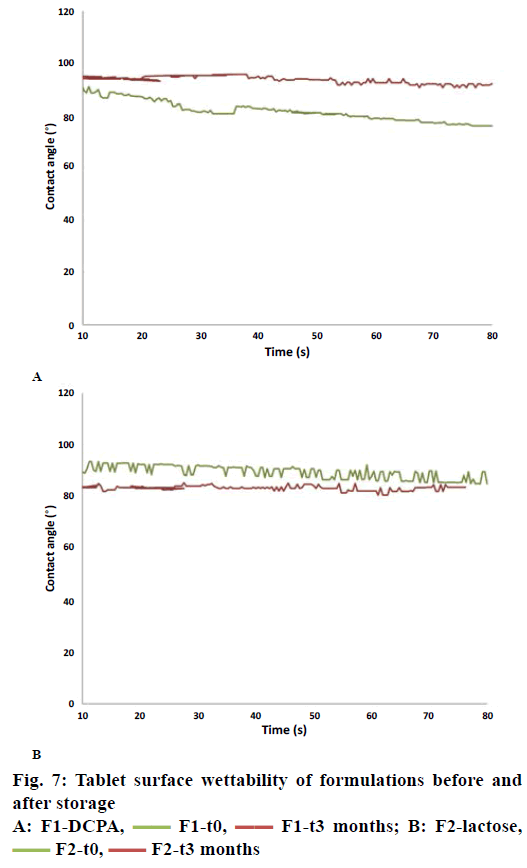
Contact angle measurement provided insights into tablet surface wettability. The latter depended on both the aqueous solubility of the materials and porosity of the tablet matrix: high aqueous solubility and high matrix porosity provide small contact angles and therefore improved tablet-wetting properties. The measured contact angle in Figure 7A confirmed the former observations regarding the evolution of porosity upon storage of tablets with DCPA. At t=0, the water droplet (release medium pH 4.5) did slightly diffuse from the tablet surface into the tablet core as indicated by a drop of the contact angle from 91° to 76° after 80 s (Figure 7A). After 3-mo storage, the water droplet did not diffuse in the tablet resulting in a contact angle of greater than 90° during the whole experiment. This indicated that there was an increase in matrix hydrophobicity. This increased hydrophobicity was not observed with the other formulation containing lactose (Figure 7B) where the contact angle stays below 90° for the whole experiments and was even slightly lower after 3-mo storage at 40°.
It has been well described in the literature that the polymorph of glyceryl dibehenate systematically changes with increasing temperature and time [8,33,34]. Therefore, for decades it was assumed that solid lipid excipients such as glyceryl dibehenate were inappropriate as sustained-release agents in matrix tablets since ICH storage conditions of 40° affect the crystalline lattice of the lipid and therewith-eventual drug release kinetics from tablets after long-term storage. The recent findings that polymorphism is not responsible for the unstable drug release from tablets prepared by direct compression was therefore of importance [34]. Further investigation is needed to understand the underlying mechanism of the change in drug release kinetics. We hypothesize that evolution in the microstructure of tablets with respect to textural changes of glyceryl dibehenate or the diluents is the reason for change in drug release kinetics.
Theophylline release from tablet formulation F2 with lactose was illustrated to be stable upon storage for 3 mo at 40° and 75 % relative humidity whereas that from formulation F2 with DCPA was not. X-ray micro computed tomography was used to identify the microstructural organization of glyceryl dibehenatebased matrix tablets. Figures 2 and 3 showed that all ingredients were homogenously distributed throughout the tablet matrix and that there was no evidence of cluster formation or particle accumulation, neither before nor after storage. The retardation in drug release for tablets with DCPA after storage could therefore not be attributed to the segregation of water-soluble and water-insoluble ingredients.
Glyceryl dibehenate is a solid lipid excipient with low molecular weight. By implication, partial melting of glyceryl dibehenate could occur upon storage at 40°. Although the melting point of glyceryl dibehenate is around 70°, DSC thermograms revealed a slight endotherm at 35° [33]. Nevertheless, caking of glyceryl dibehenate powder was not observed when placed in an oven at 40°, and microstructural analysis of the tablets by X-ray tomography did not reveal any evidence that glyceryl dibehenate melted in some way (Figures 3 and 6).
Upon evaluation of tablets in wet state the thickness of the porous corona occurred to be slightly reduced after storage. This observation was only made for tablets containing DCPA as highlighted in (Figures 4A, B and 5A) but not for tablet formulation F2 with lactose as diluent (Figures 4C, D and 5B). Indeed, the corona porous network with DCPA diminished by 21 % throughout storage that could be related to the extent of drug release decrease (calculated from the reduction of the corona volume measured by X-ray tomography, Table 3). Simultaneously the porosity of the tablet core increased, this time for both formulations F1-DCPA and F2-lactose. In Figure 6A porosity increase was mainly observed in the centre of DCPA tablets. As shown in the figure, parts of glyceryl dibehenate disappeared from the microstructural organization in the tablets. No such event was observed in formulation F2 as shown in Figure 6B, except an increase in intra-granular porosity of lactose granules.
DCPA (Fujicalin® SG) is a textured mesoporous excipient with high specific surface area designed for direct compression. Due to this specific texture it can be assumed that adsorption of powders is facilitated and that glyceryl behenate particles adhered to the surface of DCPA during storage at 40°. X-ray micro computed tomography suggested indeed a change in density for DCPA. This adsorption resulted in an increase in matrix porosity of DCPA tablets. Assuming however that the latter increased due to partial binding of glyceryl dibehenate to mesoporous DCPA it is highly likely that the surface of DCPA became hydrophobic after storage. This resulted in slower dissolution of DCPA and thus less matrix permeability (Figure 7A) leading to slower drug release kinetics. As lactose used in this study did not exhibit a mesoporous structure, glyceryl dibehenate adsorption did not occur and the tablet surface did not became hydrophobic after storage (Figure 7B). Drug release was therefore not affected after storage.
Recent findings revealed that drug release changes of glyceryl dibehenate-based sustained-release tablets after long-term storage could not be ascribed to polymorphic transformation of the lipid excipient. Synchrotron radiation-based X-ray micro computed tomography was therefore used in this study to explore the microstructural organization of such tablets and their eventual evolution overtime. Theophylline release kinetics after storage was stable when glyceryl dibehenate was formulated with lactose (Flowlac® 100) but unstable in combination with mesoporous DCPA (Fujicalin® SG). This study concluded that glyceryl dibehenate adhered to the textured surface of DCPA that consequently covered the diluents surface with a hydrophobic layer, leading to reduced water permeability and thus, reduced the drug release.
References
- Zeitler JA, Gladden LF. In-vitro tomography and non-destructive imaging at depth of pharmaceutical solid dosage forms. Eur J Pharm Biopharm 2009;71(1):2-22.
- Liu R, Yin X, Li H, Shao Q, York P, He Y, et al. Visualization and quantitative profiling of mixing and segregation of granules using synchrotron radiation X-ray microtomography and three dimensional reconstruction. Int J Pharm 2013;445(1-2):125-33.
- Laity PR, Cameron RE. Synchrotron X-ray microtomographic study of tablet swelling. Eur J Pharm Biopharm 2010;75(2):263-76.
- Yin X, Li H, Guo Z, Wu L, Chen F, de Matas M, et al. Quantification of swelling and erosion in the controlled release of a poorly water-soluble drug using synchrotron X-ray computed microtomography. AAPS J 2013;15(4):1025-34.
- Young PM, Nguyen K, Jones AS, Traini D. Microstructural analysis of porous composite materials: dynamic imaging of drug dissolution and diffusion through porous matrices. AAPS J 2008;10(4):560-4.
- Li H, Yin X, Ji J, Sun L, Shao Q, York P, et al. Microstructural investigation to the controlled release kinetics of monolith osmotic pump tablets via synchrotron radiation X-ray microtomography. Int J Pharm 2012;427(2):270-5.
- Jannin V, Rodier JD, Musakhanian J. Polyoxylglycerides and glycerides: effects of manufacturing parameters on API stability, excipient functionality and processing. Int J Pharm 2014;466(1-2):109-21.
- Rosiaux Y, Jannin V, Hughes S, Marchaud D. Solid lipid excipients - Matrix agents for sustained drug delivery. J Control Release 2014;188C:18-30.
- Jannin V, Musakhanian J, Marchaud D. Approaches for the development of solid and semi-solid lipid-based formulations. Adv Drug Deliv Rev 2008;60(6):734-46.
- Jannin V, Berard V, N’Diaye A, Andres C, Pourcelot Y. Comparative study of the lubricant performance of Compritol 888 ATO either used by blending or by hot melt coating. Int J Pharm 2003;262(1-2):39-45.
- Hamza Yel-S, Aburahma MH. Innovation of novel sustained release compression-coated tablets for lornoxicam: formulation and in vitro investigations. Drug Dev Ind Pharm 2010;36(3):337-49.
- Kavitha K, Deore RK, Tamizhmani TG. Preparation and evaluation of sustained release matrix tablets of Tramadol hydrochloride using compritol 888 ATO by melt granulation technique. Res J Pharm Biol Chem Sci 2010;1(3):431-40.
- Li FQ, Hu JH, Deng JX, Su H, Xu S, Liu JY. In vitro controlled release of sodium ferulate from Compritol 888 ATO-based matrix tablets. Int J Pharm 2006;324(2):152-7.
- Obaidat AA, Obaidat RM. Controlled release of tramadol hydrochloride from matrices prepared using glyceryl behenate. Eur J Pharm Biopharm 2001;52(2):231-5.
- Parejiya PB, Barot BS, Patel HK, Shelat PK, Shukla A. Innovation of novel ‘Tab in Tab’ system for release modulation of milnacipran HCl: optimization, formulation and in vitro investigations. Drug Dev Ind Pharm 2013;39(11):1851-63.
- Perez MA, Ghaly ES, Marti A. Sustained release phenylpropanolamine hydrochloride from Ato 888 matrix. P R Health Sci J 1993;12(4):263-7.
- Roberts M, Vellucci D, Mostafa S, Miolane C, Marchaud D. Development and evaluation of sustained-release Compritol-888 ATO matrix mini-tablets. Drug Dev Ind Pharm 2012;38(9):1068-76.
- Gu X, Fediuk DJ, Simons FE, Simons KJ. Evaluation and comparison of five matrix excipients for the controlled release of acrivastine and pseudoephedrine. Drug Dev Ind Pharm 2004;30(10):1009-17.
- Rosiaux Y, Girard JM, Desvignes F, Miolane C, Marchaud D. Optimizing a wet granulation process to obtain high-dose sustained-release tablets with Compritol 888 ATO. Drug Dev Ind Pharm 2015;41(10):1738-44.
- Abdallah OY. Evaluation of some lipophilic materials as release controlling fillers for the development of ibuprofen formulations. Alex J Pharm Sci 1992;6(3):243-6.
- Barakat NS, Elbagory IM, Almurshedi AS. Controlled-release carbamazepine matrix granules and tablets comprising lipophilic and hydrophilic components. Drug Deliv 2009;16(1):57-65.
- Patel JK, Patel NV, Shah SH. In vitro controlled release of colon targeted mesalamine from compritol ATO 888 based matrix tablets using factorial design. Res Pharm Sci 2009;4(2):63-75.
- Patere SN, Desai NS, Jain AS, Kadam PP, Thatte UM, Gogtay N, et al. Compritol®888 ATO a lipid excipient for sustained release of highly water soluble active: formulation, scale-up and IVIVC study. Curr Drug Deliv 2013;10(5):548-56.
- Jannin V, Cuppok Y. Hot-melt coating with lipid excipients. Int J Pharm 2013;457(2):480-7.
- Keen JM, Hughey JR, Bennett RC, Jannin V, Rosiaux Y, Marchaud D, et al. Effect of tablet structure on controlled release from supersaturating solid dispersions containing glyceryl behenate. Mol Pharm 2015;12(1):120-6.
- Keen JM, Foley CJ, Hughey JR, Bennett RC, Jannin V, Rosiaux Y, et al. Continuous twin screw melt granulation of glyceryl behenate: Development of controlled release tramadol hydrochloride tablets for improved safety. Int J Pharm 2015;487(1-2):72-80.
- Siepmann F, Herrmann S, Winter G, Siepmann J. A novel mathematical model quantifying drug release from lipid implants. J Control Release 2008;128(3):233-40.
- Siepmann J, Siepmann F. Mathematical modeling of drug release from lipid dosage forms. Int J Pharm 2011;418(1):42-53.
- Siepmann J, Siepmann F. Modeling of diffusion controlled drug delivery. J Control Release 2012;161(2):351-62.
- Jannin V, Pochard E, Chambin O. Influence of poloxamers on the dissolution performance and stability of controlled-release formulations containing Precirol ATO 5. Int J Pharm 2006;309(1-2):6-15.
- Kreye F, Siepmann F, Siepmann J. Drug release mechanisms of compressed lipid implants. Int J Pharm 2011;404(1-2):27-35.
- Sutananta W, Craig DQM, Newton JM. The effects of ageing on the thermal behaviour and mechanical properties of pharmaceutical glycerides. Int J Pharm 1994;111(1):51-62.
- Brubach JB, Jannin V, Mahler B, Bourgaux C, Lessieur P, Roy P, et al. Structural and thermal characterization of glyceryl behenate by X-ray diffraction coupled to differential calorimetry and infrared spectroscopy. Int J Pharm 2007;336(2):248-56.
- Jannin V, Rosiaux Y, Doucet J. Exploring the possible relationship between the drug release of Compritol®-containing tablets and its polymorph forms using micro X-ray diffraction. J Control Release 2015;197:158-64.
- Fell JT, Newton JM. Determination of tablet strength by the diametral-compression test. J Pharm Sci 1970;59(5):688-91.
- Shah VP, Tsong Y, Sathe P. In vitro dissolution profile comparison - statistics and analysis of the similarity factor, f2. Pharm Res 1998;15(6):889-96.
- Costa P, Sousa Lobo JM. Modelling and comparison of dissolution profiles. Eur J Pharm Sci 2001;13(2):123-33.
- Chambin O, Karbowiak T, Djebili L, Jannin V, Champion D, Pourcelot Y, et al. Influence of drug polarity upon the solid-state structure and release properties of self-emulsifying drug delivery systems in relation with water affinity. Colloids Surf B Biointerfaces 2009;71(1):73-8.
- Schneider CA, Rasband WS, Eliceiri KW. NIH Image to ImageJ: 25 years of image analysis. Nat Methods 2012;9:671-5.
- Velghe C, Rosiaux Y, Marchaud D, Siepmann J, Siepmann F. In silico simulation of niacin release from lipid tablets: theoretical predictions and independent experiments. J Control Release 2014;175:63-71.
- Turkoglu M, Sakr A. Tablet dosage forms. In: Florence A, Siepmann J, editors. Modern Pharmaceutics. 5th ed. New York, London: Informa Healthcare; 2010. p. 481-97.
- Mulye NV, Turco SJ. Use of Dicalcium Phosphate Dihydrate for Sustained Release of Highly Water Soluble Drugs. Drug Dev Ind Pharm 1994;20(17):2621-32.
- Chow LC. Solubility of Calcium Phosphates. In: Chow L, Eanes E, editors. Octacalcium phosphate. Vol. 18. Basel/Switzerland: Karger Publishers; 2001. p. 94-111.
 F2-t3 months
 F1-t0,
  F1-t3 months; B= F2-lactose,
 F1-t0,
  F1-t3 months; B: F2-lactose,


