- *Corresponding Author:
- R. Majumder
Department of Pharmaceutical Analysis, School of Pharmaceutical Sciences, Siksha ‘O’ Anusandhan University, Bhubaneswar-751 003, India
E-mail: rajamajumdert@gmail.com
| Date of Submission | 20 April 2017 |
| Date of Revision | 26 April 2018 |
| Date of Acceptance | 29 November 2018 |
| Indian J Pharm Sci 2019;81(1):99-109 |
This is an open access article distributed under the terms of the Creative Commons Attribution-NonCommercial-ShareAlike 3.0 License, which allows others to remix, tweak, and build upon the work non-commercially, as long as the author is credited and the new creations are licensed under the identical terms
Abstract
Present study aimed to evaluate the phytoconstituents of the aqueous extracts of stem and fruits of Olax psittacorum as well as the free radical scavenging and the antibacterial activity of the extracts. Free radical scavenging activities were evaluated through DPPH radical scavenging assay, ABTS radical scavenging assay, phosphomolybdate radical scavenging assay, hydrogen peroxide assay and reducing power assay using ascorbic acid as the standard. Well diffusion method was adopted for antibacterial activity evaluation of the aqueous extract of fruits and stem against Staphylococcus aureus, Bacillus stereothermophillus, Pseudomonas aeruginosa, Vibrio cholera, Escherichia coli and Acinetobacter baumanii. Positive response to phytochemical screening of tannin, saponin, steroids and terpenoids showed in both aqueous extract of stem and fruit where as positive response to the presence of glycoside, flavonoids, carbohydrate and reducing sugar showed only by the aqueous extract of fruit. Total phenolic, tannin and saponin content in aqueous extract of fruit was more than that of aqueous extract of stem. Total flavonoid content of aqueous extract of fruit was found to be 279.33 mg quercetin equivalent per gram of dry extract. Variations in phytoconstituents and in vitro experimental data obtained through antioxidant as well as antimicrobial assay method indicates the existence of significant difference (p<0.05) between the antioxidant potency and zone of inhibition with S. aureus, V. cholerae, A. baumanii, which aqueous extract of stem failed to show at the same concentration (100 mg/ml), respectively and thus provided valid reasons to give superiority to aqueous extract of fruit as compared to aqueous extract of stem.
Keywords
Antioxidant, antibacterial, flavonoid, fruit, stem
From ancient times in India many plants are being used for treating different sicknesses [1,2]. Still there remain gaps in terms of deep understanding and thus remains the extent of filling these gaps with the information about the medicinal properties of different species. It is a very interesting fact that even different parts of a plant show different level of activities due to different phytoingredients in different concentrations. Herbal remedies possess an edge over their synthetic counter parts in being cost-effectual and safe with minimal side effects. In the scenario of increasing resistance of bacteria towards existing antibacterial drugs, amelioration through treatment with herbal antimicrobial agents could become an important option [3]. Antioxidants have the property to stabilize free radicals leading to cytoprotection from the deleterious effects of free radicals. Antioxidant phytoingredients such as phenolics, flavonoids, tannins, saponins and proanthocyanidines are commonly present in numerous medicinal plants, vegetables and fruits indicating their antioxidant potential [4]. In the form of crude extract or as isolated compounds there from, these can be used to reduce oxidative stress [5]. Olax psittacorum (Willd.)Vahl. belonging to the family Olacaceae, order Scrophulariales, is a flowering plant found throughout the topical area of the world. All components of this plant after methanol extraction have shown the presence of a saponin (olaxoside), which when given orally to mice exhibited antiswelling properties and decreased oedema caused by carrageenan. Olaxoside additionally possessed laxative action [5]. Another report demonstrated the total absence of saponin and low contents of flavonoids, triterpines and proanthocianidines after phytochemical screening of methanol extract of stem and leaf, but had shown potential antiviral activity against polio virus [6]. The leaf of O. psittacorum also showed body-protecting chemical activity [7].
Aim of the present study was to evaluate and compare the phytoconstituents both qualitatively and quantitatively, the free radical scavenging activity and the antibacterial properties of the aqueous extract of stem (SAE) and fruit (FAE) of O. psittacorum.
Materials and Methods
Fruits and stem of O. psittacorum was procured from Andharua, Bhubaneswar, Odisha during summer season, in the second week of May, 2015. The plant was identified and authenticated in the Regional Plant Resource Centre (RPRC), Bhubaneswar (Authentication Field Number, RMOP-1). All the chemicals and solvents utilized in the study were procured from Merck Specialties Private Limited.
Extraction
Fresh stem and fruits of O. psittacorum were washed in tap water to remove any contaminants [8] and then dried to get rid of water from the surface of the stem and fruits. The stem was then cut into small pieces and dried under shade at room temperature for 30 d, crushed and ground to coarse powder [9]. Fruits on the other hand were crushed directly. Course powder of dried stem and crushed fruit of O. psittacorum were subjected to maceration with distilled water for 72 h each. The extract was then filtered and lyophilized to obtain SAE and FAE. Percent yield was calculated utilizing the following Eqn. 1, yield (%) = (weight of extract g)/(weight of plant material set for maceration g)×100.
Phytochemical screening
SAE and FAE were subjected to various chemical procedures for the detection of alkaloids [10], glycosides [11], steroids and triterpenoids [10,11], flavonoids [12,13], proteins [11], carbohydrates and reducing sugars [11], tannins and phenolic compounds [13] and saponins [12] present in them, utilizing standard methods.
Quantitative estimation of total phenolic content (TPC)
The amount of TPC was determined using the Folin- Ciocalteu’s reagent (FCR) taking gallic acid as a standard. In a test-tube, 0.5 ml of the dissolved extracts (1 mg/ml) and 0.5 ml of gallic acid solution were taken and 2.5 ml of FCR (10 fold diluted) was added followed by addition of 2 ml sodium carbonate (7.5 %). Due to the presence of phenolic compounds the yellow colour of FCR turns blue. The test-tube was allowed to stand for 30 min at room temperature and absorbance was measured at 760 nm by UV-spectrophotometer and the results expressed as mg gallic acid equivalents/g dry extract [14].
Quantitative estimation of total tannin content (TTC)
The amount of TTC was determined using Folin-Denis reagent (FDR) taking tannic acid as a standard. One millilitre of dissolved extracts (1 mg/ml) and 1 ml of tannic acid solution from its different concentrations were taken into a test-tube and 1 ml of FDR was added followed by addition of 2 ml of 7.5 % sodium carbonate. Absorbance was measured on a spectrophotometer at 700 nm. Results were expressed as mg tannic acid equivalent/g in dry extract [15].
Quantitative estimation of total flavonoid content (TFC)
The amount of TFC was determined by aluminium chloride (AlCl3) method taking quercetin as a standard. In a test-tube 1 ml of plant extracts (1 mg/ml) and 1 ml of quercetin solution from its different concentrations were taken diluted with 4 ml of distilled water, followed by the addition of 0.3 ml sodium nitrite (10 %) and 0.3 ml of AlCl3 (10 %). After 6 min incubation at room temperature, 2 ml of 1 % sodium hydroxide solution was added and absorbance was measured at 510 nm on a spectrophotometer. Results were expressed as mg quercetin equivalent/g dry extract [16].
Quantitative estimation of total saponin content (TSC)
The amount of TSC was determined taking diosgenin as a standard. Both the aqueous extracts were dissolved separately in 80 % methanol followed by addition of 2 ml of vanillin solution and 72 % sulphuric acid (H2SO4). Mixing was done properly and heated on water bath for 10 min at 60°. Against reagent blank, absorbance was measured at 544 nm and all the determinations were done in triplicate. The TSC was expressed as mg diosgenin equivalent/g dry extract [17].
In vitro antioxidant study
The free radical scavenging activities of SAE and FAE and ascorbic acid (standard) were measured in relation to the hydrogen donating or radical scavenging capacity using the stable DPPH (2,2-diphenyl-1- picrylhydrazyl) radicals, ABTS (2,2’-azino-bis(3- ethylbenzothiazoline-6-sulfonic acid)di-ammonium salt) radicals and phosphomolybdate radical. Hydrogen peroxide assay and reducing power properties were further performed to confirm the antioxidant property of SAE and FAE. The percent scavenging of free radical activity was calculated by means of the following Eqn. 2, percent scavenging = (A0–A1)/A0×100, where, A0 is the absorbance of the control and A1 is the absorbance of the sample. The concentration of extract at which 50 % inhibition is observed (IC50) is calculated in μg/ml. DPPH radical scavenging assay is one of the prevalent methods of determining the antioxidant activity of plant extracts. Decrease in the absorbance was checked spectrophotometrically at 517 nm after 15 min and the percent scavenging (inhibition) was taken out using the Eqn. 2 along with their IC50 [4]. ABTS radical scavenging assay: decrease in the absorbance was checked spectrophotometrically at 745 nm and the percentage scavenging (inhibition) was taken out using the Eqn. 2 along with their IC50 [18]. In the hydrogen peroxide assay, the absorbance was quantified spectrophotometrically at 230 nm after 10 min of reaction time [19]. In the phosphomolybdate assay (TAC) the absorbance was quantified spectrophotometrically at 765 nm [14]. Absorbance was quantified at 700 nm for reducing power assay. Higher reducing power is denoted by high absorbance [20].
Antibacterial study
The antibacterial activity of the plant extracts were tested against two Gram-positive bacteria, Bacillus stereothermophillus (ATCC 7953) and Staphylococcus aureus (ATCC 29737) and four Gram-negative bacteria, Escherichia coli (ATCC 11229), Pseudomonas aeruginosa (ATCC 9027), Vibrio cholera (ATCC 51395) and Acinetobacter baumannii (ATCC 17978). All the microorganisms with ATCC number were obtained from the Laboratory of Microbiology, NICU, SUM Hospital, Bhubaneswar.
The antibacterial study of SAE and FAE was executed using the well diffusion method [21]. 15 ml of nutrient clear jelly (HiMedia) medium was poured in clean sterilized petri-plates and allowed to cool (and turn into a concrete). One hundred microlitres of the broth of bacterial strain was pipette out and spread over the medium evenly by a spreading rod till it is dried properly. Wells of 6 mm in through its centre were bored using sterile cork borers. Solutions of both the extracts (100 mg/ml) in distilled water were prepared. One hundred microlitres of the plant extract solutions were added to the wells. The petri-plates were created and grown at 37° for 24 h. Streptomycin (1 mg/ml) was used as a positive control and distilled water was taken as the negative control. Antibacterial activity was estimated by measuring the diameters of zones of inhibition. All measurements were done in triplicate.
Gas chromatography-mass spectrometry (GC-MS) Analysis
The GC-MS analysis of FAE and SAE was executed using Thermo Trace 1300 Gas chromatograph-Mass spectrophotometer amalgamated with TSQ 8000 Mass spectrophotometer, fitted with TG 5MS (30 m×0.25 mm, 0.25 μm) column. Helium was used as a carrier gas at a flow rate of 1 ml/min. Oven temperature was fixed from 60 to 280° at 10°/min. The injection temperature was set at 250° and the injection volume was taken as 1.0 μl with split ratio 1:10. MS transfer line temperature and ion source temperature was maintained at 280 and 230°, respectively and the mass spectra was taken at 70 eV (ionizing energy) for a total run time of 31 min.
Interpretation of the GC-MS spectrum was conducted by the help of data base obtained from the National Institute of Standard and Technology (NIST) library, which had been installed to the computer system attached with the instrument. Comparison of the mass spectrum of unknown components with the known one from NIST library on the basis of name, structure, molecular weight and fragmented ions achieved from the MS spectrum helps to identify the components present in the test substances were ascertained for GCMS analysis.
Statistical analysis
SPSS version 20 was used for statistical analysis. One-way ANOVA with p≤0.05 was used to spot the significant difference between SAE and FAE in in vitro antioxidant studies.
Results and Discussion
Regarding the selection of water as a solvent for extraction procedure attention has been given to the safety of the extract for consumption by human and cost effectiveness [22]. Literature revealed the fact that water can be used as a suitable solvent for extraction of polyphenols [22,23] and also support regarding the presence of flavonoids, steroids and terpenoids in water extract that being evaluated through phytochemical screening [24,25]. Percent yield (%) was calculated using Eqn. 1, which illustrates that percent yield of FAE (7.89 %), is more than that of SAE (4.9 %).
Quantitative estimation of phytoconstituents was ended up using the standard methods. The list of phytoconstituents in SAE and FAE is illustrated in Table 1 indicating that both SAE and FAE are devoid of any alkaloid. Both the extracts have tannin, saponin, steroids and terpenoids in them. Only SAE contain proteins and amino acids, while, glycoside, flavonoids and carbohydrate and reducing sugar is present in FAE.
Table 1: List of Phytoconstituents Present in SAE and FAE
| Phytoconstituents | SAE | FAE |
|---|---|---|
| Alkaloid | - | - |
| Glycoside | - | + |
| Steroids and terpenes | + | + |
| Flavonoids | - | + |
| Proteins | + | - |
| Carbohydrates and reducing sugar | - | + |
| Tannin and phenolic compounds | + | + |
| Saponin | + | + |
‘+’ and ‘-’ denotes the presence and absence of particular phytoconstituents, respectively
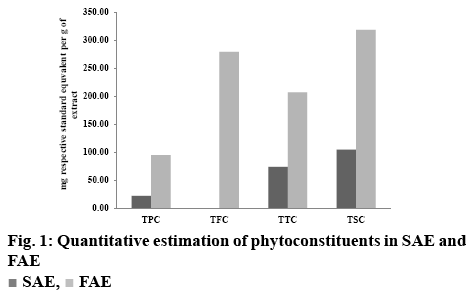
Results of quantitative estimation of TPC, TTC, TFC and TSC in SAE and FAE are depicted in figure 1 indicating that TPC, TTC and TSC in FAE are remarkably more than SAE. TFC of FAE is found to be 279.33 mg quercetin equivalent per gram of dry extract. TPC of SAE and FAE were 22.28 mg GAE/g of dry extract and 95.06 mg GAE/g of dry extract, respectively. TTC of SAE and FAE were 74.00 and 207.18 mg TAC/g of dry extract, respectively and TSC of SAE and FAE were 104.71 and 318.62 mg diosgenin equivalent/g of dry extract, respectively. Moreover, it is apparent that TSC>TFC>TTC>TPC in FAE and TSC>TTC>TPC in SAE. Thus, in both the extracts TSC was found to be more than the other phytoconstituents.
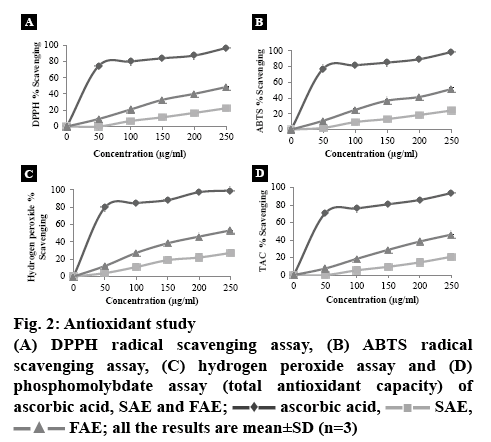
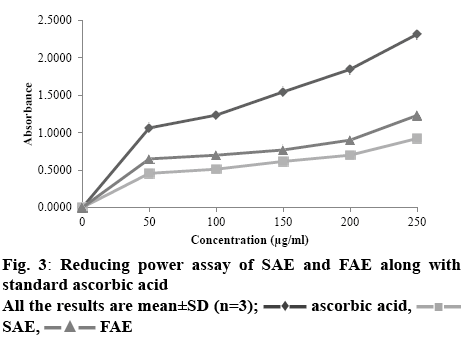
Using all the methods stated above, for antioxidant study of SAE and FAE illustrated a clear picture of FAE being more potent than SAE (figure 2A-D). In all the cases, percent inhibition increased with the increase in concentration. The IC50 values depicted in Table 2 supported the observation in figure 2 where the IC50 values of FAE with four different methods of free radical scavenging assay was clearly lower than that of SAE [26]. Reducing power of any compound is the reflection of its antioxidant potency [27]. The yellow colour of Fe3+/ferricyanide complex on reaction with the sample changes to ferrous form, which is green or blue colour (depending on the reducing power), called the Prussian blue in the reducing power assay. Higher reducing power is indicated by the higher absorbance of Fe2+ at 700 nm [28]. The result of reducing power assay is depicted in figure 3, which clearly showed the increase in absorbance with the increase in the concentration of extracts. The data for statistical evaluation was performed using SPSS version 20 (One-way-ANOVA), used to detect the significant difference between the extracts in antioxidant studies is depicted in Table 2. The data confirmed that there existed a significance difference between the antioxidant potency of SAE and FAE.
Table 2: IC50 Values of SAE and FAE in Different Antioxidant Assay Methods
| Method | Test material | IC50 (µg/ml) | F-value | P-value |
|---|---|---|---|---|
| DPPH radical Scavenging Assay | SAE | 549.47 | 7.4 | 0.000 |
| FAE | 249.77 | |||
| ABTS radical Scavenging Assay | SAE | 514.89 | 6.625 | 0.001 |
| FAE | 234.40 | |||
| H2O2 radical Scavenging Assay | SAE | 445.46 | 8.161 | 0.000 |
| FAE | 219.76 | |||
| Phosphomolybdate Assay | SAE | 603.75 | 7.566 | 0.000 |
| FAE | 258.59 | |||
| Reducing Power | SAE | NA | 18.558 | 0.000 |
| FAE |
Significance level, α=0.05
The results could be attributed to the presence of flavonoids and high TPC in FAE. Phenolic compounds and flavonoids in plants were reported to be the key phytoconstituents accountable for antioxidant activity [29]. Flavonoids are said to have tremendous scavenging potency. In addition to that, flavonoids also have ability to reduce lipid peroxidation of biological membranes [30]. On the other hand, extracts containing higher levels of TPC were reported to act as reducing agents and have the ability to inhibit, quench free radicals and terminate the radical chain reaction responsible for oxidative stress [31]. Free radical scavenging activity of any extract may be attributed to its phenolic content because, structurally phenols contain aromatic ring comprising of one or more hydroxyl substituent, that has the ability to scavenge free radicals by donating hydrogen atom [32], which supported scavenging activity of FAE and SAE due to the presence of phenolic content within them.
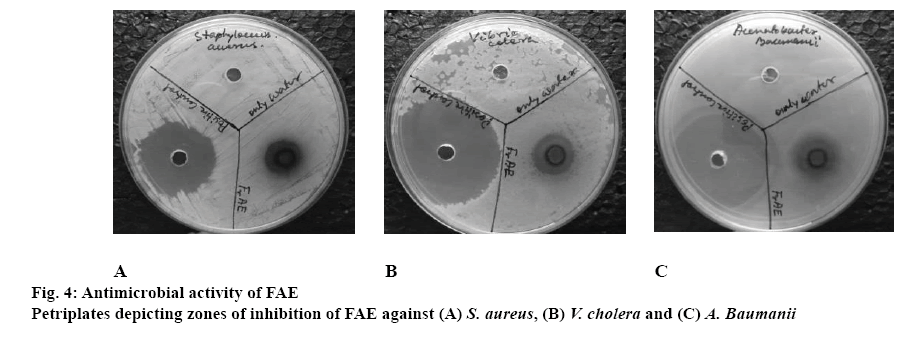
Table 3 portrayed the zones of inhibition of SAE and FAE along with the positive control, Streptomycin and negative control, distilled water. SAE showed no zone of inhibition at concentration 100 mg/ml. FAE at the same concentration showed a zone of inhibition with S. aureus, V. cholerae, A. baumanii as shown in figure 4. An increase in the concentration of the extract might result in the appearance of zone of inhibition with other bacteria. The accurate mechanism of action of phytoconstituents is not entirely explained thus far. But it is projected that the effectiveness of the medicinal plant extracts essentially depended on the extracting solvent used. Organic extracts proved to be more potent in terms of antimicrobial properties than the aqueous extracts [33]. Thus, in an earlier report, which included the antioxidant and antimicrobial study of methanol extract of the stem, showed zones of inhibition against all bacteria under test at 100 mg/ml concentration [34]. It is quite evident that evaluation of herbal activity on the whole depended upon the phytoconstituents present within it. So different solvent treatment might alter the pharmacological activity due to variations in phytoconstituents. This indicated the ability of the solvents to extract the metabolites present within the part of a plant tested according to their polarity or affinity of the metabolites towards the solvent used.
Table 3: Zone of Inhibition of SAE and FAE Along with Positive and Negative Controls
| Test organism | Zone of inhibition ±standard deviation (mm) | |||
|---|---|---|---|---|
| Negative control | Positive control | SAE | FAE | |
| S. aureus* | 0 | 23.33±1.15 | 0 | 8.67±0.58 |
| B. stereothermophillus* | 0 | 9.83±1.15 | 0 | 0 |
| P. aeruignosa | 0 | 32.83±0.58 | 0 | 0 |
| V. cholerae | 0 | 34.00±2.37 | 0 | 10 |
| E. coli | 0 | 26.67±1.26 | 0 | 0 |
| A. baumanii | 0 | 29.67±1.15 | 0 | 7±1 |
All the results are mean±SD (n=3); Gram-positive bacteria are indicated by ‘*’. Rest are Gram-negative bacteria
Flavonoids were reported to have potent antimicrobial property [35]. There were different mechanisms postulated by which tannin is responsible for producing antimicrobial activity. These mechanisms included inhibition of extracellular microbial enzymes, inhibition of oxidative phosphorylation in microbes, deprivation of substrates and iron required for microbial growth. Phenols have also been reported to show antimicrobial activities along with the flavonoids and tannins [36]. The presence of all the three phytoconstituents in FAE could be the reason for demonstrated antibacterial activity.
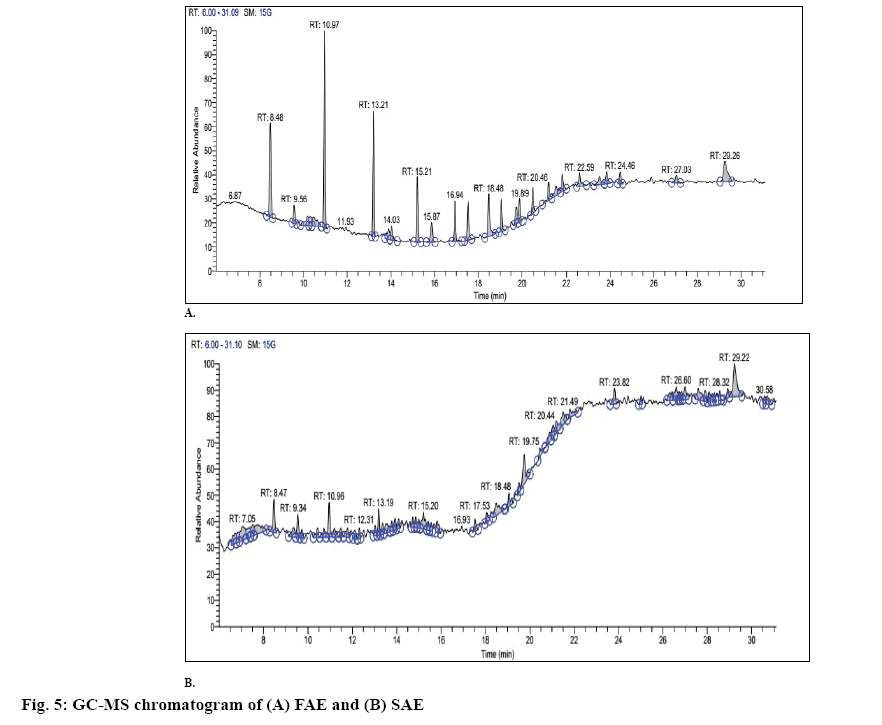
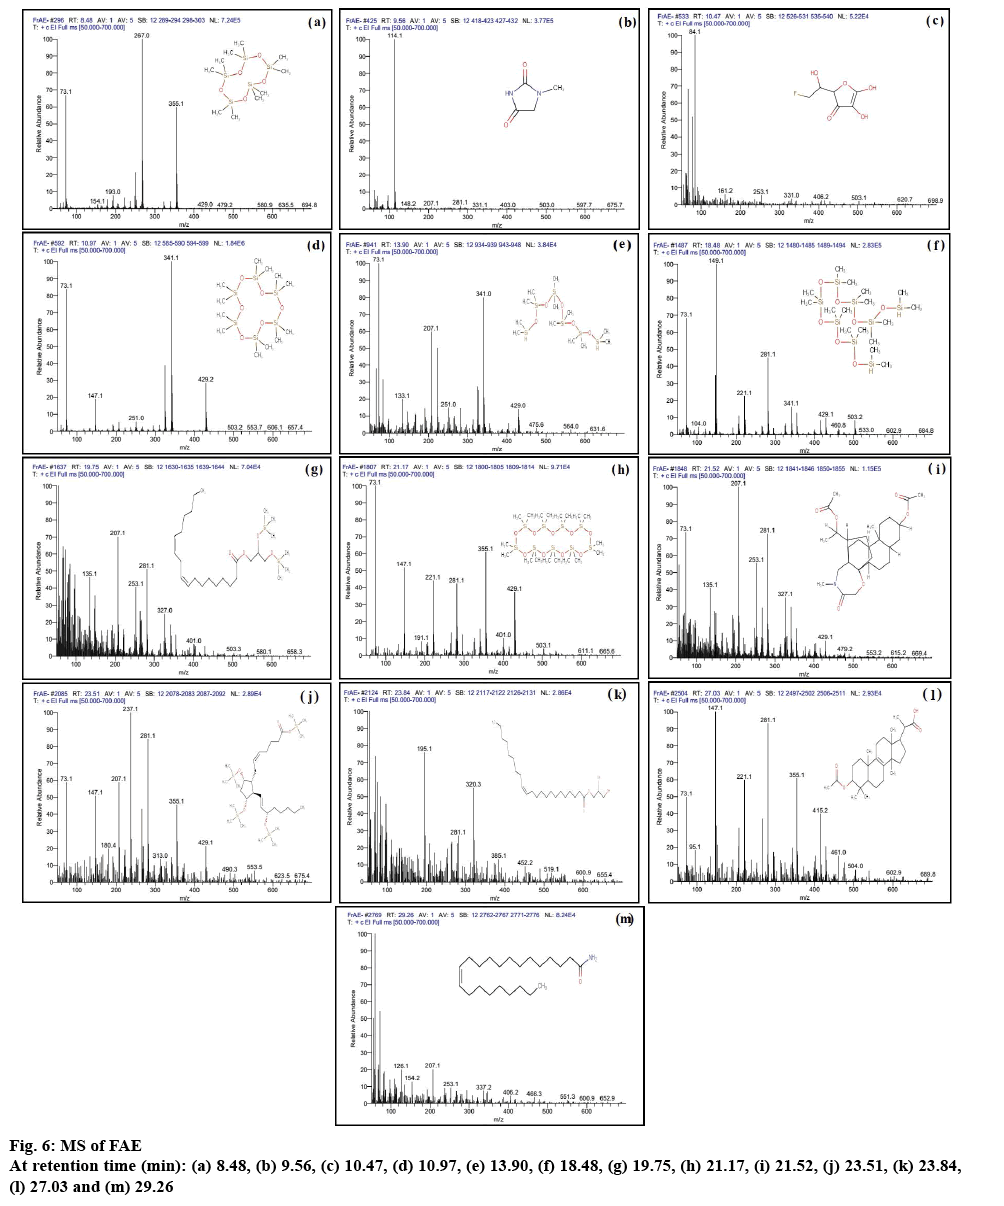
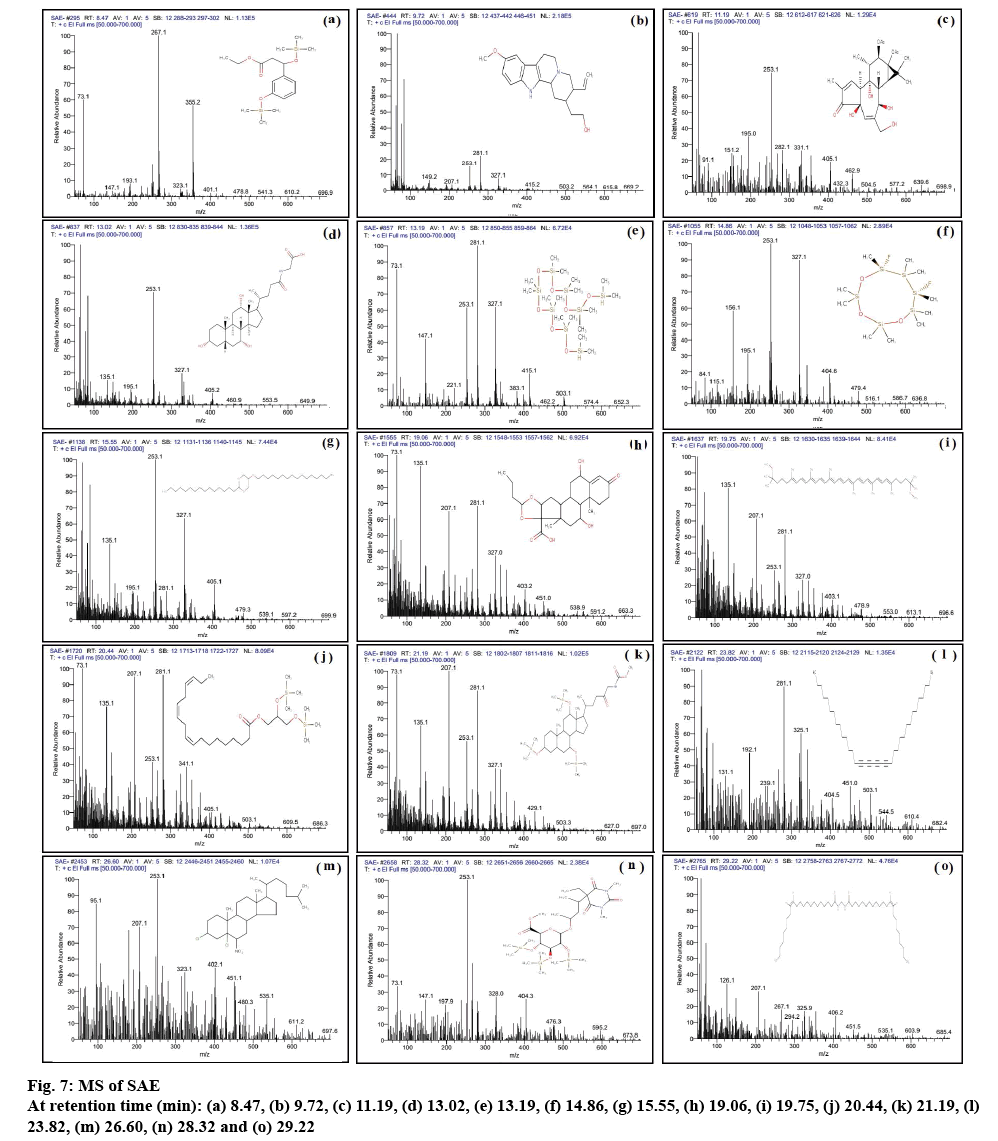
GC of FAE and SAE is depicted in figures 5A and B, respectively. GC-MS report of FAE and SAE is summerized in Table 4. The MS results of FAE and SAE are shown in figures 6 and 7, respectively. Compounds those were identified from FAE and SAE through GC-MS analysis have been summarised in Table 4, and the GC chromatograms have been shown in figure 5A and B, respectively. The MS results of FAE and SAE have depicted with respect to each compound that being identified as compared to NIST library shown in figures 6 and 7, respectively. Respective structure of identified compounds with respect to their retention time has mentioned in the figures 6 and 7. The GC-MS analysis of FAE and SAE shows the presence of a volatile organic compound like octasiloxane, 1,1,3,3,5,5,7,7,9,9,11,11,13,13,15,15-hexadecamethyl in figs. 6 and 7 having antimicrobial property [37]. Other compounds that are used for the same purpose found in FAE are hexasiloxane,1,1,3,3,5,5,7,7,9,9,11,11- dodecamethyl (figure 6), 1-monolinoleoylglycerol trimethylsilyl ether (figure 6), propanoic acid,2-(3- acetoxy-4,4,14-trimethylandrost-8-en-17-yl)- (figure 6) [38] and 13-docosenamide, (Z)- (figure 6) [39]. This explains the antimicrobial property of FAE shows against S. aureus, V. cholera and A. baumanii (figure 4) 1-Monolinoleoylglyceroltrimethylsilyl ether (figure 6) and cyclononasiloxane, octadecamethyl (figure 6) in FAE were known for their antioxidant property [39]. Both 1-monolinoleoylglyceroltrimethylsilyl ether (figure 6) and cyclononasiloxane, octadecamethyl figure 6 in FAE have antioxidant property, thus explaining the antioxidant property of FAE as illustrated in figures 2 and 3 and Table 2. The potential of antioxidant property can be elucidated with the peak area % of these compounds embraced in the GC-MS analysis as presented in Table 4. More the peak area, more is the concentration of the compound in the extract. 1-Monolinoleoylglyceroltrimethylsilyl ether is a steroid that is used as an antiinflammatory, antiarthritic, diuretic and antiasthamatic agent [39]. Propanoic acid,2- (3-acetoxy-4,4,14-trimethylandrost-8-en-17-yl)- and 1-monolinoleoylglycerol trimethylsilyl ether in FAE support as an antidiabetic agent [39-41]. Propanoic acid,2- (3-acetoxy-4,4,14-trimethylandrost-8-en-17-yl)- has antitumor potentiality[39]. Glycine, N-[(3à,5á,7à,12à)- 24-oxo-3,7,12 tris[(trimethylsilyl)oxy]cholan-24-yl]-, methyl ester of SAE depicted in fig. 7m has antibacterial and antiperspirant properties [39].
Table 4: GC-MS Result of FAE and SAE
| FAE | |||||
|---|---|---|---|---|---|
| RT | MF | MW | PA % | Compound | |
| 8.48 | C10H30O5Si5 | 370.77 | 10.23 | Cyclopentasiloxane,decamethyl- | |
| 9.56 | C4H6N2O2 | 114 | 2.02 | 2,4-Imidazolidinedione,1-methyl | |
| 10.47 | C6H7FO5 | 178.16 | 2.84 | Furan-2-one,3,4-dihydroxy-5-[1-hydroxy-2-fluoroethyl]- | |
| 10.97 | C12H36O6Si6 | 444.66 | 15.91 | Cyclohexasiloxane,dodecamethyl | |
| 13.90 | C12H38O5Si6 | 430.66 | 1.89 | Hexasiloxane,1,1,3,3,5,5,7,7,9,9,11,11-dodecamethyl | |
| 18.48 | C16H50O7Si8 | 578 | 5.15 | Octasiloxane,1,1,3,3,5,5,7,7,9,9,11,11,13,13,15,15-hexadecamethyl | |
| 19.75 | C27H54O4Si2 | 498 | 2.19 | 1-Monolinoleoylglycerol trimethylsilyl ether | |
| 21.17 | C18H54O9Si9 | 666 | 2.37 | Cyclononasiloxane,octadecamethyl | |
| 21.52 | C28H43NO6 | 489 | 2.31 | (5á)Preganane-3,20á-diol,14á,18á-[4-methyl-3-oxo-(1-oxa-4-azabutane-1,4-diy1)]-,diacetate | |
| 23.51 | C32H66O5Si4 | 642 | 1.70 | Prosta-5,13-diel-1-oic acid,9,11,15-tris[(trimethylsilyn)oxy]-,trimethylsilylester,(5Z,9á,11á,13E,15S)- | |
| 23.84 | C25H48O4 | 412 | 1.59 | 2,3-Dihydroxypropyl-cis-13-docosenoate | |
| 27.03 | C27H42O4 | 430 | 1.37 | Propanoic acid,2-(3-acetoxy-4,4,14-trimethylandrost-8-en-17-yl)- | |
| 29.26 | C22H43NO | 337 | 5.45 | 13-Docosenamide,(Z)- | |
| SAE | |||||
| 8.47 | C17H30O4Si2 | 354 | 3.35 | 3-(3-Hydroxyphenyl)-3-hydroxypropionic acid, ethyl ester, di-TMS | |
| 9.72 | C20H26N2O2 | 326 | 0.98 | Corynan-17-ol, 18,19-didehydro-10-methoxy- | |
| 11.19 | C24H32O9 | 464 | 1.52 | 5H-Cyclopropa[3,4]benz[1,2-e]azulen-5-one,9,9a-bis (acetyloxy) 1,1a,1b,2,4a,7a,7b, 8,9,9a- decahydro-2,4a, 7b-trihydroxy-3-(hydroxymethyl)-1,1,6,8-tetramethyl- | |
| 13.02 | C26H43NO6 | 465 | 0.97 | Glycocholic acid | |
| 13.19 | C16H50O7Si8 | 578 | 1.89 | Octasiloxane,1,1,3,3,5,5,7,7,9,9,11,11,13,13,15,15-hexadecamethyl- | |
| 14.86 | C10H30F2O3Si6 | 404.54 | 0.77 | 6,8-Difluoro-2,2,4,4,6,7,7,8,9,9-decamethyl-[1,3,5,2,4,6,7,8,9]trioxahexasilonane | |
| 15.55 | C35H70O3 | 538 | 0.73 | 1,3-Dioxane, 5-(hexadecyloxy)-2-pentadecyl-, trans- | |
| 19.06 | C25H34O7 | 446 | 1.64 | (22S)-6à,11á,21-Trihydroxy-16à,17à propyl methylenedioxypregna-1,4-diene-3,20-dione | |
| 19.75 | C42H64O2 | 600 | 4.66 | psi.,.psi.-Carotene, 1,1',2,2'-tetrahydro-1,1'-dimethoxy- | |
| 20.44 | C27H52O4Si2 | 496 | 1.19 | 9,12,15-Octadecatrienoic acid,2,3-bis[(trimethylsilyl)oxy]propyl ester, (Z,Z,Z)- | |
| 21.19 | C36H69NO6Si3 | 696.32 | 2.08 | Glycine,N-[(3à,5á,7à,12à)-24-oxo-3,7,12 tris[(trimethylsilyl)oxy]cholan-24-yl]-,methyl ester | |
| 23.82 | C36H58 | 514 | 1.79 | 15,17,19,21-Hexatriacontatetrayne | |
| 26.60 | C27H45Cl2NO2 | 482 | 2.11 | Cholestane, 3,5-dichloro-6-nitro-, (3á,5à,6á)- | |
| 28.32 | C29H56N2O10Si3 | 676 | 0.65 | D-Glucopyranosiduronic acid,3-(5-ethylhexahydro-1,3-dimethyl2,4,6-trioxo-5-pyrimidinyl)-1-methylbutyl 2,3,4-tris-O-(trimethylsilyl)-, methyl ester | |
| 29.22 | C45H86N2O2 | 686 | 6.66 | Bis(cis-13-docosenamido)methane | |
RT: retention time, MF: molecular formula, MW: molecular weight, PA: peak area
The experimental results of this study representing that both stem and fruits of this plant have in vitro antioxidant property but a comparison within them on basis of phytochemical screening indicated that parts having flavonoids, tannin and phenolic content would exhibit diverse medicinal property. Throughout this experiment as compared to SAE, FAE showed better percent yield, presence of flavonoid, higher phenolic, tannin and saponin content (quantitatively) with greater in vitro antioxidant and antibacterial property. Even though evaluation through GC-MS also work out the compounds present in FAE with supportive research articles influence its better performance as compare to SAE. In this study the stem did not show any antibacterial property, which also supported the importance of flavonoid content in FAE. GC-MS results showed few other constituents that can help FAE to prove useful as an antitumor, antiinflammatory, antiarthritic, diuretic and antiashmatic agents. Thus, it is necessary that FAE be further investigated for all the above uses and could prove to be with potential for the treatment of the above mentioned diseases.
Acknowledgements
We sincerely acknowledge School of Pharmaceutical Sciences, Siksha ‘O’ Anusandhan University for providing us facility and environment to work. We thank the Central Instrumentation laboratory, Sophisticated Analytical Instrumentation Facility (SAIF), Panjab University, Chandigarh for their assistance in GC-MS studies. We would also like to thank Laboratory of Microbiology, NICU, SUM Hospital, Bhubaneswar for providing us the microbial stains for the antibacterial study.
Conflict of interest
Authors reported that there is no conflict of interest.
Financial assistance and scholarship
Nil.
References
- McChesney JD, Venkataraman SK, Henri JT. Plant natural products: Back to the future or into extinction? Phytochemistry 2007;68:2015-22.
- Das PK. Some medicinal plants used by the tribals of Koraput, Orissa. Anc Sci Life 1995;14(3):191-6.
- Silva NCC, Fernandes JA. Biological properties of medicinal plants: a review of their antimicrobial activity. J Venom Anim Toxins Incl Trop Dis 2010;16(3):402-13.
- Saeed N, Khan MR, Shabbir M. Antioxidant activity, total phenolic and total flavonoid contents of whole plant extracts Torilis leptophylla L. BMC Complement Altern Med 2012;12:1-12.
- Forgacs P, Provost J. Olaxoside, a saponin from Olax andronensis, Olax glabriflora and Olax psittacorum. Phytochemistry 1981;20(7):1689-91.
- Fortin H, Vigor C, Devehat FL, Robin V, Bosse BL, Boustie J. et al. In vitro antiviral activity of thirty-six plants from La Reunion Island. Fitoterapia 2002;73:346-50.
- Sahu RK, Kar M, Routray R. DPPH Free Radical Scavenging activity of some leafy vegetables used by Tribals of Odisha. J Med Plants Stud 2013;1(4):21-7.
- Ng CF, Ko CH, Koon CM, Xian JW, Leung PC, Fung KP, et al. The aqueous extract of rhizome of Gastrodia elata protected Drosophila and PC12 cells against Beta-Amyloid-Induced neurotoxicity. Evid Based Complementary Altern Med 2013;2013:516741.
- Bae KE, Choi YW, Kim ST, Kim YK. Components of rhizome extract of Cnidium officinale Makino and their in vitro biological effects. Molecules 2011;16:8833-47.
- Iqbal E, Salim KA, Lim LBL. Phytochemical screening, total phenolics and antioxidant activities of bark and leaf extracts of Goniothalamus velutinus (Airy Shaw) from Brunei Darussalam. J King Saud Univ Sci 2015;27:224-32.
- Ismail AM, Mohamed EA, Marghany MR, Abdel-Motaal FF, Abdel-Farid IB, El-Sayed MA. Preliminary phytochemical screening, plant growth inhibition and antimicrobial activity studies of Faidherbia albida legume extracts. J Saudi Soc Agric Sci 2016;15:112-7.
- Khanam Z, Wen CS, Bhat IUH. Phytochemical screening and antimicrobial activity of root and stem extracts of wild Eurycoma longifolia Jack (Tongkat Ali). J King Saud Univ Sci 2015;27:23-30.
- Vastrad JV, Byadgi SA, Goudar G, Kotur R. Characterization of phytoconstituents in Leaf extracts of forest spices for textile applications. Forest Prod J 2014;64(7/8):259-64.
- Ahmed D, Fatima M, Saeed S. Phenolic and flavonoid contents and anti-oxidative potential of epicarp and mesocarp of Lagenaria siceraria fruit: a comparative study. Asian Pac J Trop Med 2014;7(S1):S249-S55.
- Padma R, Parvathy NG, Renjith V, Kalpana PR. Quantitative estimation of tannins, phenols nd antioxidant activity of methanolic extract of Imperata cylindrica. Int J Res Pharm Sci 2013;4(1):73-7.
- Park Y, Jung S, Kang S, Heo BG, Arancini-Avila P, Toledo F, et al. Antioxidants and proteins in ethylene-treated kiwi fruits. Food Chem 2008;107:640-8.
- Devanaboyina N, Ramalakshmi N, Satyanarayana B, Sudeepthi P, Hemachakradhar K, Raju NP. Preliminary phytochemical screening, quantitative estimation and evaluation of antimicrobial activity of Alstonia macrophylla stem bark. IJSIT 2013;2(1):31-9.
- Haddouchi F, Chaouche TM, Ksouri R, Medini F, Sekkal FZ, Benmansour A. Antioxidant activity profiling by spectrophotometric methods of aqueous methanolic extracts of Helichrysum stoechas subsp. rupestre and Phagnalon saxatile subsp. saxatile. Chin J Nat Med 2014;12(6):415-22.
- Alhaji UI, Samuel NU, Aminu M, , Chidi AV, Umar ZU, Umar UA, et al. In vitro antitrypanosomal activity, antioxidant property and phytochemical constituents of aqueous extracts of nine Nigerian medicinal plants. Asian Pac J Trop Dis 2014;4(5):348-55.
- Moein MR, Moein S, Ahmadizadeh S. Radical scavenging and reducing power of Salvia mirzayanii subfractions. Molecules 2008;13:2804-13.
- Chitravadivu C, Manian S, Kalaichelvi K. Antimicrobial studies on selected medicinal plants, Erode region, Tamil Nadu, India. Middle East J Sci Res 2009;4(3):147-52.
- Dent M, Verica DU, Penić M, Brnčić M, Bosiljkov T, Levaj B. The effect of extraction solvents, temperature and time on the composition and mass fraction of polyphenols in dalmatian wild sage (Salvia officinalis) Extracts. Food Technol Biotechnol 2013;51(1):84-91.
- Machado MTC, Mello BCBS, Hubinger M. Study of alcoholic and aqueous extraction of pequi (Caryocar brasiliense Camb.) natural antioxidants and extracts concentration by nanofiltration. J Food Eng 2013;117:450-7.
- Aiyegoro OA, Okoh AI. Preliminary phytochemical screening and in vitro antioxidant activities of the aqueous extract of Helichrysum longifolium DC. BMC Complement Altern Med 2010;10:21.
- Edeoga HO, Okwu DE, Mbaebie BO. Phytochemical constituents of some Nigerian medicinal plants. Afr J Biotechnol 2005;4(7):685-8.
- Odeja O, Obi G, Ogwuche CE, Elemike EE, Oderinlo Y. Phytochemical screening, antioxidant and antimicrobial activities of Senna occidentalis (L.) leaves extract. Clin Phytoscience 2015;1:1-6.
- Ferreira ICFR, Baptista P, Vilas-Boas M, Barros L. Free-radical scavenging capacity and reducing power of wild edible mushrooms from northeast Portugal: Individual cap and stipe activity. Food Chem 2007;100:1511-6.
- Arulpriya P, Lalitha P, Hemalatha S. In vitro antioxidant testing of the extracts of Samanea saman (Jacq.) Merr. Der Chemica Sinica 2010;1(2):73-9.
- Sahreen S, Khan MR, Khan RA. Evaluation of antioxidant activities of various solvent extracts of Carissa opaca fruits. Food Chem 2010;122:1205-11.
- Garcia-Lafuente A, Guillamon E, Villares A, Rostango MA, Martinez JA. Flavonoids as anti-inflammatory agents: implications in cancer and cardiovascular disease. Inflamm Res 2009;58:537-52.
- Shukla S, Mehta A, Mehta P, Bajpai VK. Antioxidant ability and total phenolic content of aqueous leaf extract of Stevia rebaudiana Bert. Exp Toxicol Pathol 2012;64:807-11.
- Medini F, Fellah H, Ksouri R, Abdelly C. Total phenolic, flavonoid and tannin contents and antioxidant and antimicrobial activities of organic extracts of shoots of the plant Limonium delicatulum. J Taibah Univ Sci 2014;8:216-24.
- Ammer MR, Zaman S, Khalid M, Bilal M, Erum S, Huang D, et al. Optimization of antibacterial activity of Eucalyptus tereticornis leaf extract against Escherichia coli through response surface methodology. J Radiat Res Appl Sci 2016;9:376-85.
- Majumder R, Dhara M, Adhikari L. Comparative study of leaves and stem methanolic extract on antioxidant and antimicrobial activity through Quantitative evaluation of phytoconstituents. IJETMAS 2015;3:208-16.
- Gurnani N, Gupta M, Mehta D, Mehta BK. Chemical composition, total phenolic and flavonoid contents and in vitro antimicrobial and antioxidant activities of crude extracts from red chilli seeds (Capsicum frutescens L.). J Taibah Univ Sci 2016;10:462-70.
- Jahan F, Lawrence R, Kumar V, Junaid M. Evaluation of antimicrobial activity of plant extracts on antibiotic-susceptible and resistant Staphylococcus aureus stains. J Chem Pharm Res 2011;3(4):777-89.
- Venkatesh R, Vidya R, Kalavani K. Gas chromatography and mass spectrophotometry analysis of Solanum villosum (Mill.), Solanaceae. Int J Sci Res 2014;5(12):5283-7.
- Kadhim MJ, Mohammed GJ, Hammed IH. In vitro antibacterial, antifungal and phytochemical analysis of methanolic extract of fruit Cassia fistula. Oriental J Chem 2016;32(3):1329-46.
- Senthil J, Rameashkannan MV, Mani P. Phytochemical profiling of ethanolic leaves extract of Ipomoea sepiara (Koenig Ex. Roxb). IJIRSET 2016;5(3):3140-7.
- Venkatachalam M, Singaravelu G, Govindaraju K, Ahn JS. PTP 1B inhibitory action of a phytochemical propanoic acid 2-(3-acetoxy-4,4,14-trimethylandrost-8-en-17-yl). Curr Sci 2013;105(6):827-32.
- Albinjose J, Jasmine E, Selvankumar T, Srinivasakumar KP. Bioactive compounds of Tinospora cordifolia by gas chromaography-mass spectrometry (GC-MS). Int J Multidiscip Res Dev 2015;2(1);88-97.

 ascorbic acid,
  SAE,
SAE, FAE; all the results are mean±SD (n=3)
 ascorbic acid,
  SAE,
SAE,  FAE
FAE