- *Corresponding Author:
- Neena Nair
Department of Zoology, Cell and Molecular Biology Laboratory, Centre for Advanced Studies, University of Rajasthan, Jaipur, Rajasthan 302004, India
E-mail: neenazoology@yahoo.co.in
| Date of Received | 07 January 2021 |
| Date of Revision | 08 April 2021 |
| Date of Acceptance | 03 August 2022 |
| Indian J Pharm Sci 2022;84(1):27-34 |
This is an open access article distributed under the terms of the Creative Commons Attribution-NonCommercial-ShareAlike 3.0 License, which allows others to remix, tweak, and build upon the work non-commercially, as long as the author is credited and the new creations are licensed under the identical terms
Abstract
Trace element copper is involved in myriad of physiological activities vital for normal function of organs of animals and humans from fetal development onwards. Its deficiency might occur in infants, children as well as adults and has been reported as a global problem affecting developed and undeveloped countries. Copper is essential for efficient iron uptake and mobilization. The present study evaluates the effect of dietary copper deficiency on erythrocyte of prepubertal male Wistar rats for 2, 4 and 6 w. Erythrocyte morphology, osmotic fragility, hematological parameters-hemoglobin, total leukocyte count, cell count (neutrophil, lymphocytes monocytes, eosinophils, platelets), packed cell volume, total red blood cell count, mean corpuscular volume, mean corpuscular hemoglobin and mean corpuscular hemoglobin concentration were evaluated. Occurrence of stomatocytes, echinocytes, dracocytes, acanthocytes, Howell-Jolly inclusion, microcyte and macrocytes were observed after 2 and 4 w of copper deficiency when compared with their respective control and pair fed groups. The extent of morphological changes enhanced after 6 w of dietary copper deficiency with additional appearance of fragmented cells and few elongated cells. The percentage of altered erythrocyte morphology after 2 w deficiency was 0.051 % which enhanced subsequently as duration increased to 0.081 % (4 w) and 0.1709 % (6 w). Consequent to these changes significant (p<0.05) increase in erythrocyte osmotic fragility, eosinophil and lymphocyte count was observed while hemoglobin, neutrophil and platelet count, packed cell volume, total red blood cell count, mean corpuscular volume, mean corpuscular hemoglobin and mean corpuscular hemoglobin concentration decreased. Monocyte decrease was not significant. These changes were more pronounced after 4 and 6 w. Dietary copper insufficiency caused impairment of membrane, deregulation of hematopoiesis and altered the hematological profile indicating detrimental changes in properties of cellular membrane which may probably be due to enhanced oxidative stress.
Keywords
Erythrocyte morphology, osmotic fragility, hematological parameters
Copper, a transitional trace element is involved in numerous physiological processes and is critical for both humans and several mammals particularly during the period of rapid postnatal growth[1-3]. Homeostasis of copper is regulated by cupric reductases[4-6], transporters[7], chaperones[8-9] and metallothionein[10]. Copper and iron, although required in miniscule amount being involved in numerous physiological functions, interaction exists due to same oxidation states as well as similar physiochemical properties. Ceruloplasmin–A copper protein, with a capacity to carry 95 % circulating copper[11], appears essential for iron oxidation after being released from liver, brain etc.,[12]. Besides iron, copper is also required for hemoglobin synthesis (mechanism unknown) probably being associated with iron import via transporters into and its utilization within mitochondria[1]. Copper may participate in the synthesis of haeme through cytochrome oxidase[13] via several mitochondrial proteins–COX17, SCO1 and SCO2[14].
Erythrocytes are sensitive cells and can serve as cellular indicators[15] to indicate onset of any physiological change occurring in the body. Dietary copper is essential for adequate supply as copper is involved in proper functioning of several enzymes particularly during pregnancy for normal development and growth[16]. Deficiency of copper leads to increased incidence of infection[17], failure of copper metalloenzymes[18] and copper trafficking proteins[19], imbalance of iron homeostasis[20], generation of free radicals[21] etc. The study was conducted as blood would be the one of the first organ besides liver which would be affected by the deficiency state and can easily be detected by testing before acute manifestations of symptoms occurs from affecting fetal development onwards. Hence, an attempt has been made to study the effect of dietary copper deficiency on erythrocyte morphology, osmotic fragility and hematological indices of prepubertal male Wistar rats.
Materials and Methods
The basal diets were formulated using ICN Research Diet Protocol (1999). The ingredients of the diet (per kg diet) were egg white/albumin 180 g, corn oil 100 g, corn starch 443 g, sucrose 200 g, cellulose 30 g, choline chloride 2 g, DL-methionine 7 g, AIN-76 salt mixture 35 g, AIN-76C vitamin-antibiotic mixture 10 g. Copper contents of basal diet for each group were estimated at 324.8 nm in air acetylene flame on GBC 902 atomic absorption spectrophotometer and copper concentrations were adjusted to 126 nmol/g and 6.3 nmol/g of copper sulfate.
30 prepubertal male Wistar rats (30-40 d; 35-50 g) were divided into four groups of 10 each Group 1: Copper Control (CC) group-Wistar rats were fed with diet containing 126 nmol Cu/g. Tap water was provided ad libitum; Group 2: Pair Fed (PF) group-Wistar rats were fed 126 nmol Cu/g diet but the amount of feed given was equal to the feed consumed by Copper Deficient (CD) group the previous day to account for stress and starvation effect. Tap water was provided ad libitum and Group 3: CD group-Animals were fed 6.3 nmol Cu/g diet and demineralized water was provided ad libitum..
Male Wistar rats were housed individually in polypropylene cages with stainless steel grills. Cages and water bottles were washed with detergent solution, demineralized water and finally rinsed in 1 % Ethylenediamine Tetraacetic Acid (EDTA) solution prepared in demineralized water for removal of copper traces. Experiments were carried out for 2, 4 and 6 w and approved by Department Research Ethics Committee and Committee for the Purpose of Control and Supervision of Experiments on Animals (CPSEA-1678/GO/Re/S/12). After completion of experiments, animals were anesthetized using sodium thiopentone (intravenous) and blood was collected by cardiac puncture in EDTA coated vials. Blood smear were prepared for the morphological as well as altered erythrocyte morphological studies in percentage. The altered morphological percentage was obtained by dividing it by the number of normal erythrocytes calculated (smear) and result multiplied by 100. Hematological parameters-Hemoglobin (Hb), Total Leukocyte Count (TLC), neutrophil, eosinophil, lymphocyte, monocyte and platelet count, Packed Cell Volume (PCV), Total Red Blood Cell (TRBC) count, Mean Corpuscular Volume (MCV), Mean Corpuscular Hemoglobin (MCH), Mean Corpuscular Hemoglobin Concentration (MCHC) were also evaluated.
25 μl blood was added to a series of 2.5 ml saline solution ranging from 0.00-0.80 g/100 ml in 5 mM phosphate buffer, pH 7.4. After gentle mixing it was incubated for 15 min at room temperature, centrifuged at 500 xg for 10 min and the absorbance of supernatants were measured at 540 nm on Systronics Spectrophotometer 169 (Serial No. 827). The Percent (%) haemolysis was calculated using formula[22]
% Haemolysis=Optical density of test/Optical density of distilled water (No NaCl)×100
Statistical analysis:
Data presented in the tables are given as mean± Standard Error of Mean (SEM). One way Analysis of Variance (ANOVA) was carried out separately for 2, 4 and 6 w experimental groups followed by post hoc test (Tukey’s multiple comparison test) if the difference was found to be significant. Data were analyzed using GraphPad Prism Version 7.0 e. p<0.05 was considered to be significant.
Results and Discussion
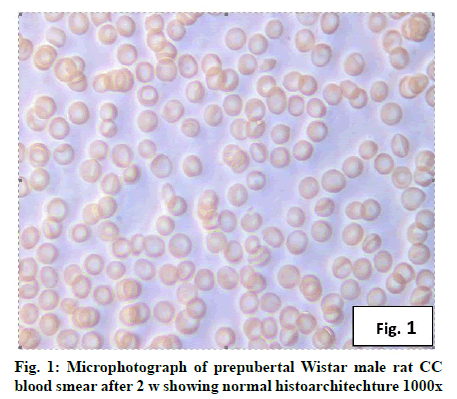
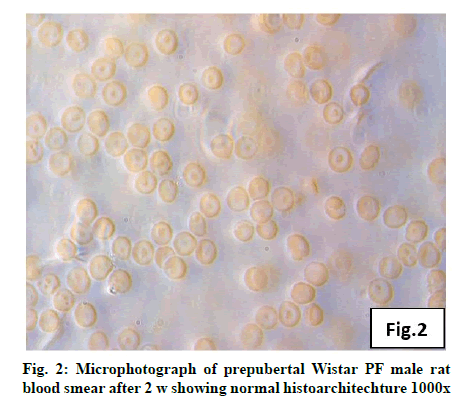
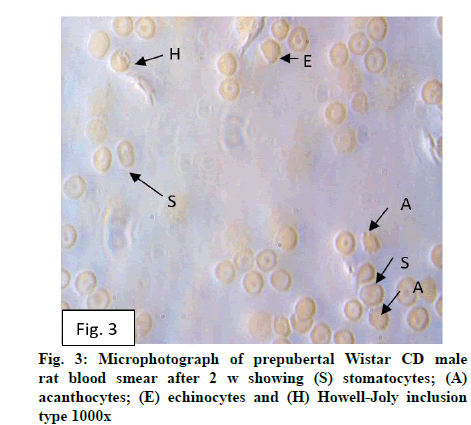
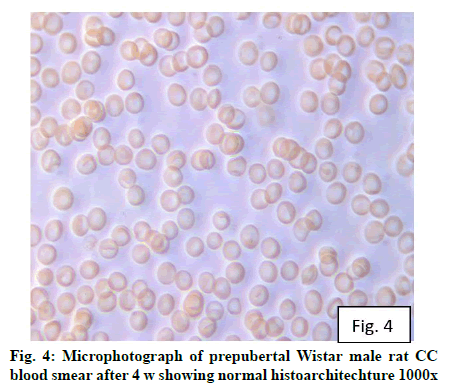
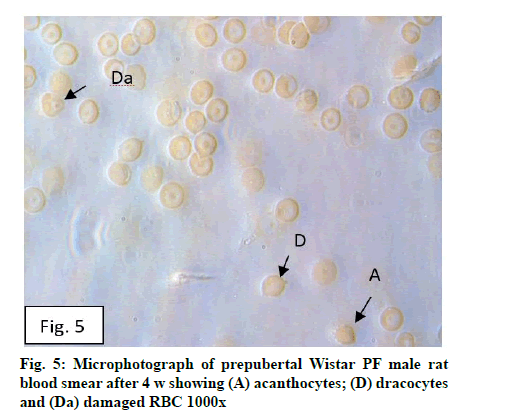
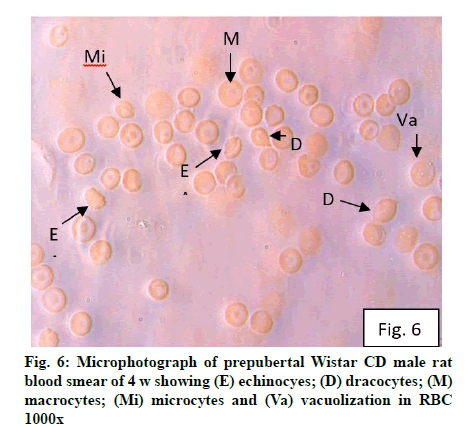
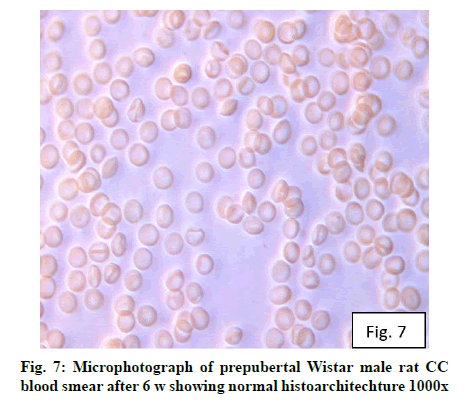
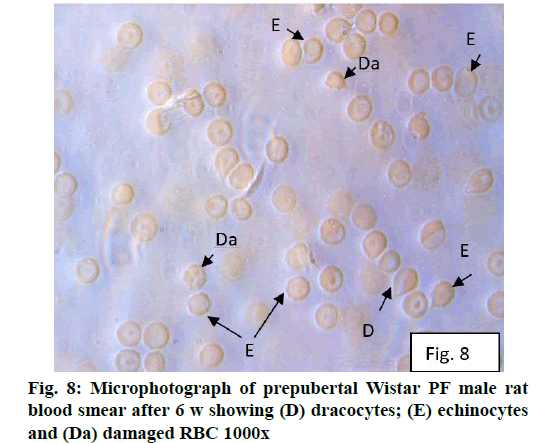
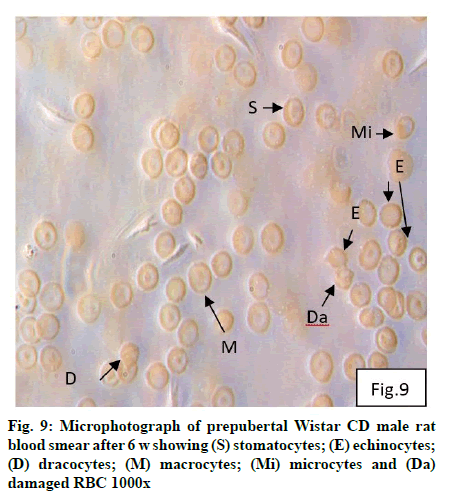
Deficiency of copper a global problem has been reported to affect other elements especially iron metabolism as ceruloplasmin and hephaestin having ferrioxidase activity is dependent on copper availability[1,23]. CC (fig. 1) and PF (fig. 2) group blood smear revealed normal histoarchitecture. Blood smear of CC (fig. 1) and PF (fig. 2) group of 2 w experiment revealed normal histoarchitecture. After 2 w of CD, morphological alteration in red blood cells were evident in the form of stomatocytes, acanthocytes, echinocytes (burr cells) and rarely Howell–Jolly type inclusion (fig. 3). Analysis further revealed significant altered erythrocyte morphology to be 0.0519 % in deficient animals (Table 1). Blood smear of 4 w experiment CC (fig. 4) group did not exhibit any change in morphology. PF group revealed few acanthocytes,dracocytes and damaged RBC (fig. 5). After 4 w of dietary CD, acanthocytes, echinocytes, dracocytes (tear drop), microcyte, macrocyte, degenerated RBC with vacuolization or with clear halo on one side were observed (fig. 6). Observed altered erythrocyte morphology revealed 0.0811 % in deficient group which was significant when compared with CC and PF group (Table 1). Blood smear of 6 w experiment CC (fig. 7) group revealed no change in blood cells. However, PF group revealed appearance of dracocytes and echinocytes (fig. 8). CD diet for 6 w exhibited large number of stomatocytes, acanthocytes, echinocytes, dracocytes, macrocytes, microcytes, fragmented RBC and few elongated cells (fig. 9). Significant altered erythrocyte morphology after deficiency (0.1709 %) and PF (0.0176 %) was observed (Table 1). Morphological changes observed in erythrocytes after CD can be due to several factors including osmotic fragility and changes in hematological indices taken into account in the present study. Changes observed in PF groups probably accounts for starvation and stress. Authors[24,25] reported decreased superoxide dismutase activity–copper dependent enzyme resulting in increased generation of superoxide radical which has the potential to cause damage to cell membrane. Structural integrity as well as mobility of integral proteins in RBC is maintained by spectrin and band 3-A most abundant protein involved in anion transport and lipids[15,25]. Western blot technique with anti-deoxyribonucleoprotein antibody revealed that during oxidative stress prominent 240 kDa and 210 kDa protein bands were detected with their molecular weights comparable with alpha and beta-spectrin chains with high carbonyl content suggestive of being targeted during such state[26]. Enhanced oxidative stress would have an effect on RBC on account of high level of polyunsaturated fatty acids, intracellular oxygen as well as hemoglobin[27]. Studies using Superoxide Dismutase 1 (SOD1), SOD-/- mice revealed that increased oxidative stress in erythrocytes enhances the production of auto-antibodies causing immune response[28]. Deficiency of copper has been reported to cause up regulation of Cyclooxygenase 2 (COX-2)–A pro-inflammatory enzyme which is also indicative of the fact that inflammation may function independently of SOD enzyme[29]. The occurrence of stomatocytes, acanthocytes, dracocytes, microcytes, vacuolization etc., in the present study indicates loss or defect in the RBC membrane. Deformability of RBC which can be retained in certain conditions is not only an indicator of pathological state, but also a determinant of blood viscosity[30-32]. The osmotic fragility increased significantly (p<0.05) with increase in Sodium Chloride (NaCl) (%) concentration in CD groups (2, 4 and 6 w) when compared with respective controls. 50 % osmotic fragility was observed at 0.25 % NaCl concentration (2 CC, 2 PF, 4 CC and 4 PF), 0.3 % NaCl concentration (2 CD and 6 PF), 0.35 % NaCl concentration (4 CD) and 0.38 % NaCl concentration (6 CD) (Table 2). Changes in RBC morphology enhance the susceptibility of erythrocyte to osmotic fragility–An indicator of hemolysis as observed in the present study. The occurrence of stomatocytes in CD groups is indicative of enhanced permeability of sodium leading to increase in osmotic fragility. Further, increased osmotic fragility may occur due to interaction of integral proteins as well as other proteins in RBC with reactive oxygen/nitrogen species.
| Weeks | CC group | PF group | CD group |
|---|---|---|---|
| 2 w | 0.0089 % | 0.0092 % | 0.0519 %b*c* |
| 4 w | 0.0098 % | 0.0107 % | 0.0811 %b*c* |
| 6 w | 0.0101 % | 0.0176 %a* | 0.1709 %b*c* |
Note: aCC vs. PF; bCC vs. CD and cPF vs. CD, *Significance level p<0.05
Multiple comparison procedures were performed for 2, 4 and 6 w experimental sub-groups
Table1:altered morphological erythrocytes (%) in cc, pf and cd male wistar rats after 2, 4 and 6 w of dietary cd (mean±sem)
| NaCl Conc. (g/ml) |
2 CC group | 2 PF group | 2 CD group | 4 CC group | 4 PF group | 4 CD group | 6 CC group | 6 PF group | 6 CD group |
|---|---|---|---|---|---|---|---|---|---|
| 0 | 100 | 100 | 100 | 100 | 100 | 100 | 100 | 100 | 100 |
| 0.1 | 90.88±0.59 | 96.26±0.16a* | 98.04±0.23b*c* | 89.01±0.24 | 93.96±0.21a* | 96.39±0.18b*c* | 87.60 ±0.39 | 93.11±0.38 a* | 95.83±0.13b*c* |
| 0.15 | 78.98±0.93 | 94.36±0.14a* | 96.07±0.23b* | 78.34±0.08 | 86.24±0.24a* | 93.98±0.15b*c* | 76.22±0.29 | 86.83±0.21a* | 92.06±0.21b*c* |
| 0.2 | 66.42±0.39 | 86.54±0.30a* | 90.55±0.20b*c* | 65.19±0.17 | 82.21±0.39a* | 89.23±0.25b*c* | 64.25±0.16 | 81.17±0.21a* | 86.40±0.45b*c* |
| 0.25 | 50.25±0.64 | 50. 60±0.31 | 75.81±0.14b*c* | 50.01±0.71 | 50.70±0.25 | 74.73±0.18b*c* | 50.29±0.50 | 66.43±0.34a* | 88.40±0.25b*c* |
| 0.3 | 46.72±0.19 | 48.08±0.23a* | 50.92±0.40b*c* | 46.08±0.28 | 48.12±0.35a* | 61.53±0.22b*c* | 44.67±0.67 | 50.31±0.17a* | 82.14±0.13b*c* |
| 0.35 | 44.54±0.33 | 45.85±0.03a* | 46.78±0.26 b*c* | 41.52±0.32 | 44.92±0.16a* | 50.55±0.44b*c* | 38.11±0.20 | 41.83±0.24a* | 66.39±0.13b*c* |
| 0.38 | 34.31±0.67 | 38.11±0.23a* | 40.20±0.04b*c* | 32.87±0.32 | 36.22±0.14a* | 40.35±0.22b*c* | 29.53±0.09 | 33.12±0.21a* | 50.23±0.22b*c* |
| 0.4 | 27.86±0.27 | 35.98±0.22a* | 38.61±0.17b*c* | 26.45±0.25 | 35.81±0.29a* | 38.79±0.35b*c* | 25.39±0.15 | 33.92±0.25a* | 36.62±0.13b*c* |
| 0.48 | 25.83±0.28 | 28.13±0.20a* | 33.26±0.08b*c* | 23.71±0.22 | 28.06±0.24a* | 32.92±0.26b*c* | 21.00±0.19 | 25.25±0.23a* | 32.12±0.21b*c* |
| 0.5 | 24.49±0.21 | 26.34±0.16 a* | 28.57±0.16b*c* | 22.56±0.08 | 25.58±0.28a* | 28.33±0.24b*c* | 20.98±0.22 | 23.38±0.13a* | 26.40±0.13b*c* |
| 0.6 | 23.26±0.29 | 25.75±0.13a* | 26.71±0.22b*c* | 21.69±0.32 | 25.75±0.32a* | 27.12±0.25b*c* | 16.21±0.19 | 20.70±0.26a* | 21.89±0.18b*c* |
| 0.7 | 19.88±0.23 | 23.42±0.16a* | 24.39±0.18b*c* | 18.97±0.13 | 21.67±0.24a* | 24.69±0.23b*c* | 13.03±0.19 | 17.27±0.18a* | 18.00±0.21b*c* |
| 0.8 | 18.24±0.17 | 22.75±0.10a* | 23.70±0.02b*c* | 15.93±0.27 | 22.08±0.27a* | 23.03±0.19b*c* | 9.67±0.23 | 14.81±0.07 a* | 18.00±0.21b*c* |
Note: aCC vs. PF, bCC vs. CD, cPF vs. CD, *Significance level p<0.05
Multiple comparison procedures were performed for 2, 4 and 6 w experimental sub-groups
Table 2: osmotic fragility of erythrocytes in cc, pf and cd male wistar rats after 2, 4 and 6 w of dietary cd (mean±sem)
Hemoglobin decreased significantly after CD (Table 3) indicating impairment of hemoglobin synthesis reducing oxygen carrying capacity leading to anemia. Moreover, increased osmotic fragility which reflects alteration of structural integrity of erythrocyte indicative of enhanced oxidative damage[33] as free radicals are also generated due to auto-oxidation of hemoglobin may also be the cause of anemia. World Health Organization (WHO)[34] reported iron deficiency anemia due to CD. Formation of hemosiderin, a proposed degradation product of ferritin, increased in animals deficient in copper[35]. CD anemia may possibly be due to: cytoplasmic vacuoles in the erythroid and myeloid precursors[36]; decrease in ceruloplasmin and cytochrome c involved in iron metabolism and transportation[23,37] and low hephastin in the intestinal mucosa and ceruloplasmin in liver due to which iron absorption decreases[38]. Vacuolization and ringed sideroblasts have been reported in early precursors of blood cells in bone marrow after CD[39,40]. Lee et al.[41] reported that deficiency of thioredoxin dependent peroxidases and peroxiredoxin II also causes anemia although exact mechanism is unknown. With increase in CD days/weeks anemia progressed along with damage to platelets probably due to enhanced oxidative damage to the cells. In the present study impaired hemoglobin synthesis is supported by the presence of microcytes, decreased total RBC count, PCV, MCV, MCH and MCHC (Table 3). Reeves et al.[23] also observed similar changes in hematological profile after CD diet to rats. However, no significant change was observed in monocyte count. Lymphocyte and eosinophil count increased although there was evident decrease in TLC (Table 3). The mechanism however remains unknown. Destruction of myeloid progenitor cells, reduced development and maturation of myeloid precursors, altered emigration of neutrophils from the bone marrow as well as increased clearance of neutrophils from the circulation may be associated with the formation of anti-neutrophil antibodies[42] which may explain decrease in neutrophil in the present study. Dietary CD produced severe effects on erythrocyte membrane that are manifested by enhanced osmotic fragility and morphological changes in erythrocytes along with alterations in blood parameters. These changes increased/decreased with duration. Hence, exposure to insufficient copper during critical period of development would have substantial impact which may be more severe if the dietary deficient state persists. These adverse effects would have serious impact on human health.
| Parameters |
2 CC group | 2 PF group | 2 CD group | 4 CC group | 4 PF group | 4 CD group | 6 CC group | 6 PF group | 6 CD group |
|---|---|---|---|---|---|---|---|---|---|
| Haemoglob (g/dl) | 8.28±0.03 | 8.05±0.02 | 7.51±0.11b*c* | 9.18±0.09 | 8.73±0.06a* | 6.21±0.09b*c* | 10.43±0.06 | 9.35±0.10a* | 5.80±0.28b*c* |
| TLC (Th/mm3) | 4.25±0.06 | 4.11±0.03 | 3.88±0.03b*c* | 4.40±0.04 | 4.08±0.03a* | 3.71±0.03b*c* | 4.35±0.05 | 3.81±0.03a* | 3.16±0.06b*c* |
| Lymphocytes | 47.33±0.21 | 47.67±0.21 | 48.67±0.21b*c* | 41.50±0.42 | 43.67±0.21 | 49.50±0.22b*c* | 46.50±0.22 | 47.00±0.44 | 58.50±0.22b*c* |
| Monocytes | 2.50±0.22 | 2.16±0.16 | 2.00±0.0 | 2.50±0.22 | 2.16±0.16 | 2.00±0.0 1 | 2.50±0.22 | 2.33±0.21 | 2.00±0.01 |
| Eosinophils | 2.50±0.22 | 2.50±0.22 | 3.33±0.21b*c* | 2.50±0.22 | 3.53±0.16a* | 4.90±0.22b*c* | 2.83±0.16 | 3.66±0.21a* | 5.50±0.22b*c* |
| Neutrophils | 47.67±0.21 | 46.67±0.21 | 44.83±0.30b*c* | 54.17±0.40 | 50.67±0.3a* | 47.17±0.30b*c* | 58.50±0.22 | 47.17±0.30a* | 36.17±0.16b*c * |
| Platelet Count (Lakh/mm3) | 1.46±0.02 | 1.45±0.01 | 1.31±0.03b*c* | 1.76±0.02 | 1.66±0.02a | 1.45±0.02b*c* | 1.98±0.03 | 1.63±0.03a* | 1.55±0.02b*c* |
| PCV (%) | 24.50±0.16 | 23.72±0.15 | 23.42±0.11b* | 28.03±0.18 | 25.07±0.26a* | 21.00±0.15b*c* | 31.03±0.15 | 27.15±0.12a* | 14.07±0.25b*c* |
| TRBC(MIL/CU-mm) | 2.71±0.01 | 2.60±0.00 | 2.57±0.01 | 3.18±0.04 | 2.81±0.03a* | 2.40±0.04b*c* | 3.31±0.04 | 3.15±0.02 | 2.72±0.14b*c* |
| MCV µm3(fL) | 75.90±0.23 | 74.85±0.06 | 72.43±0.11b*c* | 79.00±0.10 | 77.10±0.14 | 70.33±0.04b*c* | 79.72±0.19 | 76.50±0.09a* | 65.02±0.14b*c* |
| MCH (pg) | 25.22±0.09 | 25.03±0.07 | 24.22±0.09b*c* | 25.55±0.16 | 23.55±0.18 | 21.70±0.21b*c* | 25.80±0.11 | 24.30±0.13 | 18.07±0.18b*c* |
| MCHC (g/L) | 29.85±0.08 | 29.87±0.05 | 29.37±0.22 | 29.65±0.08 | 28.57±0.12 | 25.67±0.08b*c* | 30.15±0.09 | 29.62±0.10a* | 19.43±0.15b*c* |
Note:haematological parameters in cc, pf and cd male wistar rats after 2, 4 and 6 w of dietary cd (mean±sem)
Table 3: HAEMATOLOGICAL PARAMETERS IN CC, PF AND CD MALE WISTAR RATS AFTER 2, 4 AND 6 W OF DIETARY CD (mean±SEM)
Acknowledgement:
Ms. Aastha Saini thanks University Grants Commission for the award of Junior Research Fellowship (No. 22/06/2014 (1) EU-V) and Senior Fellowship. Ms. Ankita Rajendra Kurup thanks University Grants Commission, New Delhi for award of fellowship. The authors gratefully acknowledge Department of Zoology, Centre for Advanced Studies, University of Rajasthan, Jaipur, India, for providing necessary facilities.
Conflicts of interest:
The authors declared no conflicts of interest.
References
- Douger C, Ha JH, Collin JF. Interaction of iron and copper metabolism in mammalian intestine and liver. Compr Physiol 2018;8(4):1433-61.
[Crossref] [Google Scholar] [Pubmed]
- Hamza I, Gitlin JD. Copper chaperones for cytochrome c oxidase and human disease. J Bioenerg Biomembr 2002;34(5):381-8.
[Crossref] [Google Scholar] [Pubmed]
- Torres AS, Petri V, Rae TD, O'Halloran TV. Copper stabilizes a heterodimer of the yCCS metallochaperone and its target superoxide dismutase. J Biol Chem 2001;276(42):38410-6.
[Crossref] [Google Scholar] [Pubmed]
- Knöpfel M, Solioz M. Characterization of a cytochrome b558 ferric/cupric reductase from rabbit duodenal brush border membranes. Biochem Biophys Res Commun 2002;291(2):220-5.
[Crossref] [Google Scholar] [Pubmed]
- Ohgami RS, Campagna DR, McDonald A, Fleming MD. The Steap proteins are metalloreductases. Blood 2006;108(4):1388-94.
[Crossref] [Google Scholar] [Pubmed]
- Wyman S, Simpson RJ, McKie AT, Sharp PA. Dcytb (Cybrd1) functions as both a ferric and a cupric reductase in vitro. FEBS Lett 2008;582(13):1901-6.
[Crossref] [Google Scholar] [Pubmed]
- Wang Y, Hodgkinson V, Zhu S, Weisman GA, Petris MJ. Advances in the understanding of mammalian copper transporters. Adv Nutr 2011;2(2):129-37.
[Crossref] [Google Scholar] [Pubmed]
- Robinson NJ, Winge DR. Copper metallochaperones. Annu Rev Biochem 2010;79:537-62.
[Crossref] [Google Scholar] [Pubmed]
- Palumaa P. Copper chaperones. The concept of conformational control in the metabolism of copper. FEBS Lett 2013;587(13):1902-10.
[Crossref] [Google Scholar] [Pubmed]
- Miyayama T, Suzuki KT, Ogra Y. Copper accumulation and compartmentalization in mouse fibroblast lacking metallothionein and copper chaperone, Atox1. Toxicol Appl Pharmacol 2009;237(2):205-13.
[Crossref] [Google Scholar] [Pubmed]
- Altamura C, Squitti R, Pasqualetti P, Gaudino C, Palazzo P, Tibuzzi F, et al.Ceruloplasmin/Transferrin system is related to clinical status in acute stroke. Stroke 2009;40(4):1282-8.
[Crossref] [Google Scholar] [Pubmed]
- Patel BN, David S. A novel glycosylphosphatidylinositol-anchored form of ceruloplasmin is expressed by mammalian astrocytes. J Biol Chem 1997;272(32):20185-90.
[Crossref] [Google Scholar] [Pubmed]
- Chan WY, Rennert OM. The role of copper in iron metabolism. Ann Clin Lab Sci 1980;10(4):338-44.
[Google Scholar] [Pubmed]
- Kodama H, Fujisawa C. Copper metabolism and inherited coppertransport disorders: Molecular mechanisms, screening and treatment. Metallomics 2009;1(1):42-52.
- Pretorius E, Kell DB. Diagnostic morphology: Biophysical indicators for iron-driven inflammatory diseases. Integr Biol 2014;6(5):486-510.
[Crossref] [Google Scholar] [Pubmed]
- Uriu-Adams JY, Scherr RE, Lanoue L, Keen CL. Influence of copper on early development: Prenatal and postnatal considerations. Biofactors 2010;36(2):136-52.
[Crossref] [Google Scholar] [Pubmed]
- Vyas D, Chandra RK. Thymic factor activity, lymphocyte stimulation response and antibody producing cells in copper deficiency. Nutr Res 1983;3(3):343-9.
- Reeves PG, DeMars LC. Copper deficiency reduces iron absorption and biological half-life in male rats. J Nutr 2004;134(8):1953-7.
[Crossref] [Google Scholar] [Pubmed]
- Picco SJ, Abba MC, Mattioli GA, Fazzio LE, Rosa D, De Luca JC, et al. Association between copper deficiency and DNA damage in cattle. Mutagenesis 2004;19(6):453-6.
- Bertinato J, L'Abbé MR. Maintaining copper homeostasis: Regulation of copper-trafficking proteins in response to copper deficiency or overload. J Nutr Biochem 2004;15(6):316-22.
- Celedón G, González G, Lissi EA, Hidalgo G. Free radical-induced protein degradation of erythrocyte membrane is influenced by the localization of radical generation. IUBMB Life 2001;51(6):377-80.
[Crossref] [Google Scholar] [Pubmed]
- Faulkner WR, King JW. Manual of Clinical Laboratory Procedure, Chemical Rubber Company, Cleveland OH; 1970:354.
- Reeves PG, DeMars LC. Signs of iron deficiency in copper-deficient rats are not affected by iron supplements administered by diet or by injection. J Nutr Biochem 2006;17(9):635-42.
[Crossref] [Google Scholar] [Pubmed]
- Araya M, Pizarro F, Olivares M, Arredondo M, Gonzalez M, Méndez M. Understanding copper homeostasis in humans and copper effects on health. Biol Res 2006;39(1):183-7.
[Crossref] [Google Scholar] [Pubmed]
- Buys AV, Van Rooy MJ, Soma P, Van Papendorp D, Lipinski B, Pretorius E. Changes in red blood cell membrane structure in type 2 diabetes: A scanning electron and atomic force microscopy study. Cardiovasc Diabetol 2013;12(1):1-7.
[Crossref] [Google Scholar] [Pubmed]
- Sukalski KA, LaBerge TP, Johnson WT. In vivo oxidative modification of erythrocyte membrane proteins in copper deficiency. Free Radic Biol Med 1997;22(5):835-42.
[Crossref] [Google Scholar] [Pubmed]
- Aguirre F, Martin I, Grinspon D, Ruiz M, Hager A, De Paoli T, et al. Oxidative damage, plasma antioxidant capacity, and glucemic control in elderly NIDDM patients. Free Radic Biol Med 1998;24(4):580-5.
[Crossref] [Google Scholar] [Pubmed]
- Iuchi Y, Okada F, Onuma K, Onoda T, Asao H, Kobayashi M, et al. Elevated oxidative stress in erythrocytes due to a SOD1 deficiency causes anaemia and triggers autoantibody production. Biochem J 2007;402(2):219-27.
[Crossref] [Google Scholar] [Pubmed]
- Schuschke DA, Adeagbo AS, Patibandla PK, Egbuhuzo U, Fernandez-Botran R, Johnson WT. Cyclooxygenase-2 is upregulated in copper-deficient rats. Inflammation 2009;32(5):333-9.
[Crossref] [Google Scholar] [Pubmed]
- Tomaiuolo G. Biomechanical properties of red blood cells in health and disease towards microfluidics. Biomicrofluidics 2014;8(5):051501.
[Crossref] [Google Scholar] [Pubmed]
- Huisjes R, Bogdanova A, van Solinge WW, Schiffelers RM, Kaestner L, Van Wijk R. Squeezing for life–properties of red blood cell deformability. Front Physiol 2018;9:656-78.
[Crossref] [Google Scholar] [Pubmed]
- Diederich L, Suvorava T, Sansone R, Keller IV TC, Barbarino F, Sutton TR, et al. On the effects of reactive oxygen species and nitric oxide on red blood cell deformability. Front Physiol 2018;9:332-46.
[Crossref] [Google Scholar] [Pubmed]
- Senchenkova EY, Skvertchinskaya E, Dobrylko I, Sudnitsyna J, Gambaryan S, Mindukshev I, et al. Experimental oxidative stress-induced death of erythrocytes. FASEB J 2017;31:lb761.
- WHO Expert Committee on Leprosy, World Health Organization. WHO Expert Committee on Leprosy: Seventh Report. World Health Organization; 1998.
- Welch KD, Hall JO, Davis TZ, Aust SD. The effect of copper deficiency on the formation of hemosiderin in sprague-dawley rats. Biometals 2007;20(6):829-39.
[Crossref] [Google Scholar] [Pubmed]
- Oo TH, Hu S. Copper deficiency-related bone marrow changes secondary to long-term total parenteral nutrition. Clin Case Rep 2017;5(2):195-6.
[Crossref] [Google Scholar] [Pubmed]
- Huff JD, Keung YK, Thakuri M, Beaty MW, Hurd DD, Owen J, et al. Copper deficiency causes reversible myelodysplasia. Am J Hematol 2007;82(7):625-30.
[Crossref] [Google Scholar] [Pubmed]
- Nose Y, Kim BE, Thiele DJ. Ctr1 drives intestinal copper absorption and is essential for growth, iron metabolism and neonatal cardiac function. Cell Metab 2006;4(3):235-44.
[Crossref] [Google Scholar] [Pubmed]
- Mangles SE, Abdalla SH, Gabriel CM, Bain BJ. Case 37: Neutropenia and macrocytosis in a middle-aged man. Leuk Lymphoma 2007;48(9):1846-8.
[Crossref] [Google Scholar] [Pubmed]
- Angotti LB, Post GR, Robinson NS, Lewis JA, Hudspeth MP, Lazarchick J. Pancytopenia with myelodysplasia due to copper deficiency. Pediatr Blood Cancer 2008;51(5):693-5.
[Crossref] [Google Scholar] [Pubmed]
- Lee TH, Kim SU, Yu SL, Kim SH, Park DS, Moon HB, et al. Peroxiredoxin II is essential for sustaining life span of erythrocytes in mice. Blood 2003;101(12):5033-8.
[Crossref] [Google Scholar] [Pubmed]
- Percival SS, Bowser E, Wagner M. Reduced copper enzyme activities in blood cells of children with cystic fibrosis. Am J Clin Nutr 1995;62(3):633-8.
[Crossref] [Google Scholar] [Pubmed]
