- *Corresponding Author:
- Gaddam Madhuri
Department of Pharmaceutics, Rao’s College of Pharmacy, Nellore-524320
E-mail: g_madhuri3@yahoo.com
| Date of Submission | 30 September 2019 |
| Date of Revision | 18 December 2019 |
| Date of Acceptance | 18 January 2020 |
| Indian J Pharm Sci 2020;82(2):66-76 |
This is an open access article distributed under the terms of the Creative Commons Attribution-NonCommercial-ShareAlike 3.0 License, which allows others to remix, tweak, and build upon the work non-commercially, as long as the author is credited and the new creations are licensed under the identical terms
Abstract
To overcome the poor solubility and low bioavailability of lovastatin co-crystallization was attempted. Lovastatin co-crystals were prepared with selected co-former gallic acid by co-grinding method. Characterization was carried out through X-ray diffraction, Fourier Transform infra-red spectroscopy, differential scanning colorimetry and scanning electron microscopy. The Fourier-transform infrared spectroscopy results showed that a hydrogen bond was formed between lovastatin and gallic acid to yield a co-crystal. Micrometric properties, solubility, dissolution studies, pre-compression and post-compression properties were evaluated. Lovastatin co-crystals were formulated into conventional tablets. In vivo and stability studies were performed. Pharmacokinetic parameters and dynamic studies of the formulation were statistically analysed and a value of p<0.05 was considered to be significant. Thus physicochemical properties and bioavailability of lovastatin was improved through co-crystallization.
Keywords
Co-crystallization, micromeritic properties, bioavailability, lovastatin, in vivo studiesy
For pharmaceutical product development the main issues faced are stability, solubility, bioavailability and material properties of active pharmaceutical ingredients (API) [1]. Crystals are prioritized in pharmaceutical industry because of their greater stability and reproducibility compared to amorphous and other solids such as partially crystalline forms, sub-cooled liquid and different types of crystal forms with variable dissolution rates and intrinsic solubilities, which severely impact bioavailability [2-4]. Rapid growth has been reported in the design and synthesis of multi-component crystal systems [5]. Co-crystals are defined as crystalline complexes of two or more neutral molecular constituents bound together in a crystal lattice through non-covalent interactions, primarily hydrogen bonding [6]. Co-crystallization is an authentic method to alter the major properties of drugs such as solubility, dissolution rate, stability, hygroscopicity, photosensitivity, thermo sensitivity, flowability and compressibility without altering pharmacological properties [5,7]. The formation of a co-crystal involves an API and a pharmaceutically acceptable molecule known as co-former. The resulting multicomponent crystalline phase maintains the intrinsic activity of the parent API [8]. Co-former incorporated in co-crystallization process may be from various food additives, preservatives and pharmaceutical excipients or could even be another drug [9,10] but they must be GRAS (generally recognized as safe) substances.
Various forms of API such as salts, amorphous, solvates, polymorphs and inclusion complexes were produced for enhancing solubility, but all of these have some limitations in their utility [11,12]. Co-crystals are non ionizable, non-salt form of modified drug substances with better enhancement in physicochemical properties with no limitations in their utility.
The spring and parachute concept of amorphous drugs was considered to better understand the advantage of higher solubility of co-crystals. Dissociation of co-crystal within a few min of oral administration gives amorphous or nanocrystalline drug clusters, which are responsible for peak solubility in the aqueous medium (spring). The transformation of such metastable states to stable crystalline form in stages is capable of releasing high drug concentration for several hours (parachute) [13]. Lovastatin is a fungal metabolite isolated from cultures of Aspergillus terreus. The compound is an anticholesteremic agent. It inhibits 3-hydroxy-3- methylglutaryl coenzyme A reductase, which is the rate-limiting enzyme in cholesterol biosynthesis. It also stimulates the production of low-density lipoprotein receptors in the liver, is a Class II compound according to the biopharmaceutics classification system, exhibits poor oral bioavailability (<5%) due to its low solubility (1.3 μg/ml in water) and extensive metabolism in the gut, liver and transmembrane efflux via P-glycoprotein [14]. The aim of present study is to improve bioavailability by increasing the water solubility of lovastatin. Cocrystals of lovastatin were prepared with gallic acid to alter its physicochemical properties leading to enhanced solubility and dissolution rate. Gallic acid is soluble up to 1.5 g/100 ml in water, has hydrogen bond donor and acceptor groups, which can be used for designing cocrystals of lovastatin to enhance solubility.
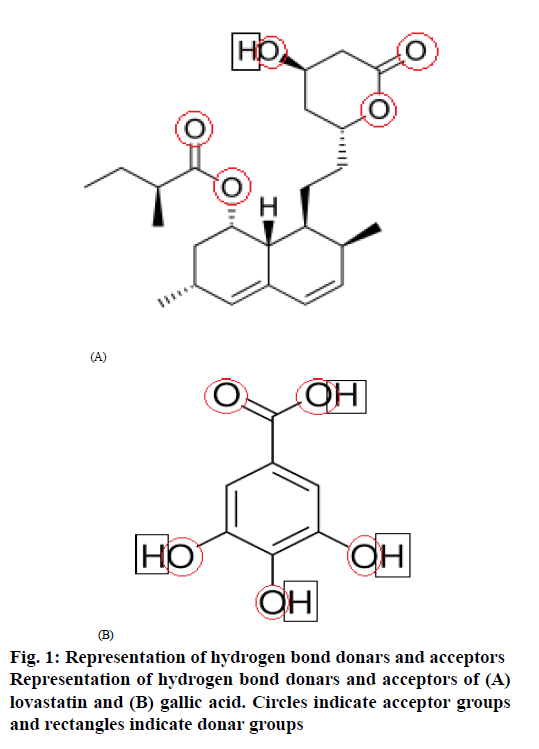
In co-crystal development one of the approaches of co-former selection is based on trial and error. Other approaches are supramolecular synthon approach which utilizes Cambridge Structural Database (CSD) to effectively prioritize co-formers for crystal form screening, Hansen solubility parameter and knowledge of hydrogen bonding between co-former and API [15,16]. With knowledge of hydrogen bond donors and acceptor groups of both lovastatin and gallic acid according to the CSD, Hansen solubility parameter, an attempt to form co-crystals of lovastatin was successful.
The circles drawn to represent hydrogen bond acceptor groups and rectangles drawn to represent hydrogen bond donar groups in the structures of lovastatin and gallic acid are shown in figure. 1. lovastatin has 1 donar and 5 acceptors, while gallic acid has 4 donars and 5 acceptors, which helps to show the probability of the formation of hydrogen bonding between lovastatin and gallic acid to form co-crystals as per CSD estimation.
Materials and Methods
Lovastatin was obtained as a gift sample from Beijing HWRK Chemicals Ltd., China, and gallic acid (Extra pure) was purchased from Molychem, Mumbai, India. All other the reagents were of analytical grade and distilled water was used.
Preparation of standard curve in pH 6.8 phosphate buffer:
One hundred milligrams of lovastatin was dissolved in 5 ml of methanol in a volumetric flask, made up to 100 ml with pH 6.8 phosphate buffer. From this primary stock 10 ml was withdrawn and transferred to another volumetric flask, and the volume was made up to 100 ml with pH 6.8 phosphate buffer. From this secondary stock solution, different volumes were taken in 10 ml volumetric flasks, the final volume was made up to 10 ml in each flask with pH 6.8 phosphate buffer, to obtain 5, 10, 15, 20, 25 and 30 μg/ml concentrations. The absorbance was measured at 236 nm on a UV spectrophotometer [17].
Attempts to prepare lovastatin co-crystals:
To prepare lovastatin co-crystals, the best co-former should be selected first with hydrogen bonding donor and acceptor ability. All the dicarboxylic acids, esters, ethers, some drugs and excipients can have good co-former character. Firstly the most suitable co-former was selected by trial and error using the basic method of co-grinding. Taking solubility as the main criteria, the co-former which produces greater solubility of lovastatin is selected. For optimizing the concentration of the co-former and a method of preparation, solvent drop grinding, slurry crystallization, slow evaporation, anti-solvent addition methods were attempted. Finally gallic acid was selected and the method of preparation chosen was the co-grinding method (Table 1).
| Compound | Co-formers | Method of preparation | Inference |
|---|---|---|---|
| Lovastatin | Citric acid | Co-grinding | Stable with low solubility |
| Tartaric acid | Co-grinding | Stable with low solubility | |
| Mannitol | Co-grinding | Stable with less solubility | |
| Oxalic acid | Co-grinding | Stable with low solubility | |
| Glutaric acid | Co-grinding | Stable with low solubility | |
| Malonic acid | Co-grinding | Stable with less solubility | |
| Maleic acid | Co-grinding | Stable with low solubility | |
| Fumaric acid | Co-grinding | Stable with less solubility | |
| Adipic acid | Co-grinding | Stable with less solubility | |
| Gallic acid* | Co-grinding | Stable with high solubility | |
| Succinic acid | Co-grinding | Stable with low solubility | |
| Alanine | Co-grinding | Stable with low solubility | |
| Glycolic acid | Co-grinding | Unstable |
*Gallic acid showed high solubility of lovastatin and selected for further study
Table 1: Co-Formers Attempted to Make Co-Crystals of Lovastatin
Preparation of lovastatin co-crystals by co-grinding method:
Pharmaceutical lovastatin co-crystals were prepared with gallic acid and lovastatin in 1:1 molar ratio using the co-grinding method. Lovastatin and gallic acid were pre milled separately for 15 mins, equimolar quantity of these were added to mortar, ground continuously for 45 min in a mechanical grinder. The powder was then scratched from walls of mortar and dried at 40 and stored in a vial.
Melting point of prepared lovastatin co-crystals:
Melting point of pure lovastatin, co-formers and co-crystals were obtained using the capillary method in liquid paraffin. The capillary filled with drug powder was placed in a melting point apparatus and the liquid paraffin was heated, melting point of drug powder was noted when it melted in the capillary.
Scanning electron microscopy (SEM):
The morphology of the co-crystals was examined under the SEM equipped with an energy dispersive X-ray (EDX). The samples were covered with carbon coating in order to increase conductivity of the electron beam. Operating conditions were accelerating voltage 15 KV current 87000nA.
Differential scanning calorimetry (DSC):
Thermal analysis of lovastatin and prepared lovastatin co-crystals were recorded individually on a DSC (Q200 Waters). The samples were scanned at 10°/min over a temperature range of 50- 300º with nitrogen gas in an aluminium pan.
Fourier transform infrared (FT-IR) studies:
FT-IR spectra of pure lovastatin and prepared co-crystals were recorded individually on a PerkinElmer FTIR spectrophotometer by mixing them with potassium bromide. Scans were recorded in the range of 400-4000 cm-1.
Powder X-ray diffraction (XRD):
Powder XRD was performed at room temperature with an X-ray diffractometer. Monochromatic Cu radiation was obtained with a Ni-filtration and a system of diverging and receiving slides of 1.0º and 0.3 mm, respectively. The diffraction pattern was measured with a voltage of 40 kV and current of 30 mA over a 2θ range of 10-80º using a sampling pitch of 0.02º with a scan speed of 4º/min.
Drug solubility study:
An excess quantity of co-crystals was added to 10 ml of distilled water, sealed, protected from light and placed in a shaker for 48 h. After equilibrium was attained, the contents of the flask was filtered through a 0.45 μm Millipore filter. The filtrate was diluted to 100 ml with distilled water and the content of lovastatin was estimated on a UV spectrophotometer at 236 nm. Lovastatin content in the filtrate was calculated from the UV absorption value and solubility is calculated using a calibration curve [18] using the formula, concentration = absorbance/slope. The solubility of lovastatin is the concentration of it present in the solution. The concentration of drug can also be calculated from the formula [19] A=ɛct, A is the absorbance, t is the length of path, c is the concentration and ɛ is the molar absorptivity of lovastatin.
Drug dissolution study:
A dissolution study was carried out for lovastatin and prepared co-crystals using USP type I (basket type) dissolution aparatus with 900 ml of pH 6.8 phosphate buffer as the dissolution medium at 37±0.5°. Samples were withdrawn at definite time intervals (10 min) for 1 h and each time fresh dissolution medium was added to replace the volume sampled and the samples were quantified using a UV spectrophotometer at 236 nm [17].
Micromeritic properties:
Angle of repose for lovastatin and lovastatin co-crystals was determined using the fixed funnel method. Accurately weighed lovastatin and co-crystals were taken in a funnel. The height of the funnel was adjusted in such a way that the tip of the funnel just touched the apex of the heap of the powder. The powder was allowed to drift through the funnel freely to the bottom. The height and diameter of the powder cone was measured and angle of repose was calculated [17]. Tan θ=h/r, where, θ is the angle of repose, h is the height in cm, r is the radius in cm, Angle of repose 25-30 represented excellent flow properties, 31-35 represented good flow properties, 36-40 indicated fair flow properties, 41-45 showed passable flow properties.
Bulk density and tapped density:
Bulk density and tapped density were determined with the aid of the bulk density apparatus. Apparent bulk density was determined by pouring the blend into a graduated cylinder. The bulk volume (Vb) and weight of the powder (M) was determined [17]. The bulk density was calculated using the formula, Db=M/Vb, where, M is the mass, Vb is bulk volume. The measuring cylinder of the apparatus was filled with a known mass of blend and was tapped for a fixed period time. The minimum volume (Vt) occupied in the cylinder and the weight (M) of the blend was measured [17]. The tapped density was calculated using the formula, Dt=M/Vt, where, M is the mass and Vt is the tapped volume
Carr’s index (%):
The compressibility index has be proposed as an indirect measure of bulk density, size and shape, surface area, moisture content and cohesiveness of a material because all of these can influence the compressibility index. CI (%) = (tapped density–bulk density)/ tapped density)×100. Values below 15 % indicated good flow characteristics, whereas those above 25 % indicated poor flowability. Values in the range of 1-10 indicate excellent flow properties, 11-15, good flow properties,16-20 fair to passable and 21-25 indicated passable [17].
Hausner’s ratio:
It is a divergent index of powder flow. It is calculated using the formula, Hausner’s ratio= tapped density(ρt)/ bulk density (ρb), Lower Hausner’s ratio (<1.25) indicated better flow properties than higher rations. Ratios between 1.25 to 1.5 reflected moderate flow properties and more than 1.5 indicated poor flow [17].
Tablets preparation, direct compression:
Direct compression method was used for preparing lovastatin tablets. Main advantages of direct compression are low manufacturing cost and high mechanical integrity of the tablet. Lovastatin co-crystals and other ingredients were initially added to a clean mortar. By continuous mixing of all ingredients for 10 min in a mortar to produce geometrical distribution of drug in the bulk powder. Final mixture was compressed on a tablet punching machine, using the manual hydraulic press at constant pressure. The composition of the compressed tablets is as follows, lovastatin 60 mg, microcrystalline cellulose 70 mg, lactose 130 mg, starch (5%)- 15 mg and magnesium stearate (1.5%) – 5 mg.
Tablet evaluation, weight variation and hardness:
Pre-compression properties are the micromeritic properties of formulations such as angle of repose, bulk density, tapped density, Carr’s index, and Hausner’s ratio [17], the determination of which was already described. Post-compression properties included the weight variation test, which was performed as follows. Twenty tablets were randomly selected, weighed individually and all together in an electronic balance [20]. The average weight of 20 tables was calculated and weight variation was calculated. Weight variation=average weight-weight of each tablet/average weight ×100. The thickness and diameter of tablets were determined in mm using Vernier callipers. Randomly 5 tablets were selected, average thickness and diameters were determined. Hardness of tablets was measured using diametric compression in a Monsanto hardness tester. Randomly selected 5 tablets were subjected to the hardness test and average hardness was calculated.
Friability test:
The friability of tablets was measured in a Roche friabilator with 20 tablets randomly selected were weighed to obtain initial weight (W1) followed by placing these tablets in the friabilator and subjected to 100 revolutions after which the final weight (W2) of 20 tablets was weighed. The percent weight loss was calculated as, % friability=(W1−W2)/W1)×100. The % friability should be preferably between 0.5 and 1.0%.
Disintegration test:
Six tablets were randomly selected and placed in the glass tubes of a USP disintegration test apparatus. Distilled water was used as the disintegrating medium, the bath temperature was maintained at 37±2º, and 30 cycles/min of movement frequency was adjusted. The tablets were observed for 30 min to see if any residue is left in the glass tubes and the time taken for the tablets to disintegrate was noted.
Comparative in vitro drug release study [17,21,22]:
Drug release studies with pure lovastatin, lovastatin co-crystal tablets and marketed tablets were carried out in a USP dissolution apparatus type Ι set at 50 rpm with 900 ml of pH 6.8 phosphate buffer maintained at 37±0.5º as the dissolution medium. At specific time intervals up to 1 h, samples were withdrawn for analysis at 236 nm on a UV spectrophotometer against pH 6.8 Phosphate buffer as blank. Each withdrawn sample volume was replaced with an equal volume of fresh pH 6.8 phosphate buffer to maintain sink conditions.
Stability studies of lovastatin co-crystal tablets:
Stability studies of the optimized lovastatin Co-crystals tablets were performed under the conditions of 40±2º/75±5 % relative humidity and 25±2º/60 ±5 % relative humidity for a period of 90 d. Tablets were analysed for physical appearance, solubility and dissolution [23,24].
In vivo studies:
The proposed protocols to test lovastatin tablets in healthy Wistar rats and New Zealand rabbits were approved by the Animal Ethics Committee of Sanzyme Labs Pvt Ltd. Hyderabad with Registered No 1688/PO/ Rc/8/13/2011/CPCSEA. Proposal no 526.
Pharmacokinetic studies [25]:
Twenty four Wistar Rats (200-250 g) were placed in an air-conditioned environment (20-25º) and exposed to a photoperiod cycle (12 h light/12 h dark) daily. These 24 rats were divided into 4 groups of 6 rats each. The first group was given normal feed, water and served as control. The second group was administered with 80 mg/kg of lovastatin, the third group was administered with lovastatin co-crystal tablets equivalent to 80 mg/ kg. The fourth group was administered with marketed lovastatin tablets equivalent to 80 mg/. The lovastatin (80 mg/kg) was dissolved in a small volume of methanol, diluted with distilled water and was administered in the morning of the experiment day, after 12 h of fasting. After drug administration, blood (0.3 ml) was collected from the tip of the tail at 1, 1.5, 2, 2.5, 4, 6 and 8 h in heparinised Eppendorf tubes. The samples were centrifuged after adding 100 μl of acetonitrile at 8000 rpm for 30 min and the supernatant plasma was collected with a micropipette. After filtration 20 μl sample was injected into the HPLC system.
Preparation of lovastatin standard calibration curve:
Lovastatin (10 mg) was dissolved in 10 ml of methanol to prepare a stock (1 mg/ml) solution. Serial dilutions were made using this stock solution to obtain 1000, 3000, 5000, 7000 and 9000 ng/ml concentrations of lovastatin. These dilutions were added to 200 μl of drug-free rat plasma, vortexed for 15 min, 600 μl of acetonitrile added, vortexed for another 15 min followed by centrifugation at 6000 rpm for 10 min and analysed using a RP-HPLC method at 236 nm.
The RP-HPLC conditions used were, 1.0 ml/min pump flow rate and auto sampler injection volume of 20μl. Auto sampler and column oven temperature was maintained at 20º. Mobile phase used was a mixture of 65 % methanol and 35 % (0.25 %) formic acid. A 150×4.8 mm, 5 μm C18 column was used.
High cholesterol diet (HCD) and high glucose diet [26]:
A 2 % cholesterol diet was prepared by adding 2 g of cholesterol powder (Sigma-Aldrich) and 3 g of glucose to each 100 g of powdered rabbit chow pellets. Cholesterol was dissolved in 40 ml of chloroform in order to achieve a uniform distribution throughout the feed. After thorough mixing chloroform was removed by drying the feed in hot air oven at 50º.
Male albino rabbits (1.5 to 2 kg) were randomly distributed into 4 groups of 3 animals each, housed in well-ventilated aluminium cages and maintained on uniform diet and temperature with 12 h light and dark cycle. Before commencing the experiment, all animals were fasted for 18 h with water provided ad libitum, but water was withdrawn during the experiment. After collection of initial blood samples, drugs were administered in the following order. Group I (normal) animals were maintained on Purina chow to have normal cholesterol and glucose levels. Group II (control) animals were given placebo formulation and these rabbits were rendered hypercholesterolemic and diabetic. Group III animals were given 6 mg/kg equivalent lovastatin tablet formulation. Group IV animals received 6 mg/kb equivalent lovastatin co-crystal tablet formulation. Blood was withdrawn weekly from marginal ear vein of rabbits 2 h after administration of drugs for one month. Serum cholesterol, total lipid content and glucose levels was determined using in vitro diagnostic kits. Determination of serum HDL, LDL, triglyceride and glucose levels was carried out using diagnostic kits.
Statistical analysis:
GraphPad Prism 6 software was used to analyze pharmacokinetic parameters statistically. For comparison of all PK parameters of F5 and F6 paired t-test was used and a value of p<0.05 was considered to be significant. One way ANOVA was used to determine any differences were within the PK parameters obtained in a group (in 6 animals) with significant variance (P<0.05) and P value is <0.0001. In pharmacodynamic studies total serum lipid profile values were significant when compared with positive control group. *P<0.05, (one way ANOVA followed by Dunnett’s test). Blood glucose values at 4 w were significant *p<0.05, when compared with Group-III vs. Group-IV.
Results and Discussion
Solubility and melting point data of different preparations were presented in Table 2. LG1 coded preparation showed enhanced solubility when compared with pure lovastatin. Although some of the other preparations showed greater solubility enhancement than LG1, these were not chosen for further studies due to the fact that the ratio of gallic acid and lovastatin led to bulky size, which would produce problems to formulate and obtain patient acceptance. Melting point is one of the most important physicochemical properties of co-crystals and considered as the preliminary test for confirmation of changes occurred in free drug. When the co-crystals were formed the melting point must lie in between the melting points of the two individual molecules, but either below or above the melting point of the drug. If such results are obtained, it would serve as a confirmation that the co-crystals have formed [6]. It was found that the melting point of preparation was 165°, which was different from the melting points of lovastatin (178°) and the co-former gallic acid (260°) confirming the formation of co-crystals with some chemical interaction between both molecules [9].
| Code | Co-crystal components | Ratio of drug:Co-former |
Method of preparation | Melting point (°) | Solubility (mg/ml) |
|---|---|---|---|---|---|
| LG1* | Lovastatin+gallic acid | 1:1 | Co-grinding | 165 | 0.248* |
| LG2 | Lovastatin+gallic acid | 1:2 | Co-grinding | 168 | 0.264 |
| LG3 | Lovastatin+gallic acid | 1:3 | Co-grinding | 163 | 0.281 |
| LG4 | Lovastatin+gallic acid | 1:4 | Co-grinding | 160 | 0.261 |
| LG5 | Lovastatin+gallic acid | 1:5 | Co-grinding | 250 | 0.255 |
| LG6 | Lovastatin+gallic acid | 1:1 | Solvent drop grinding | 165 | 0.146 |
| LG7 | Lovastatin+gallic acid | 1:1 | Slow evaporation | 105 | 0.119 |
| LG8 | Lovastatin+gallic acid | 1:1 | Anti solvent addition | 103 | 0.005 |
| LG9 | Lovastatin+gallic acid | 1:1 | Slurry crystallization | 125 | 0.152 |
| PL | Pure lovastatin | 178 | 0.0024 |
Table 2: Physical Characteristics of Lovastatin Co-Crystal Preparations with Gallic Acid (Co-Former).
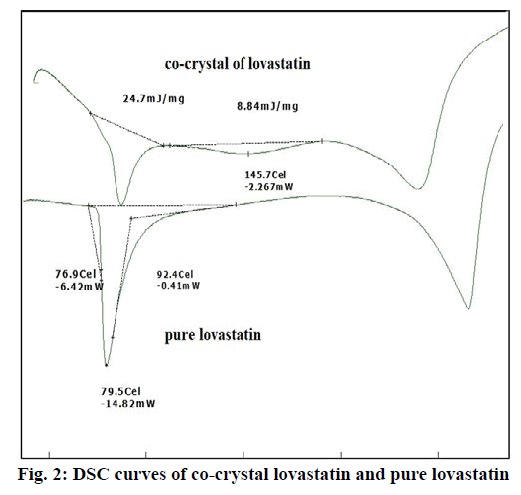
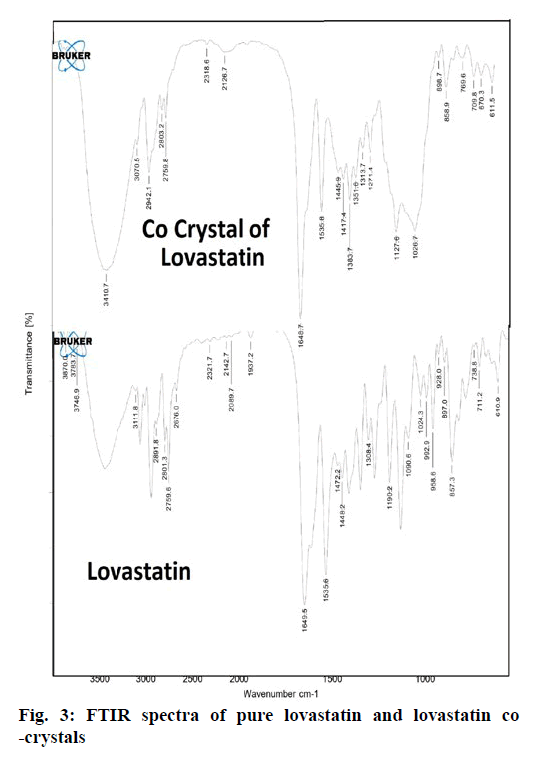
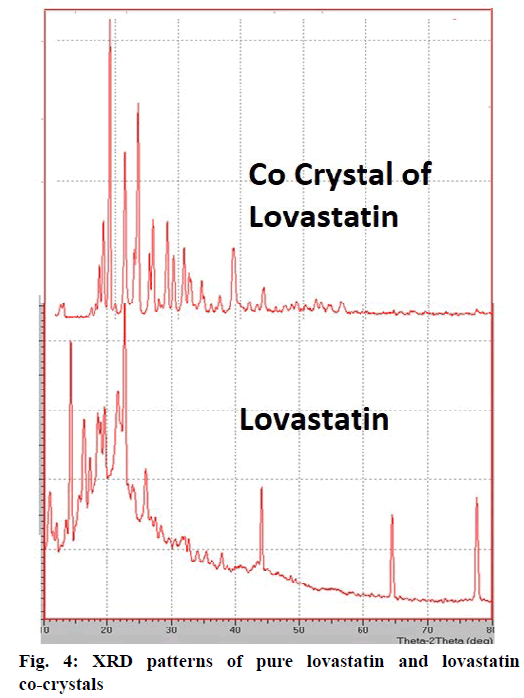
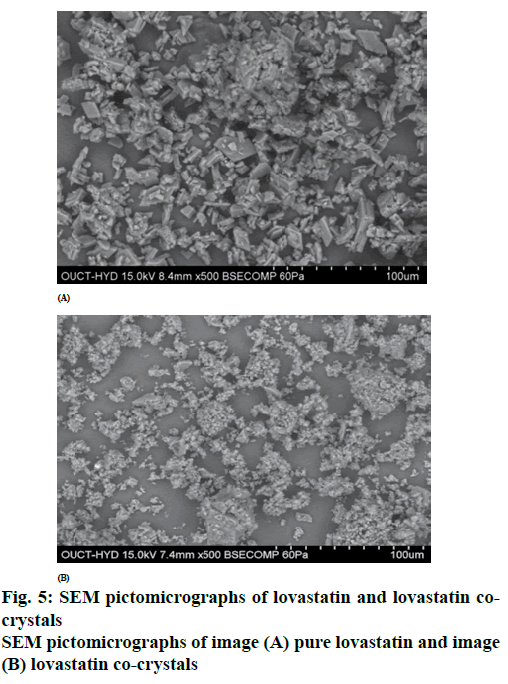
From the DSC thermograms (figure. 2), it was observed that the prepared co-crystals were different in pattern and intensity, from that of lovastatin indicating the formation of a chemical bond. The shift in the melting point is due to the change in crystal arrangement of the lovastatin with gallic acid, forming a relatively different crystal lattice leading to co-crystal formation. Pure lovastatin curve showed sharp melting peak at 79.5º while co-crystal curve showed a large broader peak at 145.7º, these changes occurred on the account of interaction induced by weak cohesive forces and bonded together by reversible hydrogen bonding, suggesting the formation of co-crystals. The FTIR spectrum of pure lovastatin (figure. 3) showed characteristic absorption peaks at 3746.9 (O-H stretching of free alcohol), 2801.3 and 2759.6 (O-H stretching of intramolecular bonding of alcoholic group), 1649.5 (C=C stretching for conjugated alkenes), 1448.2 (C-H bending of methyl group in alkane), 1308.4 (C-O stretching of ester). But spectrum of lovastatin co-crystals showed additional absorption peaks at 3410.7, 1127.6 and 1026.7, which indicated the O-H stretching of intermolecular hydrogen bonding, C-O stretching of secondary alcohol due to formation of hydrogen bonding between lovastatin and gallic acid. This served as the evidence for hydrogen bonding between lovastatin and gallic acid, leading to co-crystals. XRD is one of the most important characteristics for identification of interactions between the components. A different XRD pattern of co-crystals from lovastatin confirmed the interaction between them [27]. The crystallogram patterns in figure. 4 clearly showed sharp distinct peaks, which were at different 2θ value with different intensities in each crystallogram, however some of the 2θ values of pure lovastatin disappeared in the co-crystal crystallogram. It confirmed the formation of co-crystals by hydrogen bonding between lovastatin and gallic acid with different new crystal habitat. In addition, there was a decrease in the degree of crystalinity of lovastatin that might have occurred due to the bonding of lovastatin with the co-former resulting in the formation of lovastatin co-crystals. SEM images in figure. 5 of pure lovastatin and lovastatin co-crystals clearly showed that there was a change in the size and shape due mostly to bonding by the gallic acid crystals as shown in the image B, which is distinct from image A, indication the formation of lovastatin co-crystals. Saturation solubility of lovastatin co-crystals was 0.248 mg/ml which is 100 times more than the solubility of lovastatin 0.0024 mg/ml. Table 3 showed the pre-compression and post-compression properties which were within the limits of USP guidelines. Figure. 6 in which in vitro dissolution profiles of formulations were shown, F5 (co-crystal formulation) showed prominent increase in percent drug release as compared to pure lovastatin formulation (F6) and marketed tablets. Stability studies of optimized lovastatin co-crystal tablets (F5) under 2 different conditions were carried out for 90 days, the results of which were shown in Table 4. These studies indicated that there were no significant changes in the physical parameters, post compression properties and % drug release during 60 min, after storing under temperature and humidity condition of 25±2º/60±5 % relative humidity. However storage under temperature and humidity condition of 40±2º/ 75±5 % relative humidity showed slight decreased in percent drug released within 60 min.
| Properties | F1 | F2 | F3 | F4 | F5 | F6 |
|---|---|---|---|---|---|---|
| Bulk density (mg/ml3) | 292±1.1 | 293±1.3 | 290±1.5 | 290±1.8 | 295±1.3 | 295±1.3 |
| Tapped density (mg/ml3) | 345±1.2 | 344±1.1 | 340±1.3 | 344±1.5 | 359 ± 1.6 | 359±1.8 |
| Angle of repose(°) | 24±1 | 25±2 | 26±1.1 | 27±1 | 29 ±1.2 | 29±1.4 |
| Carr’s index(%) | 15.3±0.3 | 14.8±0.4 | 14.7±0.5 | 15.6±0.2 | 17.8±0.5 | 17.8±0.3 |
| Hausner’s ratio | 1.18±0.02 | 1.17±0.01 | 1.17±0.02 | 1.18±0.06 | 1.21±0.02 | 1.21±0.03 |
| Hardness (kg/cm2) | 4.6 ± 0.8 | 4.7 ±0.5 | 4.6±0.6 | 4.8±0.4 | 4.9±0.4 | 4.9±0.3 |
| Thickness(mm) | 3.6 ±0.2 | 3.5±0.4 | 3.6±0.2 | 3.4±0.3 | 3.6±0.2 | 3.6±0.2 |
| Friability (%) | 0.77±0.02 | 0.65±0.05 | 0.75±0.03 | 0.7±0.01 | 0.63±0.03 | 0.72±0.02 |
| Disintegration time (sec) | 225±2 | 205±3 | 190±2 | 184±3 | 154±4 | 158±2 |
| Weight variation (mg) | 277±2 | 276±2.6 | 275±2 | 277±2 | 275±1.6 | 261±1.5 |
| % Drug release for 1 h | 43.55 | 44.66 | 46.15 | 50.23 | 55.35 | 4.22 |
Table 3: Pre-Compression and Post-Compression Properties of Tablet Formulations.
| Evaluation parameters | 25° with 60 %RH* | 40° with 75 %RH |
|---|---|---|
| Physical appearance | No change in colour | No change in colour |
| Melting point (°) | 165 | 163 |
| Hardness (kg/cm2) | 4.9±0.5 | 4.0±0.85 |
| Thickness (mm) | 3.6±0.1 | 3.5±0.3 |
| Friability % | 0.63±0.02 | 0.57±0.03 |
| Disintegration time (sec) | 155±3 | 150±2 |
| Weight variation (mg) | 276±1 | 270±3 |
| % drug release on d 1 | 55.35±1.6 | 55.5±1.9 |
| % drug release on d 90 | 52.02±1.3 | 50.81±1.7 |
*Significant p<0.05 when compared with 25º and 60 % RH vs. 40° and 75 % RH
Table 4: Comparative Stability Studies of Lovastatin Co-Crystal Tablets (F5) Between Two Conditions
The preliminary pharmacokinetic parameters recorded in Table 5 showed that oral absorption of lovastatin co-crystal tablets (F5) was higher and extended when compared to pure lovastatin tablets (F6) and marketed tablets, which was clearly shown in in vivo plasma drug concentrations (figure. 7). T1/2 value of F5 increased when compared to that of F6. Increased dissolution rate and solubility of F5 were the reasons of enhanced plasma concentration of lovastatin. Pharmacodynamic studies demonstrated the significant anticholesterolemic activity of formulation F5 (Table 6). In this co-crystal preparation gallic acid was used as co-former, which was reported to possess antidiabetic activity at the dose employed in this study and the data in Table 7 clearly indicated a significant antidiabetic activity of gallic acid in the formulation when compared to pure lovastatin formulation.
| Pharmacokinetic parameters | F6 (pure lovastatin) | F5 (co-crystal lovastatin) | Marketed tablet |
|---|---|---|---|
| Cmax (µg/ml) | 456±9.843 | 578±10.114* | 478±14.123* |
| Tmax (h) | 2±0.096 | 2.5±0.068* | 2.5±0.091* |
| t½ (h) | 5.31±0.26 | 8.7±0.666* | 8.1±0.792* |
| MRT (h) | 0.08±0.004 | 0.084±0.006* | 0.081±0.008* |
| Total AUC (µg/h.ml) | 2832.66±8.688 | 4815.2±11.942* | 4025.3±25.268* |
| Cl (ml/min) | 3.03±0.24 | 2.436±0.009* | 2.232±0.27* |
| Kel (h-1) | 0.1±0.003 | 0.095±0.005* | 0.097±0.006* |
| Vd (ml) | 26.84±5.25 | 21.56±4.98* | 22.68±7.62* |
Table 5: Comparison of Pharmacokinetic Parameters Between F5, F6 and Marketed Tablets.
| Groups | Serum cholesterol (mg/dl) | Triglycerides (mg/dl) | HDL-C (mg/dl) | LDL-C (mg/dl) | VLDL-C (mg/dl) |
|---|---|---|---|---|---|
| Normal control | 67.33±3.98 | 57.17±2.40 | 38.67±4.8 | 18.00±2.60 | 11.33±2.16 |
| Positive control | 171.00±10.57 | 144.8±8.18 | 22.67±2.80 | 119.3±7.16 | 29.67±3.73 |
| Standard | 137.8±4.16* | 120.00±4.74* | 26.67±2.60ns | 88.00±3.23* | 22.50±2.74* |
| Formulation | 103.5±3.73* | 94.83±3.31* | 34.83±3.18* | 48.90±3.55* | 19.83±2.51* |
Table 6: Serum Lipid Profile on 28 Day.
| Week | Blood glucose levels (mM) (Mean±SD) | |||
|---|---|---|---|---|
| Group I (Normal) | Group II (Control) | Group III (Pure drug) | Group IV* (Formulation) | |
| 1 | 95.6±10.01 | 120±10 | 119.33±8.62 | 100.33±3.78 |
| 2 | 99.4±12.12 | 118.6±8.50 | 118.66±8.38 | 99.66±0.57 |
| 3 | 92.7±9.64 | 116.33±5.50 | 115.2±16.37 | 88.33±5.50 |
| 4 | 93±7.52 | 119.25±5.50 | 114±18.24 | 84.42±5.50 |
Table 7: Blood Glucose Levels for 4 Weeks.
Acknowledgements
The first author wishes to acknowledge Mr. Vipul Prakash for providing the gift sample of lovastatin, thank her research guide for being a pillar of support throughout and is grateful to the principal, staff and management of Rao`s College of Pharmacy, Nellore for providing the necessary facilities and to carry out this research work. The first author wishes to thank Mr. S. K. Madeesh, General Manager, Pharma Tran, Hyderabad for the analysis of samples.
References
- Dhumal RS, Kelly AL, York P, Coates PD, Paradkar A. Cocrystalization and Simultaneous Agglomeration Using Hot Melt Extrusion. Pharm Res 2010;(12):2725-33.
- Shan N, Zaworotko MJ. The role of cocrystals in pharmaceutical science. Drug Discovery Today 13;(9-10):440-6.
- Sohrab R. Applications of the crystallization process in the pharmaceutical industry. Front Chem Eng 2010;4(1):2-9.
- Desale PK. A novel method: Co-crystallisation. Int J Pharma Inven 2013;3:4-9.
- Almarsson O, Zaworotko MJ. Crystal engineering of the composition of pharmaceutical phases. Do pharmaceutical co-crystals represent a new path to improved medicines?. Chem Commun 2004;(17):1889-6.
- Jayasankar A, Somwangthanaroj A, Shao ZJ, Rodrıguez-Hornedo N. Co-crystal formation during cogrinding and storage is mediated by amorphous phase. Pharm Res 2006;23:2381-92.
- Schultheiss N, Newman A. Pharmaceutical Cocrystals and their physicochemical properties. Cryst Growth Des 2009;9:2950-67.
- Vishweshwar P, McMahon JA, Bis JA, Zawworotko MJ. Pharmaceutical co-crystals. J Pharm Sci 2006;95:499-516.
- Rodriguez-Hornedo N, Nehm SJ, Jayasankar A. Cocrystals:design, properties and formation mechanisms, In Encyclopedia of Pharmaceutical Technology, 3rd ed. Taylor & Francis, London, 2007. p. 615-35.
- McNamara DP, Childs SL, Giordano J, Iarriccio A, Cassidy J, Shet MS et al. Use of a Glutaric AcidCo-crystal to Improve Oral Bioavailability of a Low Solubility API. Pharm Res2006;23, 1888-97.
- Mathew D. A study of suitability of nimesulide-betacyclodextrincomplex in oral and topical dosage forms. Int J Pharm Pharm Sci. 2009;(1):193-8.
- Srikanth MV, Babu GVMM, Rao NS, Sunil SA, Balaji S, Ramanamurthy KV. Dissolution rate enhancement of poorly soluble bicalutamide using β-cyclodextrin inclusion complexation. Int J Pharm Pharm Sci 2010;(2):191-8.
- Babu JN, Nangia A. Solubility Advantage of Amorphous Drugs and Pharmaceutical Cocrystals. Cryst Growth Des2011;11(7):2662-79.
- Bakhle SS. Development and Evaluation of Liquid and Solid Self-microemulsifying Drug Delivery System of Lovastatin. Asian J Pharma Sci 2016;10(1):22.
- Sulbha RF, Milind PW, Shilpi R. Coformer selection: an important tool in cocrystal formation. Int J Pharm Pharm Sci 2014;6:9-14.
- Aravind RS, Swati SR, Nandkishor NJ. Insights of Dosage form Design: Polymorphs and Co-crystals. Asian J Biomed Pharm Sci 2013;(27):1-8.
- Divyabharathi Y, Rajesh VB. Enhancement solubility of lovastatin drug by using liqui-solid technique. World J Pharm Res 2012;17:567-87.
- Chandel N, Gupta V, Pandey A, Saxena S, Sheetal Choudhary. Co-crystalization of aceclofenac and paracetamol and their Characterization. Int J Pharm Life Sci 2011;2(8):1020-8.
- Chatwal GK, Anand SK. Instrumental methods of chemical analysis. 5th ed. Mumbai, Himalaya publishing house; 2006.
- Prakash O, Saraf S, Rahman M, Agnihotri N, Pathak VK. Formulation and Evaluation of Floating Nateglinide Tablets Using Factorial Design. RRJoPS 2013;2(4):13-9.
- Dupinder K, Seema S. Development and characterization of lovastatin loaded microspheres. Int Res J Pharm App Sci 2013; 3(5):197-205.
- Viswanath V, Somasekhar G. Stability enhancement of lovastatin by liquisolid compaction technique. J Glob Tren Pharma Sci 2014;5(3):1933-39.
- Anand DSS, Sultana SS, Sultana SS, Ramana BV, Nagarajan G. Formulation and evaluation of bilayer floating tablets of simvastatin and lovastatin. J Chem Pharma Res 2014:6(12):186-97.
- shyam J, krishna VR, Madhavi K, Krishna MV, Kumar SD. Enhancement of solubility and dissolution properties of lovastatin by liquisolid technique. Int J Res Pharma Chem 2014;4(3), 713-22.
- Dayyih WA, Mallah ED, Al-ani IH, Arafat TA. liquorice beverage effect on the pharmacokinetic parameters of atorvastatin, simvastatin, and lovastatin by liquid chromatography-mass spectroscopy/mass spectroscopy. Asian J Pharm Clin Resv 2016;9(2):174-9.
- Qureshi MJ, Mallikarjuna C, Kian WG. Enhancement of solubility and therapeutic potential of poorly soluble lovastatin by SMEDDS formulation adsorbed on directly compressed spray dried magnesium aluminometasilicate liquid loadable tablets: A study in diet induced hyperlipidemic rabbits. Asian J Pharma Sci 2015;10:40-56.
- Chadha R, Anupam S, Poonam A, Somnath C, Dharamvirsinghjain. Cocrystals of efavirenz with selected coformers: preparation and characterization. Int J Pharm Pharm Sci 2012;4(2): 244-50.
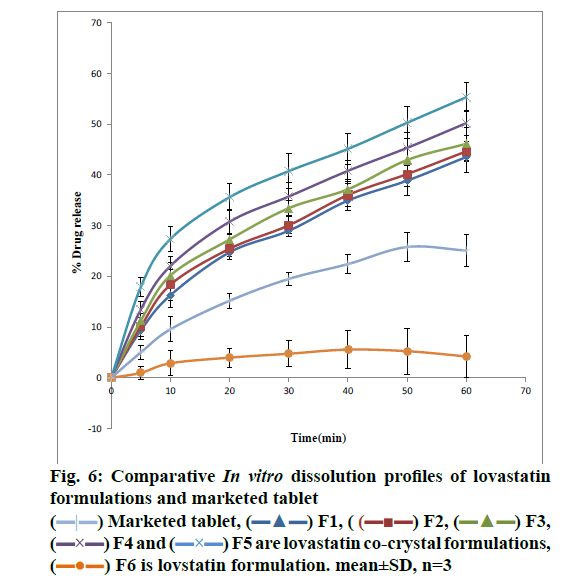
 ) Marketed tablet, (
 ) F1, (
 ) F2, (
 ) F3, (
 ) F4 and (
 ) F5 are lovastatin co-crystal formulations, (
 ) F6 is lovstatin formulation. mean±SD, n=3.
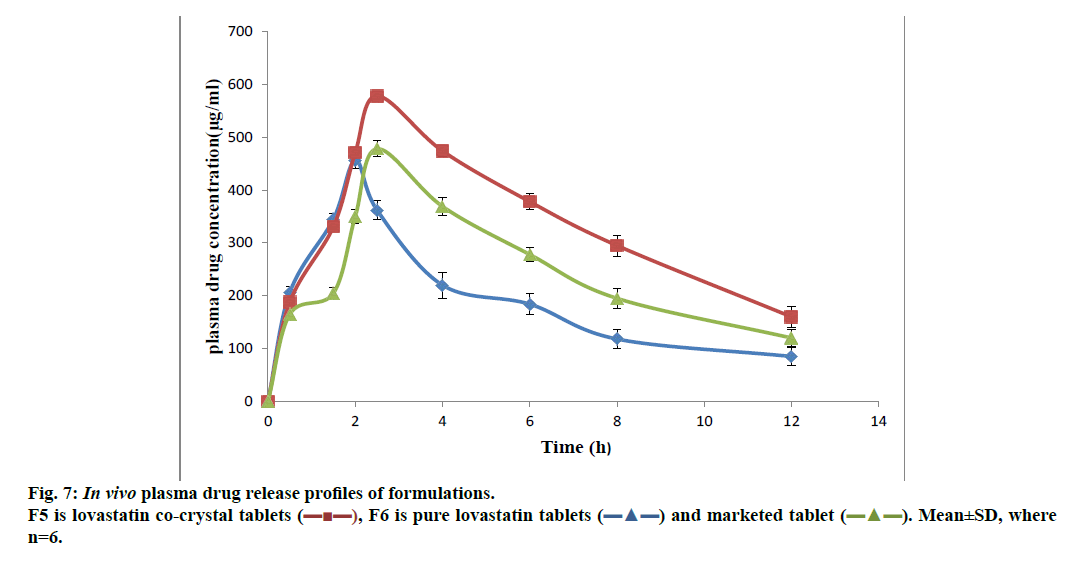
 ), F6 is pure lovastatin tablets (
 ) and marketed tablet (
 ). Mean±SD, where n=6.


