- *Corresponding Author:
- H. Zhu
State Key Laboratory of Environmental Chemistry and Ecotoxicology
Research Center for Eco-Environmental Sciences, Chinese Academy of Sciences, Beijing 100085, China
E-mail: 2070418548@qq.com
| This article was originally published in a special issue: Special issue on “Drug Development and Human Health in China” Indian J Pharm Sci 2020:82(1)spl issue2;1-6 |
This is an open access article distributed under the terms of the Creative Commons Attribution-NonCommercial-ShareAlike 3.0 License, which allows others to remix, tweak, and build upon the work non-commercially, as long as the author is credited and the new creations are licensed under the identical terms
Abstract
The aim of this study was to reveal the relationship between four kinds of quinones and the ATP level in human bladder cancer T24 cells. Quinones could cause damage to T24 cells, and after 12 h exposure, IC50 values were in μM, 74 for 2-chlorobenzoquinone, 82 for 2,5-dichloro-1,4-benzoquinone, 122 for 2,6-dichloro-1,4-benzoquinone and 45 for 2,3,6-trichloro-1,4-benzoquinone. Further, the mechanism of increased ATP level when exposed to the 4 quinones was studied. It could be due to increased reactive oxygen species level in T24 cells when exposed to the these quinones, which suppressed the ATPase activity, leading to increased levels of ATP, which was dose-dependent. The higher the quinone concentration was, the higher the reactive oxygen species level and the ATPase activity was lower, leading to accumulation of more ATP in T24 cells. This study indicated that these 4 quinones could block energy metabolism in T24 cells which could lead to cell death.
Keywords
Quinones, ATP, T24
Quinones are widely found in natural products, antitumor drugs, biochemical metabolites and environmental pollutants. Recently, these have been found in drinking water and other foods[1-5]. It has been reported that some quinones can produce large amounts of unknown disinfection by products, which were poorly evaluated for toxicity[6-8]. There have been reports that certain kinds of quinones can cause damage to cells, such as the ectogenic quinones derived from the metabolism of the body, which could induce a series of toxic effects, including acute cytotoxicity[9-12], immunotoxicity and carcinogenicity[13-16]. It is reported that quinones are highly reactive oxidation products, which can produce reactive oxygen species (ROS), and in turn, cause damage to cells and bodies. As generally known, ATP is the main sources of energy supplement in cells[17-20], which is an important substance to support life and either absence of or excess ATP level in cells cause damage. There have been reports that ATP level can be affected by many processes. In the present investigation it was observed that the 4 quinones tested enhanced ATP levels in T24 cells. The reason could be that these quinones can decrease ATPase activity in T24 cells dose-dependently. This observation indicated that these 4 quinones could block energy production, which could provide a way to kill T24 cells.
Materials and Methods
Standards of the ATP, disodium hydrogen phosphate (Na2HPO4·12H2O), 2-chlorobenzoquinone (CBQ), 2,5-dichloro-1,4-benzoquinone (2,5-DCBQ), 2,6-dichloro-1,4-benzoquinone (2,6-DCBQ) and ATPase activity assay kit were procured from Sigma- Aldrich, USA. Methanol from Thermo Fisher Scientific, USA and acetic acid from Sinopharm Chemical Reagent Beijing Co., Ltd. China. DMEM-high glucose culture medium was procured from Lonza, Walkersville, MD USA, 2,3,6-trichloro-1,4-benzoquinone (TCBQ, Acros Organic, USA), ROS assay kit (Beyotime Biotechnology, China), DNA damage competitive Elisa kit (Invitrogen, USA), OxiSelect MDA adduct kit (Cell Biolabs, USA), CellTiter 96® aqueous one solution cell proliferation assay kit (Promega, USA), pyruvate kinase assay kit (Abcam, England), mitochondrial membrane potential (MMP) assay kit (Beyotime Biotechnology, China), were used in present study. Shimadzu HPLC system (LC-20A, Japan), Microplate reader (Varioskan Flash, Thermo Scientific, USA), microplate spectrometer (ACEA NovoCyte, China), Confocal laser scanning microscope (TCS SP5, Leica, Germany) were also used.
Cell and sample preparation:
T24 cells were cultured in DMEM-high glucose medium with 100 μg/μl streptomycin, 10 % FBS, 100 U/ml penicillin, 5 % CO2 at 37°. The cell number was calculated using a haemocytometer and washed twice by pre-cooled phosphate buffer saline (PBS). Lysis was done by 100 μl 80 % pre-cooled methanol (v/v) ,then centrifuged at 12 000 rpm (4°) for 10 min. The supernatant was placed in an ultrafiltration device and centrifuged for 30 min at 13 500 rpm (at 4°), finally, 80 μl mobile phase A (50 mM Na2HPO4, 15 mM trimethylamine (TEA), pH 7.88 using acetic acid) was added to the 80 μl filtered solution.
Determination of ATP Level:
ATP level was quantified using HPLC. Angela Venusil MP C18 column (250×4.6 mm i.d., particle size 5 μm) was used. Mobile phase A was 50 mM disodium hydrogen phosphate and 15 mM TEA, pH was adjusted to 7.88 with acetic acid, mobile phase B was 100 % methanol. Isocratic elution, 4 % methanol and flow rate of 0.8 ml/min were used. The injection volume was 20 μl. The peaks of various ingredients were recorded at 254 nm.
Cell viability:
Cell viability was calculated using MTS assay. Cell viability data was based on the manufacturer’s instructions with little modification. T24 cells were cultured at 96-well plates (15 000 cells/well). After incubated for 24 h, the culture media in samples, blank and negative controls was replaced by the media, which various concentrations of HBQs (0, 10, 20, 50, 100, 150, 200, 300 μM) was contained. Each concentration was sextupled. After exposed for 12 h, each well was pipet 20 μl CellTiter 96® aqueous one solution, and incubated for 1 h in an incubator which contained 5 % CO2. The result was recorded by a microplate spectrometer at 490 nm. Based on the cell viability curves, IC50 values of the 4 hydroxybenzoquinones (HBQs) were determined. IC50 value was the concentration of HBQs required to reduce T24 cells to 50 %.
ROS level in T24 cells:
ROS level was quantified by ROS assay kit with some modifications. Ten-cm plates were used, the density was 107 cells/well and cultured for 24 h before the following tests. Briefly, 7ʹ-dichlorofluorescin diacetate (DCFH-DA) was diluted 1000 folds in the culture medium, which is free of serum medium, and the final concentration was 10 μM, the culture medium was removed and added 2.5 ml the above diluted DCFHDA to each plates, incubated at 37° for 25 min, washed 3 times with serum-free culture medium and finally suspended in 1 ml PBS. ROS was determined in a flowcytometer.
Detection of 8-hydroxy-2’-deoxyguanosine (8-OHdG):
8-OHdG level in T24 cells was determined by DNA damage competitive ELISA kit with some modifications. Twenty five microlitres of 8-OHdG standard was added to a tube which contained 475 μl assay buffer. Then, added appropriate assay buffer to 8 tubes. The concentrations were 4000, 2000, 1000, 500, 250, 125, 62.6 and 0 pg/ml standard solution of 8-OHdG. Added 50 μl of standards or samples to appropriate wells. Then, assay buffer (75 μl) was added to each well, next, 25 μl of 8-OHdG conjugate and 25 μl 8-OHdG antibody, the plates were mixed well and incubated for 2 h at room temperature. Then, 100 μl TMB substrate was added and incubated for another 30 min, and last, added 50 μl stop solution, mixed well and read the absorbance at 450 nm.
Detection of MDA Adducts:
All reagents were mixed thoroughly before using. Each MDA sample was assayed two times. Added 50 μl of samples or MDA-BSA standards to the MDA conjugate coated plate, then added 50 μl of the diluted antiMDA antibody. Finally, incubated in ambient temperature for 1 h. Washed each well by 250 μl of wash buffer for 3 times. Incubated for another 1 h after100 μl diluted antibody-HRP conjugate was added. Washed the wells for 3 times by the wash buffer, and next add 100 μl of substrate solution, then, added 100 μl of stop solution. Finally, the absorbance of each well was read at 450 nm by a microplate reader.
Determination of MMP:
MMP was quantified by the MMP assay kit with some modifications. The cells were cultured in 4-well plates, the culture medium was removed after being exposed to quinones for 12 h, and washed with the PBS buffer. Then, 200 μl staining solution was added to each well and cultured in a cell incubator for 20 min. Next, washed the cells by 200 μl fresh and pre-warmed JC-1 buffer for 2 times, finally, 200 μl culture medium was added to the wells. Spectral characteristics were determined by Leica TCS SP5 system. The excitation wavelength was 490 nm, and the emission wavelength was 530 nm.
Detection of pyruvate kinase activity:
Cells were extracted with 4 volumes of assay buffer, centrifuged at 12 000 rpm for 5 min to get clear extract. Added 10 μl samples directly into a 96-well plate, made up to 50 μl per well with PK assay buffer, diluted the pyruvate standard to generate 0, 2, 4, 6, 8 and 10 nmol per well, 50 μl reaction mix was added to each well and measured the OD570 nm at T1 to get A1, A2 was read after incubating for 15 min (T2). Plot the pyruvate standard curve, B nmol of pyruvate generated between T1 and T2 by the standard curve. PK activity = (B×sample dilution factor)/((T2–T1)×V) = nmol/min/ml.
Detection of ATP synthase activity:
Fifty microliters of diluted sample was added into a 96-well pre-coated microplate, incubated for 3 h at ambient temperature. The enzyme was immobilized in the wells with the monoclonal antibody. Then, the well contents were emptied and 300 μl of solution 1 was added to each well. Emptied the wells again, then, 300 μl solution 1 was added to each well. Emptied the wells again and 40 μl of lipid mix was added and incubated at room temperature for 45 min. Finally, 200 μl reagent mix was added. Any bubbles in the wells should be popped and the absorbance of each well was measured at 340 nm.
Detection of ATPase activity:
Added 0, 10, 20, 25, 30, and 40 μl of the 50 μM standard solution to 96-well plate, generating 0, 12.5, 25, 31.25, 37.5 and 50 μM standards solution, then, ultrapure water was added to each well to bring the volume to 40 μl. T24 cells were homogenized on ice with 200 μl pre-cooled assay buffer. Centrifuged for 5 min (14 000 rpm), 10 μl of the above supernatants was added to 96-well plate. Negative control was10 μl of assay buffer, then 30 μl reaction mix was added, incubated for 30 min, 200 μl stop solution was added, incubated for another 30 min. OD620 nm was read by microplate reader. ATPase enzyme activity = (concentration of phosphate (μM)×reaction volume (μl))/(sample volume (μl)×reaction time (min)) = μmol/min/l.
Results and Discussions
ATP was the main energy source in cells, it maintained the cells function well, and involved in almost all the cellular processes. So, ATP level could serve as an indicator of cytotoxicity of various biological compounds on cells. In this study, ATP level was quantified by the developed method previously and the results in figure 1 showed that the 4 quinones had dosedependent positive effects on ATP level in T24 cells. The hypothesis proposed was that ATP decomposed or generated pathway might be influenced by the 4 quinones. The detailed explanation was as follows.
T24 cells at various concentrations for 12 h were determined by developed HPLC method. The green colored column represented cells treated with 2-CBQ (left to right). The blue colored column represents cells treated with 2,5-DCBQ (left to right). The purple colored column represented T24 cells treated with 2,6-DCBQ (left to right). The red colored column represented T24 cells treated with various concentrations of TCBQ (left to right).
MTS was used to determine the T24 cell viability. Data in figure 2 showed cell viability after incubated with varying concentrations of 2-CBQ, 2,5-DCBQ, TCBQ and 2,6-DCBQ. A significantly reduced viability could be observed when treated with the 4 HBQs.
The IC50 values were 74 μM for 2-CBQ, 82 μM for 2,5-DCBQ, 122 μM for 2,6-DCBQ, and 45 μM for TCBQ. Differential cytotoxicity of the 4 HBQs on T24 cells could be observed; TCBQ had the lowest IC50, which indicated that the TCBQ had the highest cytotoxic effect. To ensure the cell viability was higher than 50 %, 10, 20 and 40 μM was chosen for the following tests.
The overall ROS level in T24 cells was determined when induced by the four HBQs. After exposed to various concentrations of the 4 HBQs (0-40 μM) for 12 h, the ROS level was measured using a ROS kit. The statistics in figure 3A indicated that the 4 quinones exerted dose-dependent positive effect on the intracellular ROS production. As known, ROS impacts many signal transduction pathways including respiratory chain, which was the main pathway that consume the intracellular ATP. The increased ROS level might be related to the increased ATP level.
8-OHdG was an important indicator of oxidative damage, which led to DNA damage. figure 3B showed that 8-OHdG level increased in T24 cells treated with different quinones. It was not dose-dependent. Therefore, the results indicated that the generated 8-OHdG was compound-dependent.
Lipid peroxidation could indicate oxidative stress in cells. The increase of MDA level might lead to cytotoxicity or cell death. The results in figure 3C indicated that MDA protein adducts in cells changed little when treated with quinones. These results in this study suggested that lipids were not the target of HBQ.
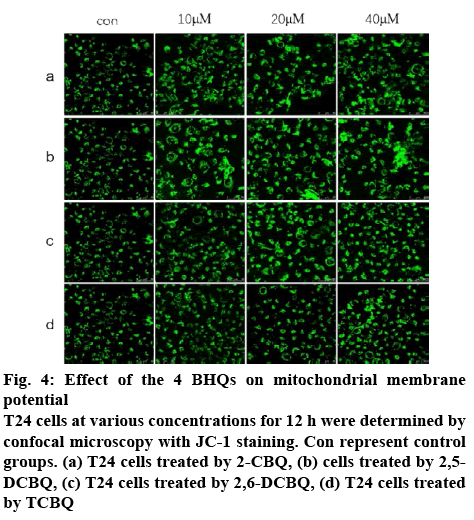
In mammalian cells, mitochondria are the major sources of intracellular ATP. This study explored whether the observed increased intracellular ATP level correlated to the MMP. It was estimated that the MMP of quinoneexposed T24 cells by staining cells with JC-1. T24 cells were exposed to 10, 20 and 40 μM quinones for 12 h and incubated with JC-1 for 20 min. The MMP was estimated by confocal microscopy, as the fluorescence intensity of JC-1 correlates with the intracellular MMP level. As shown in figure 4, cells showed no significant change between the exposed and the control groups in fluorescence intensity, which suggested that the four HBQs had no effect on intracellular MMP, and caused no damage to the mitochondrial.
Figure 4: Effect of the 4 BHQs on mitochondrial membrane potential
T24 cells at various concentrations for 12 h were determined by confocal microscopy with JC-1 staining. Con represent control groups. (a) T24 cells treated by 2-CBQ, (b) cells treated by 2,5- DCBQ, (c) T24 cells treated by 2,6-DCBQ, (d) T24 cells treated by TCBQ
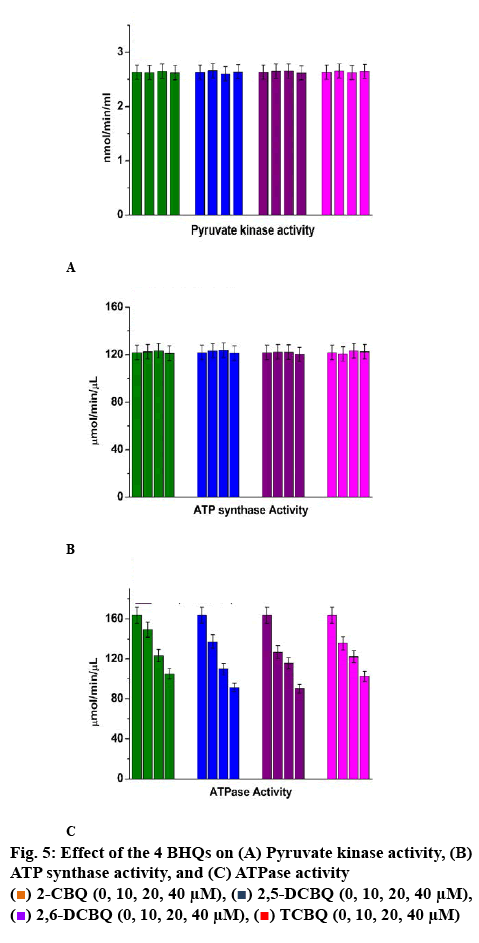
Pyruvate kinase was an intracellular glycolysis process enzyme. It could cause great change in cells, so it was an important pathway to generate ATP in cells. This study quantified the pyruvate kinase activity in T24 cells by pyruvate kinase kit. Data in figure 5A indicated that the pyruvate kinase activity kept constant with increasing HBQ concentration. It suggested that the four HBQs had no effect on the PK activity, and the observed increasing of ATP was not caused by the changes of PK activity.
The ATP synthase complex, which was also called complex V or F1F0-ATPase, was responsible for ATP production in the oxidative phosphorylation process. It was the key enzyme for the production of ATP in cells, so, ATP synthase activity level was measured before and after exposure to the 4 quinones using the ATP synthase activity kit. The data in figure 5B indicated that ATP synthase activity had no significant change between the control and the quinone-treated groups, and it meant that there was no relationship between the increased ATP level and the activity of ATP synthase in T24 cells.
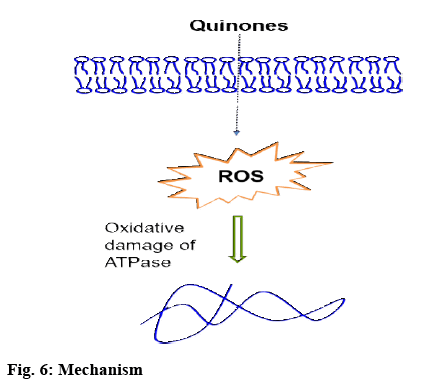
ATPases catalyse the decomposition of ATP into ADP and free phosphate. Thus, intracellular ATPase activity played key role in maintaining ATP level in cells. ATPase activity was measured using ATPase activity assay kit. The results in figure 5C indicated that the ATPase activity dose-dependently decreased when exposed to the four HBQs, thus allowing to speculate that the observed increased ATP level in T24 cells might be a result of decreased ATPase activity.
The above results indicated that the ROS level caused by the four quinones might be the main reason responsible for the increased ATP level when exposed to quinones. The mechanism scheme was presented in the graphic abstract.
It was reported that the effects of four quinones on ATP level in T24 cells and the key effector of it. Dosedependent increase in ATP levels could be observed in the T24 cells exposed to quinones for 12 h. The reason for this phenomenon was investigated (figure 6). It was observed that increased ATP level might be caused by the following reasons, the ROS level in T24 cells increased after exposure to the HBQs, the high level of ROS might have reduced ATPase activity, and as a result, the ATP levels were elevated. The higher the HBQ concentration was, the higher the ROS levels, resulting in lowered ATPase activity and reduced decomposition and accumulation of ATP in T24 cells. This study indicated that the energy generating pathway might be blocked by the 4 quinones, resulting in cell death.
References
- Pillar EA, Guzman MI. Oxidation of Substituted Catechols at the Air-Water Interface: Production of Carboxylic Acids, Quinones, and Polyphenols. Environ Sci Technol 2017;51(9):4951-9.
- Yang P, Zeng Q, Cao WC. Interactions between CYP2E1, GSTZ1 and GSTT1 polymorphisms and exposure to drinking water trihalomethanes and their association with semen quality. Environ Res 2016;147:445-52.
- Richardson SD, Plewa MJ, Wagner ED, Schoeny R, Demarini DM. Occurrence, genotoxicity, and carcinogenicity of regulated and emerging disinfection by-products in drinking water: A review and roadmap for research. Mutat Res 2007;636(3):178-242.
- Alegria AE, Ferrer A, Sepulveda E. Photochemistry of water-soluble quinones. Production of a water-derived spin adduct. Photochem Photobiol 1997;66(4):436-42.
- Murzakaev VG, Latypova ZV. Experimental study of the hazards and safety levels in water of chlorinated quinones. Gig Sanit 1972;37(5):15-19.
- Cantor KP, Villanueva CM, Silverman DT. Polymorphisms in GSTT1, GSTZ1, and CYP2E1, disinfection by-products, and risk of bladder cancer in Spain. Environ Health Perspect 2010;118(11):1545-50.
- Hua G, Reckhow DA. Comparison of disinfection byproduct formation from chlorine and alternative disinfectants. Water Res 2007;41(8):1667-78.
- Krasner SW, Weinberg HS, Richardson SD. Occurrence of a new generation of disinfection byproducts. Environ Sci Technol 2006;40(23):7175-85.
- Kuete V, Omosa LK, Tala VRS. Cytotoxicity of Plumbagin, Rapanone and 12 other naturally occurring Quinones from Kenyan Flora towards human carcinoma cells. BMC Pharmacol Toxicol 2016;17(1):60-9.
- Abiko Y, Puga A, Kumagai Y. Covalent binding of quinones activates the Ah receptor in Hepa1c1c7 cells. J Toxicol Sci 2015;40(6):873-86.
- Nishiyama T, Hatae N, Yoshimura T. Concise synthesis of carbazole-1,4-quinones and evaluation of their antiproliferative activity against HCT-116 and HL-60 cells. Eur J of Med Chem 2016;121:561-77.
- Shang Y, Zhang L, Jiang Y. Airborne quinones induce cytotoxicity and DNA damage in human lung epithelial A549 cells: the role of reactive oxygen species. Chemosphere 2014;100(3):42-9.
- Verrax J, Beck R, Dejeans N. Redox-active quinones and ascorbate: an innovative cancer therapy that exploits the vulnerability of cancer cells to oxidative stress. Anticancer Agents Med Chem 2011;11(2):213-21.
- Sheng K, Lu J. Typical airborne quinones modulate oxidative stress and cytokine expression in lung epithelial A549 cells. J Environ Sci Health A Tox Hazard Subst Environ Eng 2016;52(2):127-34.
- Ja DLM, Lawson JC, Chiwakata MT. Quinones and halogenated monoterpenes of algal origin show anti-proliferative effects against breast cancer cells in vitro. Invest New Drugs 2012;30(6):2187-200.
- Slamenová D, Masterová I, Lábaj J. Cytotoxic and DNA-damaging effects of diterpenoid quinones from the roots of Salvia officinalis L. on colonic and hepatic human cells cultured in vitro. Basic Clin Pharmacol Toxicol 2004;94(6):282-90.
- Aho J, Helenius M, Vattulainen-Collanus S. Extracellular ATP protects endothelial cells against DNA damage. Purinergic Signal 2016;12(3):575-81.
- Dartier J, Lemaitre E, Chourpa I. ATP-dependent activity and mitochondrial localization of drug efflux pumps in doxorubicin-resistant breast cancer cells. Biochim Biophys Acta Gen Subj 2017;1861(5):1075-84.
- Li X, Fang P, Yang WY. Mitochondrial ROS, uncoupled from ATP synthesis, determine endothelial. Can J Physiol Pharmacol 2016;95(3):1-6.
- Maldonado EN, Dehart DN, Patnaik J. ATP/ADP Turnover and Import of Glycolytic ATP into Mitochondria in Cancer Cells is Independent of the Adenine Nucleotide Translocator. J Biol Chem 2016;291(37):19642-50.
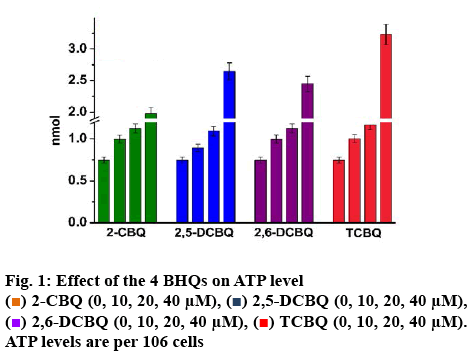
 2-CBQ (0, 10, 20, 40 μM),
  2,5-DCBQ (0, 10, 20, 40 μM),
  2,6-DCBQ (0, 10, 20, 40 μM),
  TCBQ (0, 10, 20, 40 μM).
ATP levels are per 106 cells
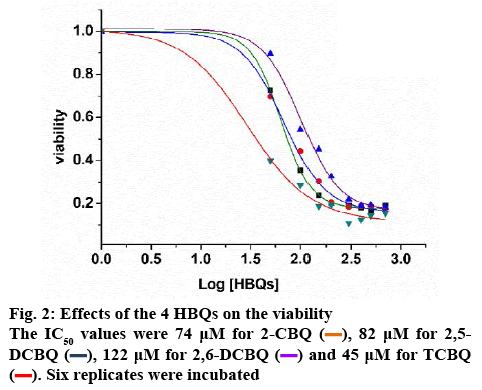
 , 82 μM for 2,5-DCBQ
  , 122 μM for 2,6-DCBQ
  and 45 μM for TCBQ
  . Six replicates were incubated
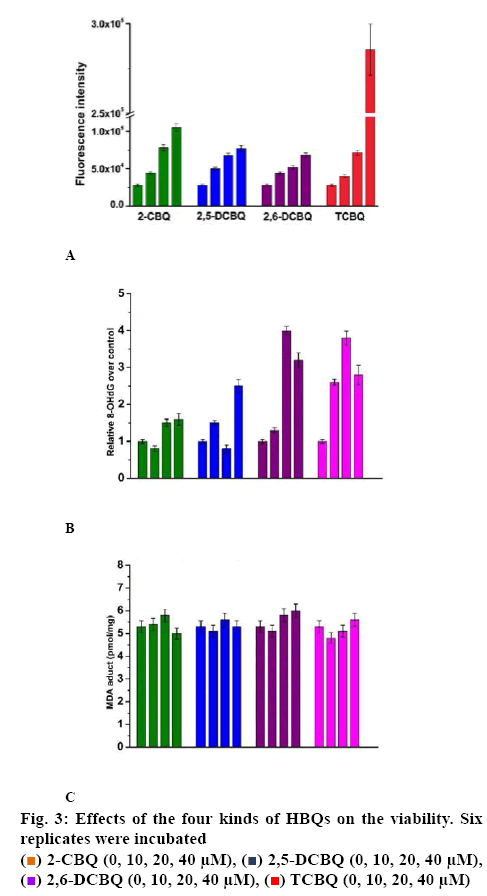
 2-CBQ (0, 10, 20, 40 μM),
  2,5-DCBQ (0, 10, 20, 40 μM),
  2,6-DCBQ (0, 10, 20, 40 μM),
  TCBQ (0, 10, 20, 40 μM)
 2-CBQ (0, 10, 20, 40 μM),
  2,5-DCBQ (0, 10, 20, 40 μM),
  2,6-DCBQ (0, 10, 20, 40 μM),
  TCBQ (0, 10, 20, 40 μM)