- *Corresponding Author:
- A. Ercan
Department of Biochemistry, Faculty of Pharmacy, Hacettepe University, 06100 Ankara, Turkey
E-mail: aysercan@hacettepe.edu.tr
| Date of Submission | 27 October 2016 |
| Date of Revision | 27 January 2017 |
| Date of Acceptance | 27 May 2017 |
| Indian J Pharm Sci 2017;79(4):599-607 |
This is an open access article distributed under the terms of the Creative Commons Attribution-NonCommercial-ShareAlike 3.0 License, which allows others to remix, tweak, and build upon the work non-commercially, as long as the author is credited and the new creations are licensed under the identical terms
Abstract
Breast cancer is one of the most common cancer types and malfunctioning proteins in apoptotic pathways are known to be the main contributors of cancer development. In this study MCF-7 and MDA-MB-231 breast cancer cell lines were treated with a potent chemotherapeutic agent, Doxorubicin. IC50 values were calculated to be 8306 and 6602 nM, respectively. Percentage of the cells in cell cycle arrest increased in a dose-dependent manner and was more evident in MDA-MB-231 cells. Apoptotic cell number increased in MCF-7 and Bax/Bcl-2 ratio was measured to be ~ 7 fold higher in cells treated with 200 nM of doxorubicin when compared to the control. Likewise, apoptotic cell rate increased in MDA-MB-231 cells and Bax/Bcl-2 ratio was increased by 2 fold compared to the control. Doxorubicin was also found to suppress Mdr-1 in a concentration-dependent manner and the outcome was more evident in MCF-7 cells. Drug efflux assay results were also shown to be consistent with Mdr-1 gene expression levels in both cell lines. Consequently it was concluded that doxorubicin directly influences apoptotic pathway and multidrug resistance in both MCF-7 and MDA-MB-231 cells even though data all together suggest that the effect is more significant on MDA-MB-231.
Keywords
Breast cancer, doxorubicin, apoptosis, multidrug resistance, Mdr-1
Breast cancer is the second most common cancer type amongst women living in developed countries and the most common cause of death in women within the age 35 to 55 [1]. Developing countries demonstrate less breast cancer reports in spite of high mortality rates and breast cancer is by far the leading cause of death amidst women, which covers 14.3% of all deaths [2,3].
Apoptosis is programmed cell death characterized by the activation of catabolic enzymes, which is responsible for degradation of cellular components, shrinkage of the cell, condensation of chromatin and fragmentation of DNA [4,5]. It has been proved that multiple types of cancer including breast cancer are developed due to malfunctioning of the genes, which code antiapoptotic proteins, apoptosis inhibitors or tumor suppressors [6,7].
Since p53 was identified as a tumor suppressor protein in late 1980’s, various studies have focused on its contributions on cell cycle arrest, senescence, apoptosis and autophagy [8,9]. p53 has been proven to be either mutated or deleted in approximately 50% of all cancer cases [10]. Therefore, expression levels of p53 and other genes in p53 pathway have major role on cancer development [11].
Multidrug resistance (MDR) is a term used to define resistance of the cells against multiple drugs, which may or may not be similar in structural or functional basis and is one of the main reasons why attempts of using anticancer agents in cancer therapy fails [12-14]. Permeability glycoprotein (P-gp) is expressed by Mdr-1 (ABCB1) gene and it is the best portrayed pump that mediates MDR [15]. Doxorubicin (DOX) is a potent and clinically approved anticancer drug, which targets DNA and topoisomerase II. Thus DOX inhibits replication and transcription causing cell cycle arrest and apoptosis afterwards [16].
In the present study, MCF-7 and MDA-MB-231 breast cancer cell lines were treated with numerous doses of DOX for pre-determined time. Cell viability percentages, cell cycle phases, which cells were on, apoptotic cell rates, drug efflux levels via P-gp, expression levels of Mdr-1 as well as certain genes in p53 apoptotic pathway were measured. Consequently, the effect of DOX in different aspects on two different breast cancer cell lines was aimed to be examined and compared.
Materials and Methods
Cell lines and culture conditions
MCF-7 and MDA-MB-231 cell lines were purchased from ATCC (USA). The cells were cultured in Dulbecco’s Modified Eagle Medium (DMEM, Gibco, UK) supplemented with 10% heat-inactivated fetal bovine serum, 1% L-glutamine and 1% penicilin/ streptomycin all procured from Gibco, UK. Cells were incubated in 5% CO2 incubator (Sanyo MCO-18 CO2 Incubator, Japan) at 37° for proliferation.
Cell viability assay
In order to determine viability levels of MCF-7 and MDA-MB-231 cells upon treatment with DOX, sulphorhodamine B (SRB) assay was performed with the protocol adapted from a previous study [17]. Briefly MCF-7 and MDA-MB-231 cells were seeded onto 96-well plates (10 000 cell/well). When reached ~80% confluency, cells were treated with increasing doses (50, 100, 200, 400, 800, 1000, 1500, 2000, 3000, 4000 and 8000 nM) of DOX (Sigma, Germany) for 48 h before the assay was performed. Cells not treated with the drug considered as control. Absorbance values obtained at 510 nm wavelength were measured using PowerWave XS Microplate Spectrophotometer (Biotek, USA). The experiment was carried out to be n=6 and the percentage of absorbance values compared to control were assessed to determine the changes in viability.
Determination of cell cycle phase
Cell cycle phases, which the cells were on following DOX treatment, were assessed by using Tali® Cell Cycle Kit (Invitrogen, USA) according to manufacturer’s orders. Cells were planted onto 6-well plates (1 00 000 cell/well). When reached 80% or higher confluency, cells were treated with 50 200 or 800 nM of DOX or not treated with the drug at all to be the control group (n=3). After 48 h of incubation, cells were trypsinised and centrifuged at 500×g for 5 min at room temperature. Following the washing steps with phosphate-buffered saline (PBS) and 70% ethanol, cells were incubated at –20° for 16 h. Cells were centrifuged at 1000×g for 5 min at 4° and resuspended either in PBS for control or in Tali® cell cycle solution for samples. Subsequent to 30 min of incubation at room temperature, samples were loaded to Tali® Cellular Analysis Slides (Invitrogen, USA) and results were obtained by using Tali® Image- Based Cytometer (Thermo Fischer Scientific, USA). Graphics regarding cell cycle phase determination assay were acquired via ModFit LT 4.1 software.
Exploration of apoptosis
To examine whether DOX induces apoptosis in MCF-7 and MDA-MB-231, Tali® Apoptosis Kit (Invitrogen, USA) was employed following manufacturer’s orders. Cells were seeded onto 6-well plates (1 00 000 cell/well). When confluent, cells were treated with 50, 200 or 800 nM of DOX (n=4). Cells not treated with the drug considered as control. After 48 h of incubation, cells were trypsinised and centrifuged at 250×g for 10 min at 25°. Cells were rinsed with PBS prior to adding 1X Annexin binding buffer (ABB) and Annexin V Alexa Fluor 488 onto samples. Subsequent to 20 min of incubation at room temperature in the dark, cells were centrifuged once more and ABB and Tali® propidium iodide was applied. Cells were incubated in the dark at room temperature for additional 5 min and loaded to Tali® cellular analysis slides. Results were attained by using Tali® Image-Based Cytometer.
Detection of drug efflux level from cells
With the aim of elucidating the impact of DOX on MDR, Vybrant® MDR Assay Kit (Thermo Fischer Scientific, USA) was used following the protocol adapted from Susa, et al. [18]. Verapamil was employed as P-gp inhibitor and calcein retention was investigated as an indicator of MDR level. Briefly, cells were seeded onto 96-well plates (1 00 000 cell/well). When reached ~80% or higher confluency, cells were treated with 50 200 and 800 nM of the drug separately. Cells not treated with the drug were considered as control group. After 48 h of incubation, cells were treated with 15 μM of verapamil for 1 h. Later, calcein AM was added to each well at 0.25 μM final concentration and incubated for 30 min at 37°. After cells were washed with cold DMEM twice, 200 μl DMEM was added onto cells and fluorescence was measured excitation at 485 nm and emission at 528 nm.
Measurement of gene expression levels
Total RNA extraction from MCF-7 and MDA-MB-231 cells following the treatment of 50, 200, 400 and 800 nM of DOX was succeeded by using Purelink™ RNA Mini Kit (Invitrogen, USA) according to the manufacturer's instructions. RNA samples were converted to cDNA with the aid of Protoscript® First Strand cDNA Synthesis Kit (NEB, USA) by following manufacturer's official protocol. Real-time polymerase chain reaction (RT-PCR) was performed by employing Applied Biosystems Power SYBR® Green Master Mix (Applied Biosystems, USA). Forward and reverse primers of apoptotic pathway genes p53, Mdm2, Bcl-2, Bax and MDR gene Mdr-1 were designed via National Center for Biotechnology Information (NCBI) database to be p53F (5’-CACCATGAGCGCTGCTCAGATAGC-3’), p53R (5’-ACAGGCACAAACACGCACCTCAAA-3’), Mdm2F (5’-AGGTCACTCCGATGAAAGGT-3’), Mdm2R (5’-GTTGTCTAGTACCATTAACC-3’), BaxF (5’-TTTCATCCAGGATCGAGCAG-3’), BaxR (5’-AAAGTAGAAAAGGGCGACAA-3’), Bcl-2F (5’-GTGTGTGGAGAGCGTCAACCGG-3’), Bcl-2R (5’-TCAACAGAGGCCGCATGCTGG-3’), Mdr-1F (5’-TTCAACTATCCCACCCGACCGGAC-3’), Mdr- 1R (5’-ATGCTGCAGTCAAACAGGATGGGC-3’), GapdhF (5’-GTCGTATTGGGCGCCTGGTCAC-3’) and GapdhR (5’- GCCAGCATCGCCCCACTTGATT-3’). Results were obtained utilizing ViiA™ 7 RT-PCR System (Applied Biosystems, USA). The relative levels of gene expression were represented as ΔCt=Ct gene–Ct reference, and the fold alterations of gene expression levels were calculated using ΔΔCt method.
Statistical analysis
GraphPad Prism 5.03 software was used for all statistical analyses. Student’s t-test was used to compare all data to their related control and two-way ANOVA was used to show the significance in between the groups. All P values were based on the two-sided statistical analysis and P˂0.05 was considered to be statistically significant. All experiments were carried out to be at least triplicate.
Results and Discussion
To verify the negative effect of DOX on cell survival, MCF-7 and MDA-MB-231 cells were treated with previously mentioned concentrations of DOX for 48 h and cell viability was measured by SRB assay (Table 1). Compared to untreated control cells, viability levels of both of the cell lines were reduced along with the dose and IC50 values were calculated to be 8306 for MCF-7 and 6602 for MDA-MB-231 (Figure 1).
| MCF-7 | MDA-MB-231 | |||
|---|---|---|---|---|
| DOX (nM) | Average cell viability (%) | Standard deviation | Average cell viability (%) | Standard deviation |
| 50 | 106.22 | ±4.44 | 111.64 | ±14.59 |
| 100 | 96.96 | ±4.44 | 95.25 | ±3.14 |
| 200 | 89.17 | ±8.27 | 92.68 | ±5.80 |
| 400 | 87.43 | ±6.12 | 89.02 | ±6.32 |
| 800 | 78.06 | ±2.09 | 75.94 | ±4.85 |
| 1000 | 77.50 | ±6.87 | 84.04 | ±9.74 |
| 1500 | 78.95 | ±3.37 | 82.32 | ±8.71 |
| 2000 | 76.42 | ±4.07 | 76.94 | ±4.37 |
| 3000 | 71.67 | ±6.29 | 74.597 | ±4.64 |
| 4000 | 74.94 | ±4.26 | 68.90 | ±4.01 |
| 8000 | 62.39 | ±2.32 | 41.11 | ±4.73 |
Table 1: Viability of both cell lines were decreased when exposed to augmenting doses of DOX
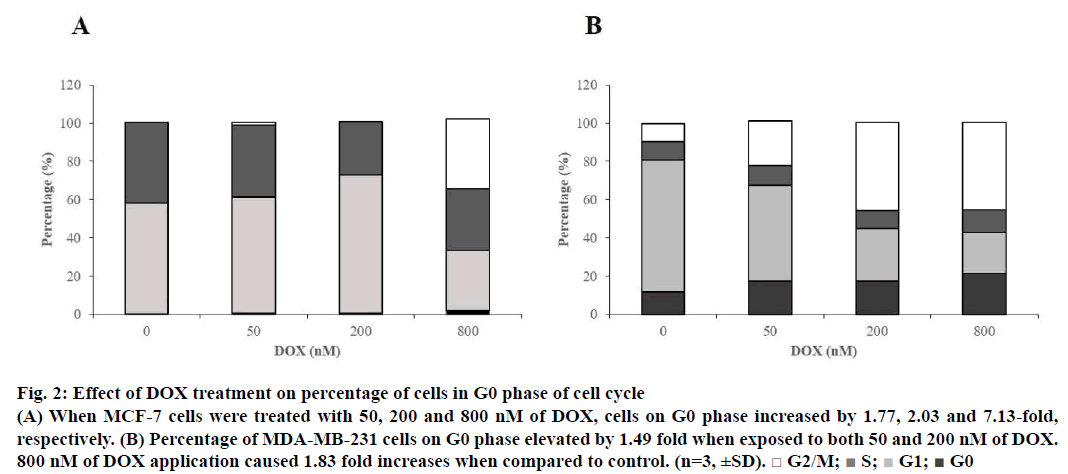
With the aim of detecting dominant cell cycle phase on both cell lines, Tali® Cell Cycle assay was employed. According to the data, when MCF-7 cells were treated with 50, 200 and 800 nM of DOX, cells in cell cycle arrest (G0) phase increased by 1.77, 2.03 and 7.13 fold, respectively (Figure 2A). Cell number percentage in G0 phase elevated by 1.49, 1.49 and 1.83 fold, respectively, when MDA-MB-231 cells were treated with 50, 200 and 800 nM of the drug when compared to control (Figure 2B). Cycle arrest for both of the cell lines were proven to be dominantly at G2/M to be 36.32% for MCF-7 and 45.67% for MDA-MB-231 when cells were subjected to 800 nM of DOX.
Figure 2: Effect of DOX treatment on percentage of cells in G0 phase of cell cycle
(A) When MCF-7 cells were treated with 50, 200 and 800 nM of DOX, cells on G0 phase increased by 1.77, 2.03 and 7.13-fold,
respectively. (B) Percentage of MDA-MB-231 cells on G0 phase elevated by 1.49 fold when exposed to both 50 and 200 nM of DOX.
800 nM of DOX application caused 1.83 fold increases when compared to control. (n=3, ±SD). □ G2/M;  S;
S;  G1;
G1;  G0
G0
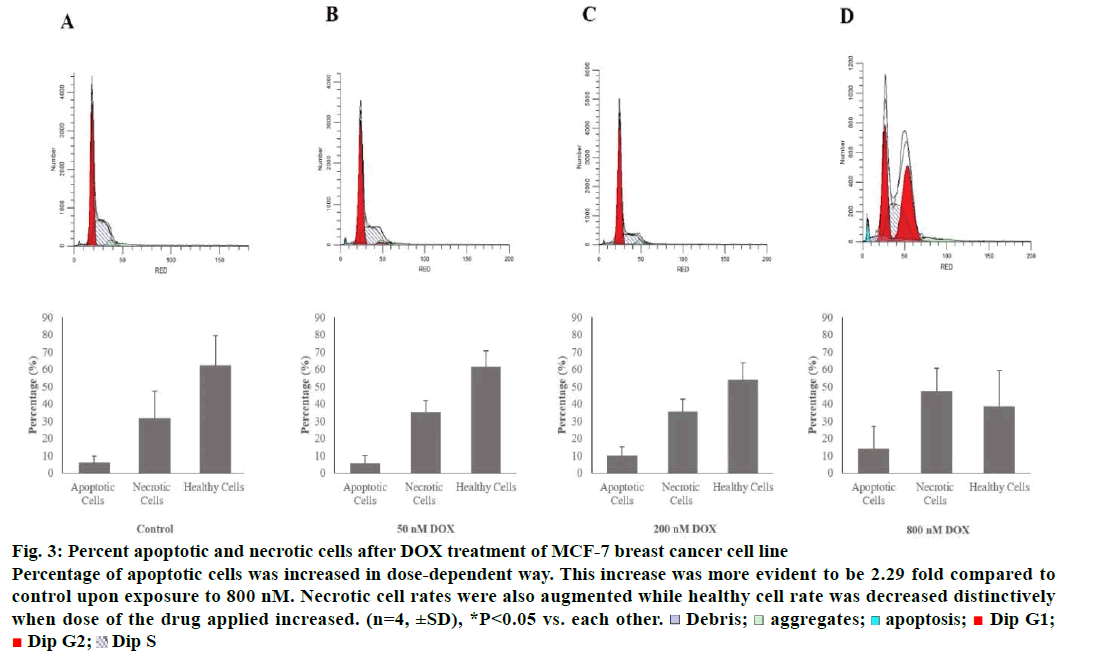
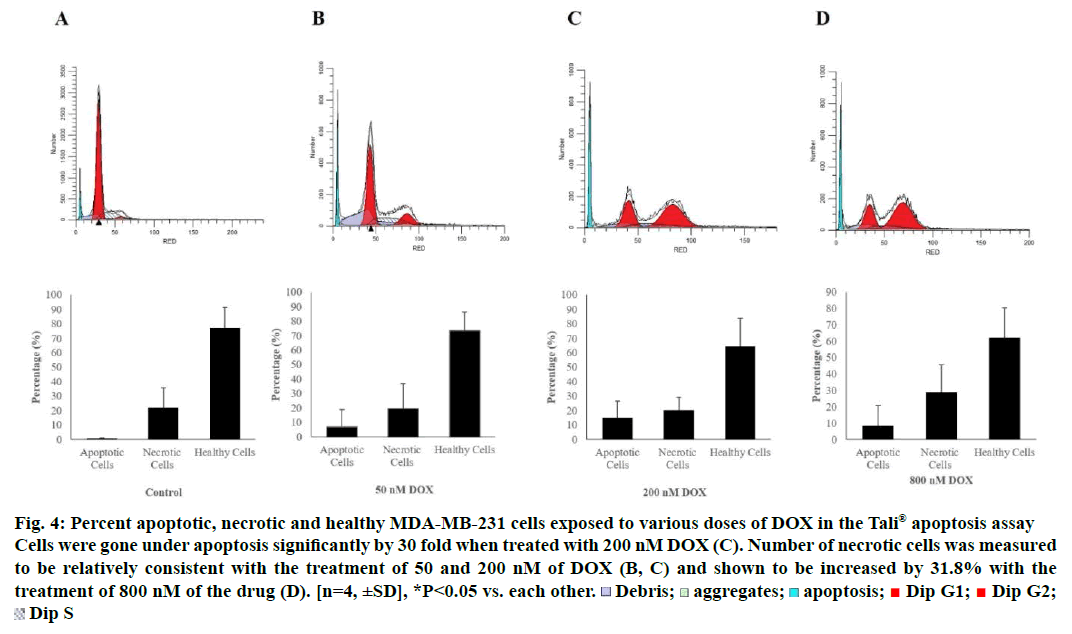
Tali® Apoptosis assay was carried out in order to further verify apoptosis of MCF-7 and MDA-MB-231 cells exposed to DOX. Results indicated an elevation in apoptosis rate by 5.8, 10 and 13.75% compared to control when MCF-7 cells were treated with 50, 200 and 800 nM of the drug, respectively. Percent healthy cells significantly decreased when MCF-7 cells were treated with 800 nM and necrotic cell rate was increased up to 47.25% (Figure 3). MDA-MB-231 cells were gone under apoptosis by 6.75, 15 and 8.25% when treated with 50, 200 and 800 nM of the drug, respectively. Percentage of necrotic cells was found to be increased by 29% as a response to treatment of 800 nM of DOX (Figure 4).
Figure 3: Percent apoptotic and necrotic cells after DOX treatment of MCF-7 breast cancer cell line
Percentage of apoptotic cells was increased in dose-dependent way. This increase was more evident to be 2.29 fold compared to
control upon exposure to 800 nM. Necrotic cell rates were also augmented while healthy cell rate was decreased distinctively
when dose of the drug applied increased. (n=4, ±SD), *P<0.05 vs. each other.  Debris;
  aggregates;
 apoptosis;
  Dip G1;
  Dip G2;
  Dip S
Dip S
Figure 4: Percent apoptotic, necrotic and healthy MDA-MB-231 cells exposed to various doses of DOX in the Tali® apoptosis assay
Cells were gone under apoptosis significantly by 30 fold when treated with 200 nM DOX (C). Number of necrotic cells was measured
to be relatively consistent with the treatment of 50 and 200 nM of DOX (B, C) and shown to be increased by 31.8% with the
treatment of 800 nM of the drug (D). [n=4, ±SD], *P<0.05 vs. each other.  Debris;
  aggregates;
  apoptosis;
  Dip G1;
  Dip G2;
  Dip S
Dip S
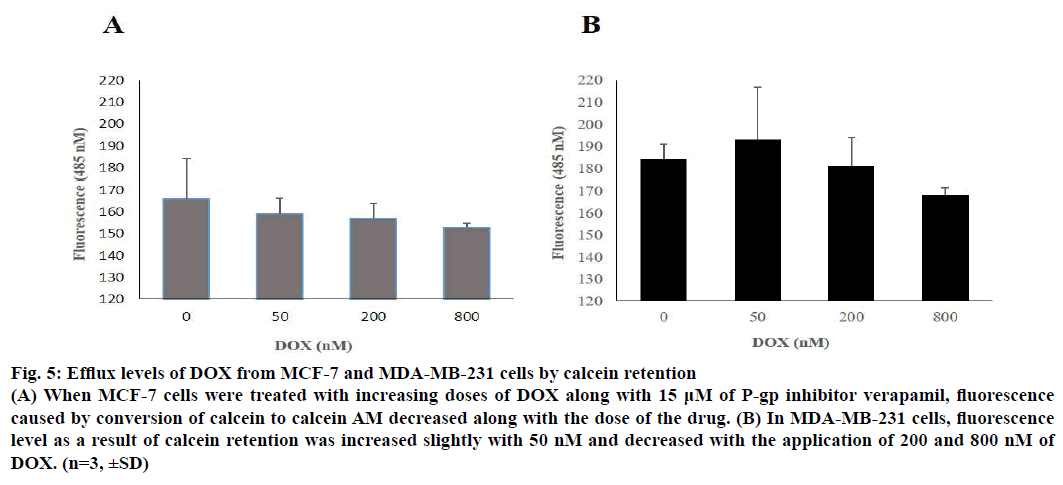
When 50, 200 and 800 nM of DOX was applied to cells along with 15 μM P-gp inhibitor verapamil, it was seen that calcein retention reduced slightly on a dose-dependent manner. Calcein retention was measured by the fluorescence signal of calcein AM, which is a product of calcein inside the cell. According to the results, drug efflux was more evident on MCF-7 when compared to MDA-MB-231 and the results were illustrated in Figure 5.
Figure 5: Efflux levels of DOX from MCF-7 and MDA-MB-231 cells by calcein retention
(A) When MCF-7 cells were treated with increasing doses of DOX along with 15 μM of P-gp inhibitor verapamil, fluorescence
caused by conversion of calcein to calcein AM decreased along with the dose of the drug. (B) In MDA-MB-231 cells, fluorescence
level as a result of calcein retention was increased slightly with 50 nM and decreased with the application of 200 and 800 nM of
DOX. (n=3, ±SD)
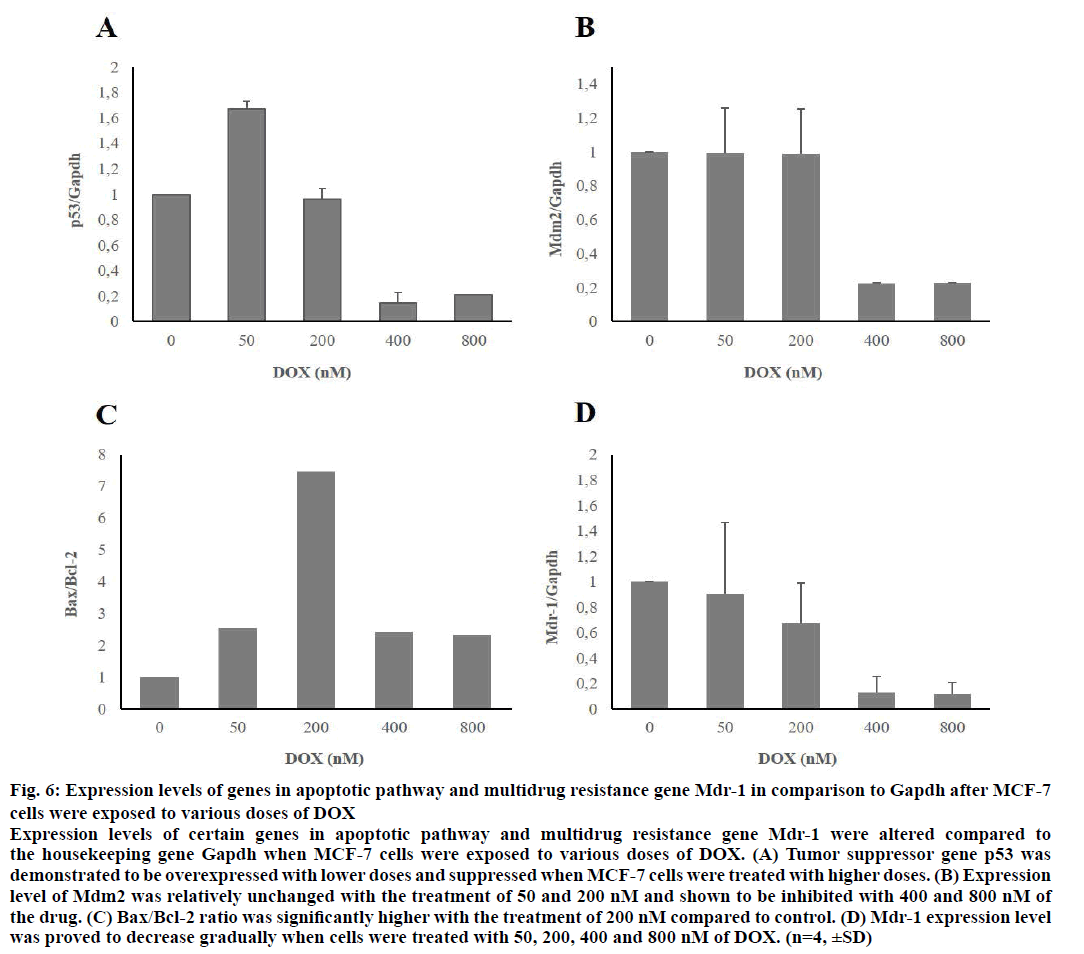
After MCF-7 and MDA-MB-231 cells were treated with 50, 200, 400 and 800 nM of DOX for 48 h, expression levels of certain genes, which belong to apoptotic pathway were proved to be changed when compared to housekeeping gene, Gapdh. When MCF-7 cells were treated with low doses of the drug, expression levels of pro-apoptotic genes p53 and Bax were increased significantly. Expression level of antiapoptotic gene Mdm2 was relatively unchanged with the treatment of 50 and 200 nM of DOX. Bax/Bcl-2 ratio increased significantly upon application of 200 nM of the agent. MDR gene Mdr-1 was shown to be suppressed in a concentration-dependent manner. Gene expression levels of MCF-7 cells were demonstrated in Figure 6.
Figure 6: Expression levels of genes in apoptotic pathway and multidrug resistance gene Mdr-1 in comparison to Gapdh after MCF-7
cells were exposed to various doses of DOX
Expression levels of certain genes in apoptotic pathway and multidrug resistance gene Mdr-1 were altered compared to
the housekeeping gene Gapdh when MCF-7 cells were exposed to various doses of DOX. (A) Tumor suppressor gene p53 was
demonstrated to be overexpressed with lower doses and suppressed when MCF-7 cells were treated with higher doses. (B) Expression
level of Mdm2 was relatively unchanged with the treatment of 50 and 200 nM and shown to be inhibited with 400 and 800 nM of
the drug. (C) Bax/Bcl-2 ratio was significantly higher with the treatment of 200 nM compared to control. (D) Mdr-1 expression level
was proved to decrease gradually when cells were treated with 50, 200, 400 and 800 nM of DOX. (n=4, ±SD)
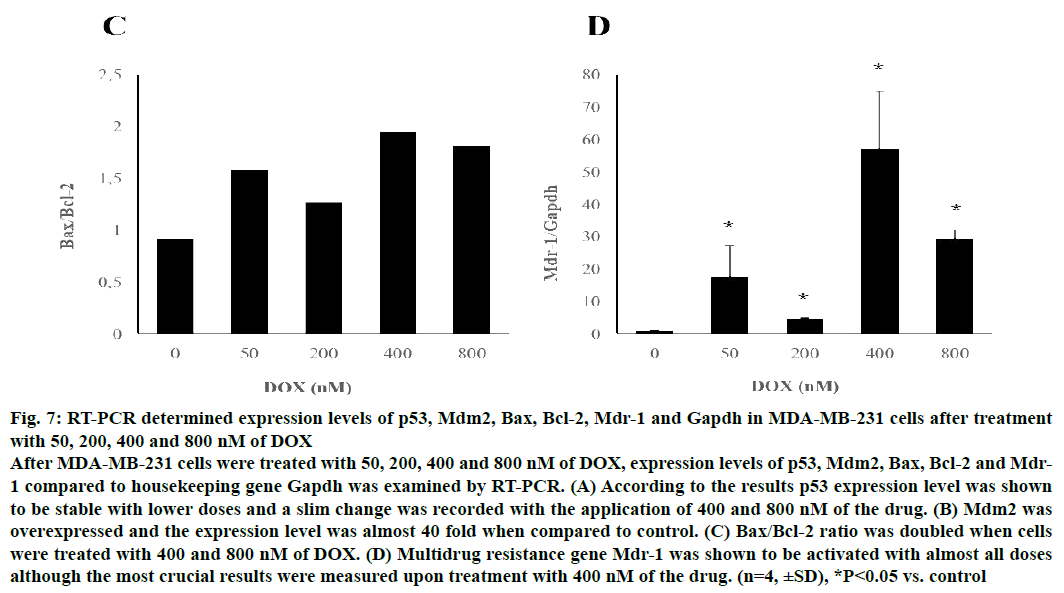
Following 48 h of treatment with various doses of DOX, p53 levels remained relatively unchanged while expression level of other pro-apoptotic gene Bax clearly augmented upon treatment with 400 and 800 nM of the drug in MDA-MB-231 cells. p53 inhibitor Mdm2 was triggered by almost 40 fold when MDA-MB-231 cells were treated with 400 nM DOX (P<0.05). Similarly, Bcl-2 expression level was measured to be increased with the treatment of high doses of the drug and all results were statistically relevant when compared to control (P<0.05). Bax/Bcl-2 ratio increased up to 2 fold when cells were exposed to 400 nM.
Mdr-1 was evidently stimulated in MDA-MB-231 cells upon treatment of all doses aforementioned in a doseindependent manner and highest rate was seen with the application of 400 nM of DOX (P<0.05). Gene expression levels of MDA-MB-231 cells compared the expression level of reference gene, Gapdh were shown in Figure 7.
Figure 7: RT-PCR determined expression levels of p53, Mdm2, Bax, Bcl-2, Mdr-1 and Gapdh in MDA-MB-231 cells after treatment
with 50, 200, 400 and 800 nM of DOX
After MDA-MB-231 cells were treated with 50, 200, 400 and 800 nM of DOX, expression levels of p53, Mdm2, Bax, Bcl-2 and Mdr-
1 compared to housekeeping gene Gapdh was examined by RT-PCR. (A) According to the results p53 expression level was shown
to be stable with lower doses and a slim change was recorded with the application of 400 and 800 nM of the drug. (B) Mdm2 was
overexpressed and the expression level was almost 40 fold when compared to control. (C) Bax/Bcl-2 ratio was doubled when cells
were treated with 400 and 800 nM of DOX. (D) Multidrug resistance gene Mdr-1 was shown to be activated with almost all doses
although the most crucial results were measured upon treatment with 400 nM of the drug. (n=4, ±SD), *P<0.05 vs. control
Breast cancer is the second leading cause of cancerrelated mortality amongst women and treatment course includes surgery, chemotherapy and radiotherapy along with endocrine therapy [19]. Although chemotherapy is considered the most effective approach to induce apoptosis in breast cancer cells, which do or do not possess estrogen receptor (ER), progesterone receptor (PR) and/or human epidermal growth factor receptor 2 (HER2), MDR is one of the greatest obstacles against successful outcome [20]. After long-term exposure to anticancer agents, tumor cells can acquire resistance towards multiple drugs, which may differ from each other structurally or functionally [21]. Proteins known to facilitate drug efflux from cells and cause MDR are mainly the members of adenosine triphosphate binding cassette (ABC) family, including P-gp [22]. These proteins are able to decrease drug concentration in tumor cells and ultimately prevent apoptosis.
In the present study, the effect of DOX was investigated on MCF-7 and MDA-MB-231 breast cancer cell lines with the intention of demonstrating the divergence of response in terms of apoptosis and MDR. Cells were treated with various doses of DOX for 48 h and antiproliferative effect of the drug was examined via SRB cell viability assay. Viability rates of both of the cell lines were reduced in a dose-dependent manner and DOX was shown to be more toxic on MDA-MB-231 cells in accordance with previous studies [23,24].
Each phase of cell cycle has its own checkpoints of which controls cell cycle arrest with the objective of fixing the damage and activating repair mechanisms. If the damage is too much to be fixed, apoptosis is induced [25]. In order to further assess the influence of DOX on cell proliferation, cell cycle distribution of the cells was explored. Results suggested that DOX-induced cell cycle arrest predominantly at G2/M checkpoint in a dose-dependent manner in both of the cell lines although the effect was more evident in MDA-MB-231 cells. Cell cycle arrest on G1 was distinct in a concentration-dependent way only on MCF-7. MCF-7 cells possess wild-type p53 gene, whereas the gene is mutated and inactive in MDA-MB-231 cells [26]. According to the data, p53 was activated in MCF-7 following DOX treatment, which led to cell cycle arrest in G1. Number of cells in G1 phase was increased with the treatment of 50 and 200 nM indicating typical cell cycle arrest and significantly dropped when MCF-7 cells were exposed to 800 nM of the drug. However, percentage of MDA-MB-231 cells on G1 phase reduced along with the dose applied.
When 50 and 200 nM of DOX was introduced to MCF-7 and MDA-MB-231 cells, apoptotic cell rates were augmented along with the dose. Percentage of apoptotic MCF-7 cells kept increasing with the exposure of 800 nM of the drug while it was decreased in MDA-MB-231 cells. As being an important indicator of apoptosis, Bax/Bcl-2 expression ratios were measured and showed to be consistent with the apoptosis assay results as the ratio was higher with lower doses of drug rather than higher doses applied. Also the expression level of tumor suppressor gene p53 was seemed to be higher when MCF-7 cells were treated with 50 nM of DOX when compared to the control and the other doses.
Expression levels of Mdr-1 gene of MCF-7 cells gradually diminished with the dose of drug applied, which was likely to be the reason behind higher apoptotic cell rates. In MDA-MB-231 cells, however, Mdr-1 was activated as a response to all the dose applied and the expression level was to be highest after the treatment with 400 nM of DOX. Thus percentage of apoptotic cells were less when compared to MCF-7. These data were found to be in correlation with drug efflux assay.
In conclusion, the present study provides additional insights on apoptotic and MDR mechanisms, which is triggered by a potent anticancer agent, DOX. DOX induces apoptosis in both ER, PR and HER2 possessing cells (MCF-7) and the cells, which do not own any of these receptors (MDA-MB-231). Clearly, inhibition of cell proliferation and degree of apoptosis vary in two cell lines as different checkpoints of the cell cycle are activated due to p53 status, Bax/Bcl-2 ratio differs and the intensity of MDR is more apparent in MDA-MB-231 cells. This study also exhibits the importance of MDR when it comes to the success rate of chemotherapy and sets an example of the difference between apoptosis and MDR levels of two breast cancer cell lines.
Acknowledgements
No potential acknowledgement is declared regarding the publication of this paper.
Financial support
None.
Conflıcts of ınterest
The authors have no potential conflict of interest to declare.
References
- Harbeck N, Salem M, Nitz U, Gluz O, Liedtke C. Personalized treatment of early-stage breast cancer: present concepts and future directions. Cancer Treat Rev 2010;36:584-94.
- Balekouzou A, Yin P, Pamatika CM, Bishwajit G, Nambei SW, Djeintote M, et al. Epidemiology of breast cancer: retrospective study in the Central African Republic. BMC Public Health 2016;16:1230.
- Anderson BO, Yip CH, Ramsey SD, Bengoa R, Braun S, Fitch M, et al. Breast cancer in limited-resource countries: health care systems and public policy. Breast J 2006;12:S54-69.
- Levine B, Klionsky DJ. Development by self-digestion: molecular mechanisms and biological functions of autophagy. Dev Cell 2004;6:463-77.
- Kerr JF, Wyllie AH, Currie AR. Apoptosis: a basic biological phenomenon with wide-ranging implications in tissue kinetics. Br J Cancer 1972;26:239-57.
- Khan M, Maryam A, Qazi JI, Ma T. Targeting Apoptosis and Multiple Signaling Pathways with Icariside II in Cancer Cells. Int J Biol Sci 2015;11:1100-12.
- Millimouno FM, Dong J, Yang L, Li J, Li X. Targeting apoptosis pathways in cancer and perspectives with natural compounds from mother nature. Cancer Prev Res (Phila) 2014;7:1081-107.
- Finlay CA, Hinds PW, Tan TH, Eliyahu D, Oren M, Levine AJ. Activating mutations for transformation by p53 produce a gene product that forms an hsc70-p53 complex with an altered half-life. Mol Cell Biol 1988;8:531-9.
- Riley T, Sontag E, Chen P, Levine A. Transcriptional control of human p53-regulated genes. Nat Rev Mol Cell Biol 2008;9:402-12.
- Feki A, Irminger-Finger I. Mutational spectrum of p53 mutations in primary breast and ovarian tumors. Crit Rev Oncol Hematol 2004;52:103-16.
- Hao Q, Cho WC. Battle against cancer: an everlasting saga of p53. Int J Mol Sci 2014;15:22109-27.
- Pauwels EK, Erba P, Mariani G, Gomes CM. Multidrug resistance in cancer: its mechanism and its modulation. Drug News Perspect 2007;20:371-7.
- Palmeira A, Sousa E, Vasconcelos MH, Pinto MM. Three decades of P-gp inhibitors: skimming through several generations and scaffolds. Curr Med Chem 2012;19:1946-2025.
- Lage H. An overview of cancer multidrug resistance: a still unsolved problem. Cell Mol Life Sci 2008;65:3145-67.
- Gottesman MM, Ling V. The molecular basis of multidrug resistance in cancer: the early years of P-glycoprotein research. FEBS Lett 2006;580:998-1009.
- Lv L, An X, Li H, Ma L. Effect of miR-155 knockdown on the reversal of doxorubicin resistance in human lung cancer A549/dox cells. Oncol Lett 2016;11:1161-6.
- Vichai V, Kirtikara K. Sulforhodamine B colorimetric assay for cytotoxicity screening. Nat Protoc 2006;1:1112-6.
- Susa M, Choy E, Yang C, Schwab J, Mankin H, Hornicek F, et al. Multidrug resistance reversal agent, NSC77037, identified with a cell-based screening assay. J Biomol Screen 2010;15:287-96.
- Effects of chemotherapy and hormonal therapy for early breast cancer on recurrence and 15-year survival: an overview of the randomised trials. Lancet 2005;365:1687-717.
- Butt AJ, McNeil CM, Musgrove EA, Sutherland RL. Downstream targets of growth factor and oestrogen signalling and endocrine resistance: the potential roles of c-Myc, cyclin D1 and cyclin E. Endocr Relat Cancer 2005;12:S47-59.
- Fletcher JI, Haber M, Henderson MJ, Norris MD. ABC transporters in cancer: more than just drug efflux pumps. Nat Rev Cancer 2010;10:147-56.
- Gillet JP, Efferth T, Remacle J. Chemotherapy-induced resistance by ATP-binding cassette transporter genes. Biochim Biophys Acta 2007;1775:237-62.
- Taherian A, Mazoochi T. Different Expression of Extracellular Signal-Regulated Kinases (ERK) 1/2 and Phospho-Erk Proteins in MBA-MB-231 and MCF-7 Cells after Chemotherapy with Doxorubicin or Docetaxel. Iran J Basic Med Sci 2012;15:669-77.
- Tang ZH, Li T, Gao HW, Sun W, Chen XP, Wang YT, et al. Platycodin D from Platycodonis Radix enhances the anti-proliferative effects of doxorubicin on breast cancer MCF-7 and MDA-MB-231 cells. Chin Med 2014;9:16.
- Deljanin M, Nikolic M, Baskic D, Todorovic D, Djurdjevic P, Zaric M, et al. Chelidonium majus crude extract inhibits migration and induces cell cycle arrest and apoptosis in tumor cell lines. J Ethnopharmacol 2016;190:362-71.
- Kudoh K, Ramanna M, Ravatn R, Elkahloun AG, Bittner ML, Meltzer PS, et al. Monitoring the expression profiles of doxorubicin-induced and doxorubicin-resistant cancer cells by cDNA microarray. Cancer Res 2000;60:4161-6.
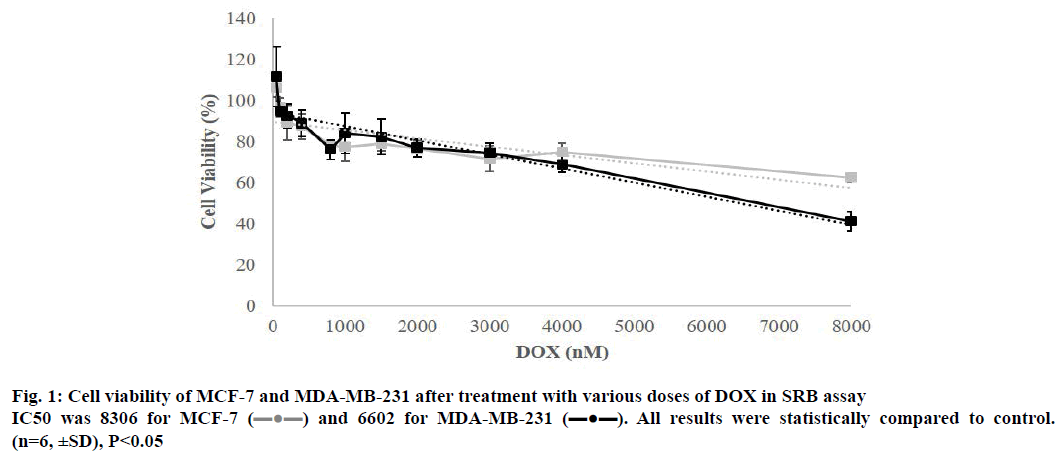
 ) and 6602 for MDA-MB-231 (
 ). All results were statistically compared to control.
(n=6, ±SD), P<0.05