- *Corresponding Author:
- P. B. Shah
Shri B. M. Shah College of Pharmacy, Modasa-383 315. 1Shri S. K. Patel College of Pharmaceutical Education and Research, Kherva, Mehsana-382 711, India.
E-mail: pbshah23@rediffmail.com
| Date of Submission | 29 May 2004 |
| Date of Revision | 30 March 2005 |
| Date of Acceptance | 15 February 2006 |
| Indian J Pharm Sci,2006, 68 (1): 90-93 |
Abstract
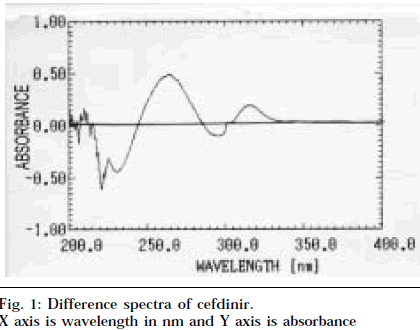
Two simple efficient and reproducible difference spectroscopic and reverse phase high performance liquid chromatographic methods have been developed for the estimation of cefdinir in pharmaceutical dosage forms. Difference spectroscopic method is based on the measurement of absorbance of cefdinir at maxima 265 nm and minima 230 nm. The measured value is the amplitude of maxima and minima between two eqimolar solutions of the analyte in different chemical forms, which exhibit different spectral characteristics. Beer's law was obeyed in the concentration range of 10 to 35 mg/ml. The second method, a High Performance Liquid Chromatography, was developed for the estimation of cefdinir, using 50 mM ammonium acetate (pH 3.0±0.1 adjusted with 10% phosphoric acid) and methanol (80:20% v/v) as the mobile phase with flow rate of 1 ml/min, and measuring the response at 285 nm. An external standard calibration method was employed for quantitation. Beer's law was obeyed in the concentration range of 15 to 125 mg/ml. The results obtained in the analysis of dosage forms agree well with the labelled contents.
Introduction
Cefdinir is chemically [6R-[6α,7β(Z)]]–7-[[(2–amino–4– thiazolyl) hydroxyimino) acetyl] amino]–3–ethyl–8–oxo– 5–Thia–1–azabicyclo-(4.2.0.)-oct–2–one–2–carboxylic acid.[1] It is a broad-spectrum oral cephalosporin active against Gram-positive and Gram-negative bacteria [2]. Literature survey reveals that HPLC methods have been reported for the estimation of cefdinir and its related impurities [3,4]. So far only one method has been reported for the estimation of cefdinir from pharmaceutical dosage forms [5].
We report here, two simple and reproducible methods, viz., (1) difference spectroscopic and (2) reverse phase HPLC methods for the analysis of cefdinir from pharmaceutical dosage forms. The methods were validated by employing suitable statistical methods. In difference spectroscopic method, the absorbance is measured at maxima 265 nm and minima at 230 nm. The measured value is the amplitude of maxima and minima between two eqimolar solutions of the analyte in different chemical forms, which exhibit different spectral characteristics. The method is advantageous over others, as it achieves the spectrophotometric isolation of the drug; moreover, interference due to additives can be nullified as can be proved by no change in isobestic points [6]. The second method, a high performance liquid chromatography (HPLC), was developed, using 50 mM ammonium acetate (pH 3.0±0.1 adjusted with 10% phosphoric acid) and methanol (80:20% v/v) as the mobile phase with flow rate of 1 ml/min and measuring the response at 285 nm.
All the reagents used were of analytical grade. A stock solution of cefdinir (1 mg/ml) was prepared by dissolving 100 mg of the drug in 100 ml 0.1 M phosphate buffer (pH 7.0). Spectral and absorbance measurement were made on Shimadzu-1601 UV/Vis Spectrophotometer by using 1 cm matched quartz cells.
Aliquots of cefdinir stock solution (1 mg/ml) of the drug ranging from 0.1 to 0.35 ml were transferred to two sets of a series of 10 ml volumetric flask. One set of cefdinir solutions was diluted with 0.5N HCl to volume, and second set of cefdinir solutions was diluted with buffer to volume. Difference spectrum was recorded by placing same concentration of acidic and buffer solution in sample and reference cell respectively. The amplitude was plotted versus concentration (10-35 μg/ml), calibration curve was constructed, and the regression equation was calculated (Table 1).
| Parameters | Difference | HPLC |
|---|---|---|
| Spectroscopic Method | method | |
| λ (nm) | 265a 230b | 285 |
| Beer’s law limits (µg/ml) | 10 – 35 | 15 - 125 |
| Regression equation (Y = a + bX) | ||
| Slope (b) | 0.0266 | 61698 |
| Intercept (a) | -0.0551 | -352970 |
| Correlation coefficient | 0.9933 | 0.9995 |
| % Range of error | ||
| 0.05 level confidence limit | 0.1390 | 0.0834 |
| 0.01 level confidence limit | 0.2300 | 0.1380 |
aAbsorption maxima, bAbsorption minima, Y=a+bX, where “X” is concentration in mg/ml and Y is absorbance units.
Table 1: Optical Characteristics
Not less than 20 capsules were weighed and emptied. A quantity of powder equivalent to 10 mg of cefdinir was than extracted with 10 ml buffer. The solution was prepared and analyzed as described above. The amount of cefdinir present in the sample solution was computed from the calibration curve (Table 2).
| Pharmaceutical | Labeled | Amount estimated (mg) | % Recovery* | ||
|---|---|---|---|---|---|
| formulations | Amount (mg) | Difference | HPLC | Difference | HPLC |
| spectroscopic method | method | spectroscopic method | method | ||
| 1 | 300 | 293.0 | 299.5 | 98.7 ± 0.43 | 99.8 ± 0.10 |
| 2 | 300 | 301.0 | 299.0 | 99.0 ± 0.51 | 99.8 ± 0.10 |
| 3 | 300 | 304.0 | 300.0 | 101.6 ± 1.59 | 99.7 ± 0.10 |
| 4 | 300 | 302.5 | 299.0 | 101.6 ± 0.85 | 99.7 ± 0.13 |
| 5 | 300 | 302.0 | 299.5 | 100.0 ± 1.18 | 99.9 ± 0.09 |
*Values are mean±SEM of five determinations. Formulation 1 is capsules (300 mg) of ALDINIR (Alembic), formulation 2 is capsules (300 mg) of ZEFDINIR (German Remedies), formulation 3 is capsules (300 mg) of ADCEF (Torrent), formulation 4 is capsules (300 mg) of OCEPH (Zuventus) and formulation 5 is capsules (300 mg) of SEFDIN (Unichem).
Table 2: Analysis Of Cefdinir Formulations By Proposed Methods
The difference spectroscopic method is based on the nullification of UV absorbance at the wavelength corresponding to the point of intersection of drug spectra in acidic and basic media [7]. The technique of difference spectroscopy is as convenient and precise as conventional spectroscopy but offers the advantage of increased specificity. The methodology requires that a drug exists in two forms that differ in their absorption spectra, which have been obtained using temperature difference, pH difference, solvent perturbation and concentration, but mainly generated by pH effects. The pH chosen must quantitatively form single species with at least 99% spectral purity. 0.5N HCl and phosphate buffer (pH 7.0) were chosen to generate pH difference. The peak maxima were obtained at 265 nm and minima at 230 nm (Fig. 1). The amplitude, which is the sum of magnitude of absorbance at the above two wavelengths, was selected for the measurement. The isobestic points (points representing zero absorbance corresponding to cutting points of acidic and alkaline spectra) were recorded at 244 nm and 287 nm, which were identical irrespective of the pH of solution in reference cell. There is no change in isobestic points, which reveals that there is no interference by additives.
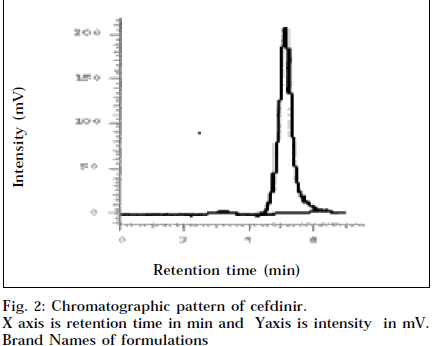
In HPLC method, mobile phase used was 50 mM ammonium acetate (pH 3.0±0.1 adjusted with 10% phosphoric acid) and methanol (80:20% v/v). The retention time was found to be 5.08 min (Fig. 2). Beer’s law was obeyed in the range of 15-125 μg/ml (Table 1). Precision of the method was established by five repeated analysis of the sample.
To evaluate the recovery of the methods, known amounts of pure drug were added to the previously analyzed pharmaceutical preparations and the mixtures were analyzed by the proposed methods. The percentage recoveries thus obtained are given in Table 2. Interference studies revealed that the common excipients and other additives usually present in dosage forms did not contribute in the proposed methods. The proposed methods are simple, sensitive, precise, reproducible and accurate and hence can be used for the routine determination of cefdinir in bulk as well as in pharmaceutical preparations as alternative to the existing methods.
Acknowledgements
The authors are thankful to Torrent Research Center, Bhatt, Ahmedabad, for providing a gift sample of cefdinir.
References
- .Budavari, S., Eds., In; The Merck Index, 12th Edn., Merck and Co.Inc., Whitehouse Station. NJ, 1996, 1971.
- Mine, Y., Wantanabe, Y., Matsumoto, Y., Kuno, K., Hantano, K., Higashi, Y., and Kuwahara, S., Chemotherapy, 1989, 37, 122.
- Okamoto, Y., Itoh, K., Namiki, Y., Matsushita, J., Fujioka, M., and Yasada, T., J. Pharm. Bio. Med. Anal. 1996, 14, 739.
- Cohen, C. and Michael, N., Dig. Microbiol. Infect. Dis., 1994, 18, 31.
- Gandhimathi, M., Suganthi, A., Ravi, T.K. and Minu B., Indian J.Pharm. Sci., 2004, 66, 248.
- Smith, R.V. and Stewart, J.T., In; Text book of Biopharmaceutic Analysis, Lea and Febiger, Philadelphia, 198, 138.
- Beckett, A.H. and Stelnlake, J.B., In; Practical Pharmaceutical Chemistry, 2001, 4, 293.

