- Corresponding Author:
- P. K. Porwal
Department of Pharmaceutical Chemistry, SNJB's SSDJ College of Pharmacy, Chandwad-423 101, India
E-mail: pawankporwal@gmail.com
| Date of Submission | 30 October 2014 |
| Date of Revision | 17 February 2015 |
| Date of Acceptance | 22 November 2015 |
| Indian J Pharm Sci 2015;77(6):742-750 |
This is an open access article distributed under the terms of the Creative Commons Attribution-NonCommercial-ShareAlike 3.0 License, which allows others to remix, tweak, and build upon the work non-commercially, as long as the author is credited and the new creations are licensed under the identical terms.
Abstract
A simple, economical and robust analytical high-performance liquid chromatography-ultraviolet method was developed and validated for simultaneous chromatographic elution of two cardiovascular drugs viz. amlodipine and atorvastatin in biological fluid for the first time. Only two liquid chromatography–mass spectrometry/mass spectrometry methods are available in literature for quantitation of selected pair of analytes. The bioanalytical method was developed in rat plasma by using Thermo beta-basic C18 (100×4.6 mm, 5 μm) and mobile phase was composed of dibasic phosphate buffer (pH 3.0):acetonitrile in the ratio of 55:45 at a flow rate of 1 ml/min with ultraviolet detection monitored at 240 nm. The selected chromatographic conditions were found to effectively separate amlodipine (5.1 min) and atorvastatin (12.1 min). The parametric statistics,i.e.correlation coefficient of 0.999, was assessed for both the drugs having linearity over the tested concentration range (0.05 to 10.0 μg/ml) in rat plasma using an unweighted calibration curve. The mean recovery (%) was more than 92.8% for both the drugs using protein precipitation method. The accuracy of samples for six replicate measurements at lower limit of quantitation level was within limit. The method was validated and was successfully applied to the nonclinical pharmacokinetic study of combination tablets containing amlodipine and atorvastatin in six Sprague Dawley rats.
Keywords
Amlodipine, atorvastatin, cardiovascular drugs, simultaneous, high-performance liquid chromatography-ultraviolet, rat plasma, pharmacokinetic
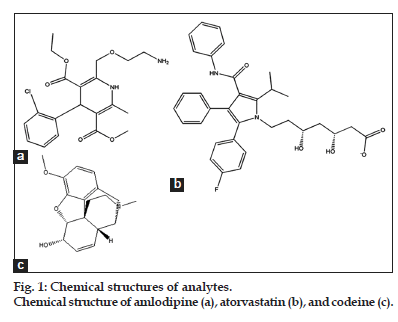
Amlodipine (AMLO; fig. 1a), a well established third generation dihydropyridine calcium channel blocker (CCB), is commonly used as an antihypertensive[1]. It acts by decreasing total peripheral resistance and by relaxing the smooth muscle in the arterial wall, therefore, reducing elevated blood pressure[2,3]. Atorvastatin (ATOR, fig. 1b), a synthetic lipid-lowering agent and an inhibitor of 3-hydroxy-3-methylglutaryl-coenzyme A (HMG-CoA) reductase[3], is used for lowering blood cholesterol. Antihypertensive and lipid-lowering medications substantially reduce the risk of stroke, CAD, and death in patients with cardiovascular risk factors[4,5].
The patients with hypertension are having higher coincidence of suffering with comorbid disease state like diabetes and dyslipidaemia[6-8]. Therefore, the combination of these two drugs is very common to reduce the high risk of morbidity in cardiovascular diseases. The combination of amlodipine and atorvastatin in single tablet has been shown to be cost effective compared to two-tablet therapy[9,10].
Validated assays methods have been reported for each drug either individually or in combination with other drugs. Various methods including gas chromatography (GC)[11], high-performance liquid chromatography (HPLC)[12-15], high-performance thin layer chromatography (HPTLC)[16], on-line coupled isotachophoresis–capillary zone electrophoresis separation method with diode array detection[17], enzyme-linked immune-sorbent assay[18], flow injection analysis[19], capillary electrophoresis[20], voltammetry[21] and liquid chromatography coupled with tandem mass spectrometry[22-24] have been used for the determination of AMLO in biological fluids and in pharmaceutical preparations.
ATOR has been determined alone in plasma and formulation by different methods involving and HPTLC[25], GC/MS and liquid chromatography electro-spray ionization (LC–ESI-MS)[26] HPLC-UV detection[27].
ATOR and AMLO have been quantified simultaneously in pharmaceutical preparation and in biological fluid using HPTLC[28], HPLC[29] and LC-MS/MS[30-32]. The HPLC method is utilized to estimate the combination of AMLO and ATOR in pharmaceutical preparations only. The LC-MS/MS methods were used for simultaneous quantitation of AMLO, ATOR and ortho- and para- hydroxy metabolite of ATOR in human plasma. The HPLCUV method reported by Shah et al. has shown the elution of AMLO below 5.0 min (3.2 min) using pharmaceutical preparation as matrix[29].
The simultaneous estimation of AMLO and ATOR in biological fluid have been determined in human plasma by LC-MS/MS methods, which is considered to be costly, time consuming and complex as compare to HPLC-UV methods. On the contrary, the protein precipitation procedure employed here is rapid, simple and economical as compared to multiple steps sample processing procedures, like liquid–liquid or solid phase extraction.
To the best of our knowledge, the available literature deal only in costly LC-MS/MS method for the simultaneous determination of both the drugs in human plasma and no HPLC-UV method was available to quantify the combination in biological fluids. Hence, it was thought worth to establish a noble analytical HPLC-UV method for simultaneous determination of AMLO and ATOR in biological fluids. This study intended to develop and validate a new HPLC-UV method for simultaneous determination of AMLO and ATOR in rat plasma by liquid chromatography coupled with UV spectroscopy as per USFDA’s[33] and EMEA’S[34] bioanalytical guidelines. Subsequently, the validated method was applied to nonclinical pharmacokinetic study.
Materials and Methods
All solvents used for mobile phase were of HPLC grade, dosage formulations were purchased from the local pharmacy.
A high-performance liquid chromatographic system (Jasco, Kyoto, Japan) composed of a PU-2089 plus Quaternary pump solvent delivery module, a manual rheodyne injector with a 20 μl fixed loop and a UV-2075 intelligent UV/Vis detector. For statistical calculations in bioanalytical method validation Graphpad PRISM® version 5.1 for Windows, (Graphpad software Inc., California, USA) software was used.
Chromatographic condition
The chromatographic conditions were optimized by different means (using different columns, different buffers and different organic phases). Early chromatographic work was performed with different brands of C8 and C18 columns as stationary phase and various combinations of buffer phase with pH in the range of 2.5 to 4.5, organic phases (acetonitrile, ACN and/or methanol), stepwise. The flow rate of mobile phase was varied within 1.0~1.5 ml/min. Wavelength for monitoring the eluent was selected by scanning standard solution of drugs within 200 to 400 nm using double beam UV/Vis spectrophotometer (Jasco UV V630, Japan).
In order to achieve an optimum separation, effect of varying concentrations of buffer agent on different peak parameters, were evaluated viz.mobile phase dibasic phosphate buffer (pH 2.5 to 4.0) in range 5-35 mM concentration with ACN at 1.0 ml/min flow rate in buffer to organic ratio 60:40 to 30:30.
Moreover, the effects of different levels of all these factors were systematically addressed on system suitability parameters such as %RSD of peak area, retention time, capacity factor, asymmetry, resolution and peak width.
All noted measurements were performed with an injection volume of 20 μl and UV detection at 232 nm of samples dissolved in a diluent consist of buffer phase and organic phase in the ratio of 2:3, respectively. During development of bioanalytical procedure, diluent was changed accordingly.
Preparation of standard and resolution solution
Diluted standard solutions of each analyte representing 10 μg/ml concentration were prepared with diluent. Codeine (CODN, fig. 1c) was used as internal standard (IS) for AMLO and ATOR. Resolution solution containing 10 μg/ml each of AMLO and ATOR and 5.0 μg/ml of CODN was prepared from respective stock solutions.
For optimization purposes, 20 μl of resolution solution was injected in to chromatograph and system suitability parameters viz. %RSD of peak area for six injections of all analytes, %RSD of retention time for six injections of all analytes, peak asymmetry factor at 10% peak height and resolution were studied.
Sample preparation and extraction
The protein precipitation was the preferred choice of separation because of the minimized steps in extraction of drug from matrix. The method was attempted using 10% trichloroacetic acid (TCA) and ACN and combination thereof. It was carried out by and 1 part of plasma, 0.1 part drug and 0.05 parts of IS Diluted standard solution containing all analytes (15 μl) was added to 150 μl of plasma previously spiked with internal standards in a 1.5 ml capacity micro-centrifuge tube. The blend was subjected to vortex for about 3 min. The mixture was allowed to stabilize for two min then 100 μl of cold aqueous 10% (w/v) TCA was added and subjected to vortex for two minute. Analytes were slightly soluble in aqueous environment, therefore, about 245 μl of ACN was added and mixture was subjected to vortex for 10 min followed by centrifugation for 10 min at 15000 rpm at 4º. About 200 μl of supernatant was collected and mixed with equal volume of 0.1% phosphoric acid (~pH 3.0) and subjected to vortex for 3 min. About 20 μl of the buffered supernatant was injected into HPLC system.
Bioanalytical method validation
The developed HPLC conditions were validated as per USFDA guideline for bioanalytical method validation. To demonstrate the specificity of the method blank plasma from five different lots, spiked plasma samples and plasma samples spiked with frequently prescribed medication were analyzed. Selectivity was established by injecting six samples at the LLOQ level and each of the six blank plasma samples were tested for interference by comparing the mean peak response obtained by injecting blank plasma samples to mean peak response of LLOQ (0.1 μg/ml for ATOR and 0.05 μg/ml for AMLO). Representative chromatograms were generated to show that other components that could be present in the sample matrix are resolved from the selected analytes. Dilution integrity and carry over effect were also accessed to demonstrate specificity for the method.
Calibration curve
The standard curve was determined on each day of the six day validation period; the slope, intercept and the correlation coefficient were determined. Each run consisted of a double control, system suitability sample, blank samples (a plasma sample processed without an IS), a zero sample (a plasma processed with IS), calibration curve consisting of twelve non-zero samples covering the total range (LLOQ to 10 μg/ml for AMLO and ATOR) and QC samples at three concentrations (n=6, at each concentration). Such runs were generated on six consecutive days. Calibration samples were analysed from low to high at the beginning of each run and other samples were distributed randomly through the run. For calculation of the standard curve plots of peak area ratios against concentration were used.
Sensitivity
The sensitivity (LLOQ) was determined by signal to noise ratio. The resolution solution were serially diluted and spiked to the rat plasma and injections were made to obtain chromatogram. Similarly, blank plasma samples were also processed and injected in to chromatograph. The LLOQ was expressed for the analyte concentration having response at least 5 times more compared to blank response.
Precision and accuracy
Intraday precision, interday precision and the accuracy were calculated from data obtained during a 6-day validation. Three concentrations were chosen from the high medium and low range of the standard curve as quality control (QC) samples. Plasma samples spiked at five concentrations i.e. LLOQ, low QC, medium QC, high QC and ULOQ (i.e. LLOQ, 0.2, 1.0, 7.0 μg/ml and ULOQ for AMLO, and LLOQ, 0.3, 1.0, 7.0 μg/ml and ULOQ for ATOR) were analysed at each day of the 6-day validation (n=6 at each concentration). Precision was expressed as the coefficient of variation (%CV). Accuracy was expressed as the mean relative error (%MRE). Precision and accuracy values (%CV) less than or equal to 15% for QC samples, whereas less than or equal to 20% for LLOQ and ULOQ, were acceptable.
Recovery
Recovery of AMLO and ATOR was evaluated by comparing the mean peak response (peak area ratio of AMLO and ATOR with respect to IS) of processed LLOQ, ULOQ and three QC samples to mean peak response of unprocessed/without plasma of the same concentration. Recoveries of actives and their respective IS were evaluated by comparing the mean peak areas of processed samples to mean peak areas of unprocessed reference solutions of the same concentration.
Stability studies
The stability experiments were aimed at testing all possible conditions that the samples might experience after collecting and prior the analysis. The stability of the drug spiked at two QC levels (LQC and HQC) for short term bench top (at room temperature for 4, 8, 16 and 24 h), freeze thaw (3 cycles; -20º to room temperature) and long term (15, 30 and 45 days at -20º) were evaluated. Stability of all analytes in analytical solution was observed at room and temperature and in refrigerated conditions for period of 48 h.
In vivo plasma drug analysis
Two groups of male Sprague Dawley (SD) rats 8–10 weeks of age; were used for the study. Each group consisted of six animals. All animals were fasted for 18 h prior to the administration of the drug. Access to water was maintained during the experiment, but animals were fasted beginning the night before the experiment and through the 4 h of the experiments. A homogenous suspension of AMLO and ATOR was prepared in a vehicle comprising of 0.5% (w/v) carboxymethyl cellulose (CMC) in water and polyethylene glycol (PEG) 400 (90:10, v/v). First group of animals received vehicle as blank whereas, second group of animals received a single oral dose of 10 mg/kg each of AMLO and ATOR. About 0.2 ml of blood was withdrawn from the tail vein of a rat into heparinized Eppendorf® tubes at various time points viz. 0.5 h to predose, at 0.5, 1.0, 1.5, 2.0, 2.5, 3.0, 4.0, 5.0, 10.0 and 12.0 h after dose administration. Blood samples were centrifuged at 15000 rpm for 10 min and plasma was separated, and stored at -20º until use. The samples were processed as per protein precipitation protocol. The study adheresto “Principles of Laboratory Animal Care” and is approved by the institutional animal ethics committee for the purpose of controland supervision of experiments on animals.
The pharmacokinetic parameters namely, maximum plasma concentration (Cmax), time point of maximum plasma concentration (Tmax), area under the plasma concentration– time curve from 0 to the last measurable concentration (AUC0−t) and area under the plasma concentration–time curve from 0 to infinity (AUC0−∞) were estimated using non-compartmental analysis of pharmacokinetic add-in provided in Microsoft excel.
Results and Discussion
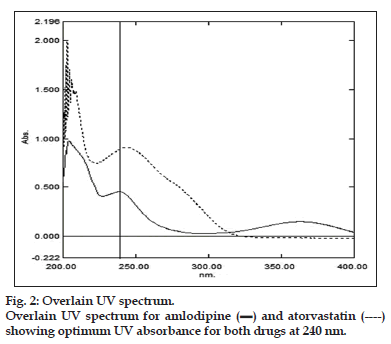
The primarily chromatographic experiments were set to elute selected analytes in biological fluid. The LOQ reported in earlier LC-MS/MS methods were in the range from picogram to tenth of nanogram, where tandem mass spectrometry cost and UV spectroscopy limits. The present HPLC-UV method claims to quantify low plasma concentrations of said analytes with sufficient accuracy and precision in pharmacokinetic samples. Therefore, the retention factor for first eluting antihypertensive drug was kept more than 5.0 (to avoid interference due to plasma protein’s peaks) using the preselected LC-column. The UV spectra of the analytes were determined independently in the rage of 400-200 nm. Fig. 2 showing 240 nm as optimal wavelength for analysis for selected antihypertensive and antihyperlipidemic actives.
Both the drugs have shown optimum response at 240 nm, therefore this wavelength was selected as wavelength for working. The selected analytes were showing similar physiochemical properties (having log P value more than 3.5 for both). Therefore, an isocratic mode of elution was tried for greater chance of success in the context. The mobile phase consisted of two major components: Mobile phase A containing aqueous di basic phosphate buffer whose pH was adjusted to 3.0 and Mobile Phase B was acetonitrile (ACN) the ratio of 55:45.
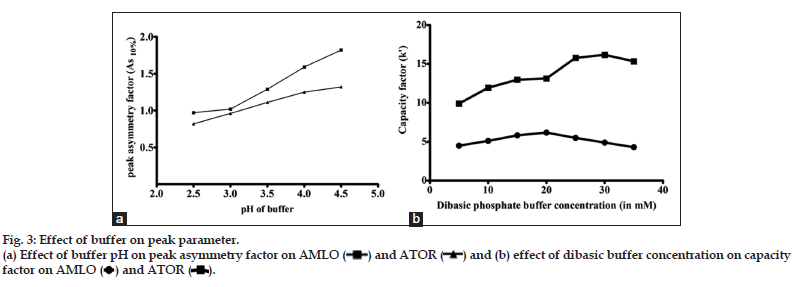
With the aim of the optimization of concentration buffer agents (5-35 mM), the remaining three factors were kept constant i.e. mobile phase composition (buffer phase with pH 3.0 and ACN) in isocratic mode with flow rate of 1 ml/min. Observed chromatographic responses for concentrations of buffering agent were plotted against of capacity factor of each analyte. The peakAs10% was least for concentration of dibasic phosphate buffer in the range of 10-20 mM. The peak asymmetry factor was always more than 2.0 with increase in the pH of buffer phase. The effect of pH on peak asymmetry factor of all the selected analytes are shown in fig. 3a. Looking at the importance of the different chromatographic parameters, buffer concentration in range of 10 to 20 mM of dibasic phosphate with pH in the range of 2.5 to 3.5 in isocratic mode with ACN was found to be optimum (fig. 3b).
When the ratio of mobile phase was set to 50 parts for acetonitrile and 50 parts for buffer, the peak of AMLO eluted before 5 min, therefore, higher proportion of organic in mobile was not preferred (i.e. the peaks of rat plasma protein may interfere below 5.0 min). The peaks plasma protein might be merged or co-eluted with AMLO’s peak. Therefore, capacity factor less than 5.0 was creating not acceptable HPLC conditions. The analytical HPLC methods reported to quantify the AMLO and ATOR simultaneously, were not applicable due to same reason. On setting higher proportion of buffer, retention time of ATOR increased (made method unnecessarily elongated) and the peak symmetry was also more than 2.0 (for both the actives). Mobile phase consisting of acetonitrile and phosphate buffer with pH in the range of 3.0-3.5, in isocratic elution pattern, was found most suitable for eluting selected combination drugs in single chromatographic run.
The selected stationary phase (Thermo beta-basic ODS column) has shown better repeatability with low back pressure because pore size of selected column was more (≈150 Å) as compare to routine analytical column (about 80-120Å). ACN was preferred as it has shown lesser UV cutoff response as compare to methanol. The results of system suitability studies in the final and optimized HPLC method are given in the Table 1.
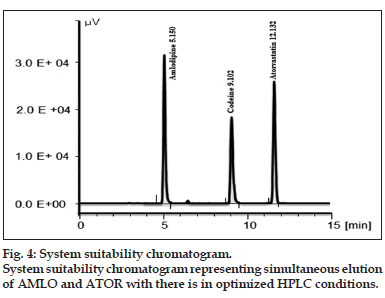
In the attempt for selection of internal standard (IS), CODN was made eluted in the optimized chromatographic HPLC conditions developed for AMLO and ATOR. The resolution between AMLO and last peak of plasma protein was 2.42. The resolution between CODN and ATOR was 4.11. A representative system suitability chromatogram is given in fig. 4.
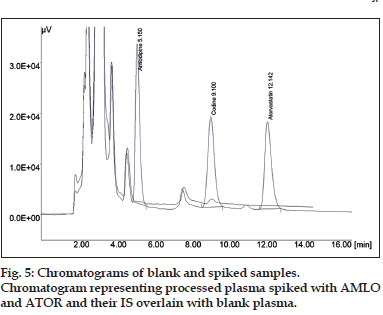
The protein precipitation was the preferred choice of extraction of drugs from biological fluids because of the minimized steps in extraction and less cost involved in the extraction process. It provides maximum number of plasma protein interferences; hence, it may provide maximum chances to develop more robust HPLC method. The method was attempted using cold aq. solution of 10% TCA and ACN. Several trials were taken to minimize matrix effect with different combinations of precipitating agents. Recovery of AMLO, ATOR and its IS was less than 50% when precipitation of plasma protein was done with TCA alone, therefore, acetonitrile was taken as organic partner of TCA as precipitating agent. The pH of precipitating media was below 3.0 due to TCA, which helps to keep all analytes in unionized state. Chromatogram in fig. 5 representing processed plasma spiked with sample overlain with blank plasma. At the end of precipitation supernatant was mixed with equal volume of 0.1% phosphoric acid (~pH 3.0) of mobile phase to make the sample more compatible with the developed method and to reduce peak tailing. The % mean recoveries for all the analyte were ranging from 90-95% in the developed method.
The developed method was validated for its specificity, sensitivity, calibration range, recovery, precision and accuracy and stability as per bioanalytical method validation guidelines suggested by USFDA and EMEA.
The specificity of optimized bioanalytical HPLC method was evaluated by observing interference due to matrix and commonly prescribed medication in cardiovascular disease. While accessing specificity, interference due to blank was observed very close to AMLO peak with resolution less than 2.0. A small interference was also observed at the retention time of CODN. The peak area of interference due to matrix was less than 5% of concentration taken for CODN as Internal standards; therefore, no change was made in HPLC conditions. Concentrations down to the LLOQ were detected with acceptable accuracy and precision using this method (%CV <15%). The mean background response of blank was found to be less than 20% of the response at the Limit of Quantification. The mean background was also calculated and found to be 13.9% (AMLO), 4.98% (CODN) and 12.6% (ATOR) in selected conditions. Aside that, mean background interferences at the retention of all internal standards (% background interference less than 5%) were also in limits. The method has been successful in determining the three drugs in concentrations as low as 0.1 μg/ml for ATOR, whereas 0.05 μg/ml for AMLO with acceptable precision and accuracy.
| System suitability parameter | USP limit | AMLO | ATV |
|---|---|---|---|
| Retention time | - | 5.150 | 12.143 |
| %RSD of Rt | - | 1.4708 | 0.8537 |
| Resolution | - | 6.34 | |
| %RSD of peak area (n=6) | ≤2.0 | 1.7455 | 1.6674 |
| Peak asymmetry at 10% peak height | ≤1.5 | 1.2113 | 0.9812 |
| Capacity factor (k’) | 0.5–20 | 6.200 | 13.214 |
| Mean number of theoretical plates | ≥2000 | 2391.0 | 3870.6 |
Table 1: System suitability studies for Resolution solution.
The standard curve was determined on each day of the 6-day validation, the slope, the intercept and the correlation coefficient was determined. The “goodness of fit” was applied for mean±SD for each analyte for its calibration range. Different weighing scheme i.e. 1/X and 1/X2 were applied to calculate the slope and intercept. The % bias in recovery calculation at LLOQ level was least (<15%) for unweighted and weighted calibration curve when a weight of 1/X and 1/X2 was applied. By examining the calibration curves it was concluded that the relationship between area ratio and concentration was linear for unweighted calibration curve. The results of unweighted calibration curve and mean % relative error at LLOQ is tabulated in Table 2. Mean relative error was less than 15% for AMLO and ATOR under all weighing as well as unweighing schemes. Therefore, unweighing scheme was chosen to reduce the complexity of calculations.
The values obtained, during the six-day validation period, for plasma intraday and interday precision and accuracy are summarized in Table 3. All values of accuracy and precision where within recommended limits. Intraday precision ranged from 1.04 to 7.75% whereas the interday precision was from 1.38 to 14.09%. The intraday mean error was from -1.98% to 9.5% whereas the interday mean relative error (%) was from -2.88−10.82%.
The extraction recovery was calculated at LLOQ, QC samples, ULOQ level (n=6). AMLO and ATOR have lowest recovery (<50.35%) when 10% cold aqueous solution of TCA alone was used as precipitating agent. The recoveries of AMLO and ATOR ranged from 47.7 to 61.9% in TCA solution whereas, the recoveries were ranging from 59.85 to 81.26% in ACN at test concentration level (i.e.10 μg/ml). Comparatively higher recoveries (>90.0%) were to be expected as high solubility of selected analytes in organic solvents. Addition of mobile phase in equal volume to the supernatant, made supernatant more compatible to the chroamtograph. Therefore, combination of TCA and ACN was taken as final precipitating media and data for mean % recovery in finally optimized protein precipitation method are given in Table 4.
| Nameof drug | Calibration range(in ng/ml) | Curve (%MRELLOQ) | ||
|---|---|---|---|---|
| Unweighted linearity | 1/X weightedlinearity | 1/X2 weightedlinearity | ||
| AMLO | 25–10,000 | 5.6 | 11.31 | 10.25 |
| ATOR | 10–10,000 | 10.56 | 13.43 | 12.36 |
Table 2: Comparison Of Recovery Errors For Different Calibration Curves.
| Nominal concentration | Precision (%CV) | Accuracy (%MRE) | |||
|---|---|---|---|---|---|
| in µg/ml | Intraday | Interday | Intraday | Interday | |
| AMLO | |||||
| 0.05 (LLOQ) | 5.60 | 2.5 | −1.98 | −5.68 | |
| 0.2 | (LQC) | 1.20 | 3.43 | −2.78 | −4.9 |
| 1.0 | (MQC) | 0.93 | 1.38 | −3.86 | −5.15 |
| 7.0 | (HQC) | 1.89 | 2.96 | −3.4 | −2.88 |
| 10.0 (ULOQ) | 2.45 | 3.69 | −2.65 | −6.64 | |
| ATOR | |||||
| 0.1 | (LLOQ) | 7.75 | 14.09 | −5.58 | −7.22 |
| 0.3 | (LQC) | 2.74 | 3.3 | 2.72 | −10.82 |
| 1.0 | (MQC) | 1.25 | 2.34 | −4.82 | −4.73 |
| 7.0 | (HQC) | 3.34 | 3.78 | 3.77 | 4.34 |
| 10.0 (ULOQ) | 2.98 | 1.95 | 2.49 | 5.65 | |
Table 3: Interday precision and accuracy data For assays.
Stock solution of AMLO, ATOR and IS were stable at room temperature for 24 h and at 2–8º for 48 h. AMLO and ATOR analytes in control rat plasma at room temperature were stable at least for 24 h and for minimum of three freeze and thaw cycles. Spiked plasma samples, stored at −20º for long term stability experiment, were stable for minimum of 45 days. Different stability experiments in plasma with values for precision and percent change are shown in Table 5.
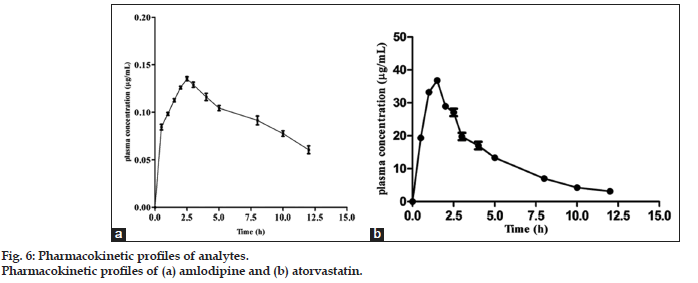
The proposed HPLC method enables a rapid assay of the AMLO and ATOR in rat plasma in a single run. The method described above was applied to study pharmacokinetics in six SD rats after an oral administration of the mixture of AMLO and ATOR. The mean plasma concentration–time profiles of AMLO and ATOR after an oral administration are shown in fig. 6a and b, respectively. The concentration–time data were analyzed by using non-compartmental analysis of pharmacokinetic add-in provided in Microsoft excel®.
| Concentration | %MRE for AMLO (n=6) | %MRE for ATOR (n=6) |
|---|---|---|
| LLOQ | 90.92±8.39 | 92.22±9.98 |
| LQC | 91.92±4.25 | 89.46±2.97 |
| MQC | 92.99±1.89 | 95.24±2.12 |
| HQC | 94.41±3.89 | 95.26±3.56 |
| ULOQ | 93.59±5.36 | 92.08±2.54 |
| Mean±SD | 93.37±2.21 | 92.85±2.44 |
Table 4: Percentage Of Mean Recoveries For Analytes In Finally Optimized Method.
| Stability | Percentage of mean change | ||
|---|---|---|---|
| ASP | CLOPI | ATOR | |
| Bench top | |||
| Room temperature (24 h) | |||
| LQC | 2.0 | 4.25 | 0.61 |
| HQC | 1.1 | −0.18 | 3.19 |
| Freeze and thaw | |||
| After 3rd cycle at 20° | |||
| LQC | 2.3 | 6.23 | 7.49 |
| HQC | 1.2 | −2.51 | 5.13 |
| Long term stability | |||
| 45 days at - 20° | |||
| LQC | 3.0 | 5.91 | −2.42 |
| HQC | 0.4 | 0.95 | −2.01 |
Table 5: Stability Of Analytes At Low Quality Control And High Quality Control Level.
| Pharmacokinetic parameter* | AMLO | ATOR |
|---|---|---|
| Cmax (in µg/ml) | 0.137±0.02 | 35.1±2.4 |
| Tmax (in h) | 2.5±1.1 | 0.9±0.6 |
| Mean AUC0-t (μg h/ml) | 0.714±0.17 | 221.0±18.14 |
| Mean AUC (μg h/ml) | 0.737±0.025 | 238.17±9.86 |
Table 6: Pharmacokinetic Study Results.
The maximum plasma concentration (Cmax) and the time to reach Cmax (Tmax) were obtained directly from the concentration–time data. Area under the plasma concentration–time curve (AUC) from time zero to the last samplingtime (AUC0−τ) was calculated by the trapezoidal rule. AUC0−∞ was estimated by the combination of AUC0−τ and AUCτ−∞, where AUCτ−∞ was calculated by dividing the last plasma concentration value by the elimination rate constant. The pharmacokinetic parameters are shown in Table 6, which were indicating the applicability of this method to the pharmacokinetic study of AMLO and ATOR. Furthermore, the method was shown to be highly reproducible and can be considered valuable for rapid and reliable preclinical and pharmacokinetic studies of the ATOR and AMLO.
Acknowledgements
We are also thankful to our postgraduate students for performing the survey for summarizing the need of this method.
Financial support and sponsorship
The authors are thankful to BCUD, University of Pune for providing fund for this research (Grant no.: 13PHM000692).
Conflicts of interest
There are no conflicts of interest.
References
- Budavari S. The Merck Index. 12th ed. White House Station (New Jersey): Merck and Co., Inc.; 1996. p. 86.
- Lacourcière Y, Poirier L, Lefebvre J, Archambault F, Cléroux J, Boileau G. Antihypertensive effects of amlodipine and hydrochlorothiazide in elderly patients with ambulatory hypertension. Am J Hypertens 1995;8(12 Pt 1):1154-9.
- Krum H. Critical assessment of calcium antagonists. AustFam Physician 1997;26:841-5, 847-8.
- Budavari S. The Merck Index. 12th ed. White House Station (New Jersey): Merck and Co., Inc.; 1996. p. 146.
- Reynolds EF, Dale M. The Extra Pharmacopoeia. 31st ed. London (Britain): Royal Pharmaceutical Society; 1996. p.1302.
- Long AN, Dagogo-Jack S. Comorbidities of diabetes and hypertension: Mechanisms and approach to target organ protection. J ClinHypertens (Greenwich) 2011;13:244-51.
- Devabhaktuni M, Bangalore S. Fixed combination of amlodipine and atorvastatin in cardiovascular risk management: Patient perspectives. Vasc Health Risk Manag 2009;5:377-87.
- Heart Protection Study Collaborative Group. MRC/BHF Heart protection study of cholesterol lowering with simvastatin in 20, 536 high-risk individuals: A randomised placebo-controlled trial. Lancet 2002;360:7-22.
- Sever PS, Dahlöf B, Poulter NR, Wedel H, Beevers G, Caulfield M, et al. Prevention of coronary and stroke events with atorvastatin in hypertensive patients who have average or lower-than-average cholesterol concentrations, in the anglo-scandinavian cardiac outcomes trial – Lipid lowering arm (ASCOT-LLA): A multicentre randomised controlled trial. Lancet 2003;361:1149-58.
- Turnbull F; Blood Pressure Lowering Treatment Trialists’ Collaboration. Effects of different blood-pressure-lowering regimens on major cardiovascular events: Results of prospectively-designed overviews of randomised trials. Lancet 2003;362:1527-35.
- Monkman SC, Ellis JS, Cholerton S, Thomason JM, Seymour RA, Idle JR. Automated gas chromatographic assay for amlodipine in plasma and gingival crevicular fluid. J Chromatogr B Biomed Appl 1996;678:360-4.
- Tatar S, Atmaca S. Determination of amlodipine in human plasma by high-performance liquid chromatography with fluorescence detection. J Chromatogr B Biomed SciAppl 2001;758:305-10.
- Bahrami G, Mirzaeei SH. Simple and rapid HPLC method for determination of amlodipine in human serum with fluorescence detection and its use in pharmacokinetic studies. J Pharm Biomed Anal 2004;36:163-8.
- Meyyanathan SN, Muralidharan S, Rajan S, Gopal K, Suresh B. A simple sample preparation with HPLC–UV method for estimation of amlodipine from plasma: Application to bioequivalence study. Open Chem Biomed Methods J 2008;1:22-7.
- Zhang Z, Wang D, Zhang L, Du M, Chen G. Determination of diuretics in human urine by hollow fiber-based liquid-liquid-liquid microextraction coupled to high performance liquid chromatography. Analyst 2008;133:1187-94.
- Pandya KK, satia M, Gandhi TP, Modi IA, Modi RI, Chakravarthy BK. Detection and determination of total amlodipine by high-performance thin-layer chromatography: A useful technique for pharmacokinetic studies. J Chromatogr B Biomed Appl 1995;667:315-20.
- Mikus P, Marakova K, Marak J, Nemec I, Valaskova I, Havranek E. Direct quantitative determination of amlodipine enantiomers in urine samples for pharmacokinetic study using on-line coupled isotachophoresis-capillary zone electrophoresis separation method with diode array detection. J Chromatogr B Biomed Appl 2008;875:266-72.
- Matalka K, El-Thaher T, Saleem M, Arafat T, Jehanli A, Badwan A.Enzyme linked immunosorbent assay for determination of amlodipine in plasma. J Clin Lab Anal 2001;15:47-53.
- Altiokka G, Altiokka M. Flow injection analysis of amlodipine using UV-detection. Pharmazie 2002;57:500.
- Quaglia MG, Barbato F, Fanali S, Santucci E, Donati E, Carafa M, et al. Direct determination by capillary electrophoresis of cardiovascular drugs, previously included in liposomes. J Pharm Biomed Anal 2005;37:73-9.
- Goyal RN, Bishnoi S. Voltammetric determination of amlodipine besylate in human urine and pharmaceuticals. Bioelectrochemistry 2010;79:234-40.
- Zou Q, Zhan Y, Ge Z, Wei P, Ouyang P. Liquid chromatography-mass
- spectrometry method for the determination of amlodipine in human plasma and its application in a bioequivalence study. Arzneimittelforschung 2009;59:383-91.
- Feng Y, Zhang L, Shen Z, Pan F, Zhang Z. Analysis of amlodipine in human plasma by liquid chromatography-mass spectrometry. J ChromatogrSci 2002;40:49-53.
- Zhong D, Chen X, Gu J, Li X, Guo J. Applications of liquid chromatography-tandem mass spectrometry in drug and biomedical analyses. ClinChimActa 2001;313:147-50.
- Jamshidi A, Nateghi A. HPTLC determination of atorvastatin in plasma. Chromatographia 2007;65:763-6.
- Ma L, Dong J, Chen XJ, Wang GJ. Development and validation of atorvastatin by LC–ESI–MS and application in bioequivalence research in healthy Chinese volunteers. Chromatographia 2007;65:737-41.
- Bahrami G, Mohammadia B, Mirzaeei S, Kiani A. Determination of atorvastatin in human serum by reversed-phase high-performance liquid chromatography with UV detection. J Chromatogr B Biomed Appl 2005;826:41-5.
- Chaudhri BG, Patel NM, Shah PB. Simultaneous estimation of atorvastatin calcium and amlodipine besylate by HPTLC. Indian Drugs 2006;43:649-55.
- Shah DA, Bhatt KK, Mehta RS, Baldania SL, Gandhi TR. Stability indicating RP-HPLC estimation of atorvastatin calcium and amlodipine besylate in pharmaceutical formulations. Indian J Pharm Sci 2008;70:754-60.
- Pilli NR, Inamadugu JK, Mullangi R, Karra VK, Vaidya JR, Rao JV. Simultaneous determination of atorvastatin, amlodipine, ramipril and benazepril in human plasma by LC-MS/MS and its application to a human pharmacokinetic study. Biomed Chromatogr 2011;25:439-49.
- Zhou Y, Li J, He X, Jia M, Liu M, Li H, et al. Development and validation of a liquid chromatography-tandem mass spectrometry method for simultaneous determination of amlodipine, atorvastatin and its metabolites ortho-hydroxy atorvastatin and para-hydroxy atorvastatin in human plasma and its application in a bioequivalence study. J Pharm Biomed Anal 2013;83:101-7.
- Yacoub M, Awwad AA, Alawi M, Arafat T. Simultaneous determination of amlodipine and atorvastatin with its metabolites; ortho and parahydroxy atorvastatin; in human plasma by LC–MS/MS. J Chromatogr B Biomed Appl 2013;917:36-47.
- Guidance for Industry. Bioanalytical Method Validation. Rockville, (MD): Centre for Drug Evaluation and Research (CDER) US Department of Health and Human Services, Food and Drug Administration; 2001.
- Guideline on Bioanalytical Method Validation. London (United Kingdom): Committee for Medicinal Products for Human Use, European Medicines Agency; 2011.
 ) and atorvastatin (----) showing optimum UV absorbance for both drugs at 240 nm.