- *Corresponding Author:
- Neelam Sharma
Chitkara College of Pharmacy, Chitkara University, Punjab, India
E-mail: neelam.mdu@gmail.com
| Date of Received | 01 September 2020 |
| Date of Revision | 07 April 2021 |
| Date of Acceptance | 20 November 2021 |
| Indian J Pharm Sci 2021;83(6):1229-1242 |
This is an open access article distributed under the terms of the Creative Commons Attribution-NonCommercial-ShareAlike 3.0 License, which allows others to remix, tweak, and build upon the work non-commercially, as long as the author is credited and the new creations are licensed under the identical terms
Abstract
The purpose of this research is to investigate the suitability of acquiring improved dissolution profile and sustained release of Fluvastatin sodium to reduce dosage frequency via a novel combination of freeze dried microspheres and Eudragit polymers-based matrix tablet technologies. Fluvastatin sodium microspheres were prepared using polyvinyl pyrollidone K-30 and Poloxamer 407 through solvent evaporation via freeze drying. We adopted a central composite design to examine the influence of independent variables viz. drug:polymer (X1) and surfactant (X2) on the t50 % (Y1), Q90 (Y2) and percentage drug content (Y3) along with determination of an optimized composition for production of an optimal Fluvastatin sodium microspheres. Design expert software illustrated that an optimized Fluvastatin sodium microspherescould be achieved using 1:3.496 drug:polymer and 3.102 % poloxamer 407 which would illustrates t50 % (36.33 min), Q90 (79.99 %) and percentage drug content (81.589 %). The mean diameter and polydispersity index of Fluvastatin sodium microspheres using dynamic light scattering was found 0.78 μm and 0.287, respectively. Sustained release tablet of optimized Fluvastatin sodium microspheres (Fluvastatin sodium microspheres-sustained release tablet) was manufactured using Eudragit RS 100 and Eudragit RL 100 based granules by wet granulation technique. In vitro drug release kinetics studies were executed to assess the drug release mechanism from optimized Fluvastatin sodium microspheres and Fluvastatin sodium microspheres-sustained release tablet. The dissolution level of Fluvastatin sodium was 3.58-fold improved wthin 2 h through the freeze dried microspheres. Fluvastatin sodium microspheres-sustained release tablet showed sustained drug release over 24 h and was matched properly to Korsmeyer-Peppas model with release exponent of 0.5318, which indicated drug release through diffusion and erosion mechanism. Conclusively, it has been demonstrated that novel combination of freeze dried microspheres and their Eudragit polymers-based matrix tablet techniques could find great potential for improving drug dissolution and sustained release of water insoluble drugs along with reduced dosage frequency.
Keywords
Microspheres, matrix tablet, central composite design, polyvinyl pyrollidone K-30, Poloxamer 407, Eudragit RS 100, Eudragit RL 100, Korsmeyer-Peppas
Oral route is generally viewed as the most comfortable and convenient route for medication. Absorption of oral dosage in the aqueous gastrointestinal fluid varies depending on their requisite solubility. It has been reported that approximately 40 % of existing and newly manufactured drug molecule undergo low solubility and dissolution characteristics. Due to their slow and constrained release into gastrointestinal fluid causing low oral bioavailability; poor water solubility of drugs has become one of the biggest concerns in pharmaceutical formulations [1,2]. Numerous approaches such as nano-suspensions [3], nano-structured lipid carriers [4] and solid dispersion [5] have been utilized for improving dissolution of Fluvastatin Sodium (FLS).
However, no attempt has been made for developing FLS microspheres; however microspheres have tremendous potential to augment the dissolution of class II drugs [6,7].
Since, FLS is Biopharmaceutical Classification System (BCS) class II drug having poor aqueous solubility and therefore reduced drug dissolution and low (24 %) oral bioavailability. Therefore, there is requisite of improving dissolution of FLS. Therefore, in present investigation, solvent-evaporation technique followed by freeze-drying has been utilized for production of Fluvastatin Sodium Microspheres (FLS-MS). It is an advanced solvent removal technology with tremendous prospective in the pharmaceutics for conversion of active pharmaceutical ingredient from the crystalline to amorphous form, production of microspheres with prompt hydration potential. In this process, moisture is removed from the product via sublimation as well as desorption phase [8]. The hydrophilic excipients i.e. Polyvinyl Pyrollidone K-30 (PVP K-30) and Poloxamer 407 has been used in microsphere production which plays an imperative function in enhancing drug’s wettability, dispersibility and dissolution [7]. PVP K-30 is a biocompatible hydrophilic amorphous polymer having low toxicity, high aqueous solubility, economic cost and physiological tolerance which has been recognized as safe by the Food and Drug Administration [9-11]. Poloxamer 407 is polyoxyethylene-polypropylene block copolymer nonionic surfactant that has good solubilizing capacity, low toxicity, good drug-release characteristics and can achieve the highest degree of dissolution enhancement [12]. Central Composite Design (CCD) was explored to execute the experimentation for microsphere production and for selection of an optimal composition of optimized FLS-MS for achieving the maximum percentage drug dissolution along with the least number of experiments [13].
Another shortcoming of FLS is short half-life (1-3 h) and oral dosage regimen of 40 mg capsule twice daily. Therefore, once-daily sustained-release tablet of FLS is desirable which could provide a more constant plasma concentration with improved patient compliance. In sustained-release technology, hydrophilic matrix materials i.e. Eudragit RS 100 (low permeability) and Eudragit RL 100 (high permeability) exhibiting pH independent swelling has been utilized for manufacturing of Sustained Release Tablet (SRT) of optimized FLS-MS (having improved dissolution) (FLS-MS-SRT) [14-17].
The aim of the present study was to explore novel combinations of freeze dried microspheres and their Eudragit polymers-based matrix tablet techniques in an attempt to improve drug dissolution and develop oncedaily sustained-release matrix tablet of optimized FLSMS, respectively.
Materials and Methods
Materials:
Fluvastatin sodium (CAS NO-93957-55-2) was provided by All Well Pharmaceuticals Company, Chandigarh, India. Polyvinyl pyrollidone K-30 was purchased from Loba Chemicals (Mumbai, India). Poloxamer 407 was obtained from Oniosome Healthcare Private Limited, Mohali, India. Evonik Industries AG-Mumbai (India) supplied Eudragit RL 100 and RS 100. All other chemicals were of analytical grade.
Central composite design layout for production of FLS-MS:
The 13 batches of FLS-MS were manufactured according to CCD layout given by Stat-Ease Inc Design Expert® Software (Version 11.0.4.0) for assessing the influence of two important factors-drug:polymer (X1) and surfactant (X2) on the t50 % (min) (Y1), Q90 (percent) (Y2) and drug content (percent) (Y3) along with determination of an optimized composition for production of an optimal FLS-MS (Table 1).
| Run number | Drug: polymer (w/w) (X1) | Surfactant (percent w/v) (X2) |
|---|---|---|
| 1 | -1 (1:2) | -1 (1) |
| 2 | 1 (1:4) | -1 (1) |
| 3 | -1 (1:2) | 1 (3) |
| 4 | 1 (1:4) | 1 (3) |
| 5 | -1.41 (1:1.59) | 0 (2) |
| 6 | 1.41 (1:4.41) | 0 (2) |
| 7 | 0 (1:3) | -1.41 (0.59) |
| 8 | 0 (1:3) | 1.41 (3.41) |
| 9 | 0 (1:3) | 0 (2) |
| 10 | 0 (1:3) | 0 (2) |
| 11 | 0 (1:3) | 0 (2) |
| 12 | 0 (1:3) | 0 (2) |
| 13 | 0 (1:3) | 0 (2) |
Table 1: Central Composite Designed Fluvastatin Sodium Microspheres
Preparation of FLS-loaded solvent-evaporated microspheres:
FLS-MS were fabricated by solvent evaporation technique followed by freeze drying. Briefly, accurately weighed quantity of FLS was dissolved in acetone (10 ml) while PVP K-30 and Poloxamer 407 were dissolved in distilled water (20 ml). The organic phase was transferred slowly into aqueous phase while continuous magnetic stirring at 1500 rpm for 45 min to remove organic solvent. Subsequently, samples were lyophilized in freeze dryer (Allied Frost, New Delhi) at -70o and 0.05 kPa vacuum for 24 h to acquire fine FLSMS powder. Subsequently, microspheres desiccated for 48 h to eliminate the remaining moisture [8,18-20].
Evaluation of response parameters for Fluvastatin sodium microspheres:
Determination of t50 % (Y1) and Q90 (Y2): In vitro FLS release from FLS-MSs was examined using United States Pharmacopeia (USP) dissolution apparatus (type II) (Lab India, Mumbai) (900 ml phosphate buffer pH 6.8, 100 rpm at 37°, n=3). Samples were collected at specified intervals and quantities of the drugs were analyzed using Systronics ultraviolet spectrophotometer (Model: AU-2701) (Fluvastatin sodium λ=300 nm). From in vitro drug release graph plotted between Percentage Cumulative Drug Release (% CDR) and time (min), t50 % which corresponds to the time taken for fifty percent CDR and Q90 which correspond to the percentage CDR within 90 min were determined [21].
Determination of percentage drug content (Y3):
Accurate quantity of FLS-MS (10 mg FLS) was dissolved in 10 ml phosphate buffer (pH 6.8), analyzed through spectrophotometer and percentage drug content was determined using following equation [22]:
Percentage drug content=(Actual amount of Fluvastatin sodium)/(Theoretical amount of Fluvastatin sodium)×100
Statistical, diagnostic and response surface analysis of experimental data by design-expert software:
Using Design expert software, fit summary statistics was applied in order to select the appropriate model out of linear, 2-Factor Interaction (2FI), quadratic and cubic models. The model which has highest R2 value was applied for further analysis. Analysis of Variance (ANOVA) was performed to determine F-value and p-value for selected model, X1, X2, X1X2, X12, X22 to find out significant independent parameters which affect response variables (p<0.05). The quadratic equations for Y1, Y2 and Y3 were developed to estimate main, interaction as well as quadratic influences of factors on responses. Diagnostic plots were developed by Design- Expert software to investigate the goodness of fit of proposed model. Three-dimensional response surface graphs as well as corresponding two-dimensional contour graphs were developed using the Design-Expert software model graph tool to bestow graphical display of influence of independent variables on dependent parameters [23-25].
Graphical optimization and validation of optimized FLS-MS:
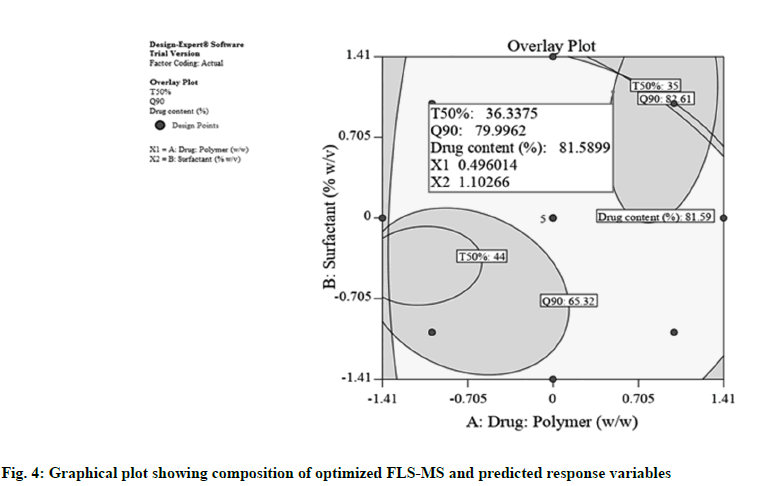
An overlay plot was developed using graphical optimization tool in Design-Expert software to acquire graphical view displaying optimum values of independent factors (coded values of X1 and X2) and predicted response variable (Y1, Y2 and Y3). To validate the graphical optimization, an additional experimental batch of FLS-MS was manufactuted using optimal variables values and in vitro dissolution was performed for estimating t50 % (Y1) and Q90 (Y2) and percentage drug content (Y3). For fullfilling the validation strategy, the experimental values of response variables should be in close agreement with software predicted values [13].
Characterization of optimized FLS-MS:
Fourier-transform infrared spectroscopy (FTIR): FTIR spectra of FLS, PVP K-30, Poloxamer 407, drugpolymers Physical Mixture (PM) and FLS-MS were obtained using FTIR spectrometer (Bruker, Model: Alpha-T, software: OPUS) to confirm drug-polymer compatibility and entrapment of FLS in microspheres. The sample prepared using potassium bromide by hydraulic press method was analyzed from 4000 to 400 cm-1.
Powder X-Ray Diffraction (PXRD) analysis: The PXRD patterns of FLS, PVP K-30, Poloxamer 407, PM and optimized FLS-MS were obtained using XPERTPRO x-ray diffractometer. The samples were scanned at 2θ angle over 5-50° at 40 mA and 45 kV using Copper K-Alpha (CuK-α) (1.54 Ao) and CuK-bBeta (β) (1.39 Ao) radiations.
Dynamic light scattering: Mean diameter and Polydispersity Index (PDI) for particle size distributions of optimized FLS-MS were estimated by dynamic light scattering technique using Beckman Coulter, Version 3.73/2.30 (USA). In brief, 20 mg of FLS-MS was dispersed in 2 ml of distilled water in quartz cuvette and measurements were carried out at 25o.
Scanning Electron Microscopy (SEM): The morphological properties and shape of freeze dried optimized FLS-MS was recorded using Jeol JSM6100 (Japan). Sample was located on aluminium stub utilizing double-sided adhesive tape and examined at 1.4 kV subsequent to 20 nm gold films coating through sputtering.
Preparation of FLS-MS-SRT:
Eudragit based granules were prepared using mixture of lactose, Eudragit RS 100, Eudragit RL 100 and magnesium stearate. The powder blend was granulated using polyvinyl alcohol binder solution in ethanol:water (20:80) to produce wet mass which was screened through #44 sieves and dried to obtain uniform size granules. Finally, Eudragit based granules, FLS-MS and talc were blended and compressed into tablets (600±10 mg) using single punch tablet press (AK industries, Nakodar) [16,26-28].
In vitro drug release profile and release kinetics (FLS-MS vs. FLS-MS-SRT):
The in vitro drug release from FLS, PM, FLS-MS and matrix tablets (FLS-MS-SRT) was investigated using USP paddle dissolution equipment as described previously. To explore the drug release process, data were incorporated into zero order, first order, Higuchi model as well as Korsmeyer-Peppas model. The release constant (K) and regression coefficient values (r2) were calculated for all the models. Drug release mechanism from FLS-MS and FLS-MS-SRT was explored using release exponent value (n) acquired from Korsmeyer- Peppas model [27,29].
Statistical analysis:
All the experiments were performed in triplicate and results were expressed as mean±SEM (n=3). The experimental design analysis was implemented by Design-Expert software. All other data were statistically analyzed using GraphPad Prism version 6.01 (SanDiego, CA). Data were analyzed by analysis of variance Bonferroni post hoc test. The p<0.05 was considered statistically significant.
Results and Discussion
A total 13 formulations of FLS-MS were synthesized in accordance with CCD in order to optimize X1 (drug:polymer) and X2 (surfactant). The t50 % (min) (Y1), Q90 (percent) (Y2) and drug content (percent) (Y3). The findings from this research design indicate that drug:polymer (X1) and surfactant (X2) greatly affected FLS-MS. For the quadratic models, the superlative fit for t50 % (Y1), Q90 (Y2) and percentage drug content (Y3) was observed owing to its highest r2 in contrast to linear, Two Factor Interaction (2- FI) and cubic models [25,30] (Table 2). Hence, the quadratic approach was developed to identify the effects of variables on response parameters as shown:Yi=b0+b1X1+b2X2+b12X1X2+b12X12+b22X22
| Models | r2 | Adjusted r2 | Predicted r2 | Remarks |
|---|---|---|---|---|
| Response Y1 (t50 %) | ||||
| Linear | 0.5965 | 0.5158 | 0.3296 | |
| 2-FI | 0.5986 | 0.4648 | 0.1790 | |
| Quadratic | 0.9792 | 0.9644 | 0.9071 | Suggested |
| Cubic | 0.9856 | 0.9654 | 0.6970 | |
| Response Y2 (Q90) | ||||
| Linear | 0.7388 | 0.6865 | 0.5653 | |
| 2-FI | 0.7512 | 0.6683 | 0.4808 | |
| Quadratic | 0.9692 | 0.9472 | 0.8150 | Suggested |
| Cubic | 0.9886 | 0.9727 | 0.6546 | |
| Response Y3 (Percentage drug content) | ||||
| Linear | 0.7117 | 0.6540 | 0.4782 | |
| 2-FI | 0.7199 | 0.6265 | 0.2154 | |
| Quadratic | 0.9623 | 0.9354 | 0.8022 | Suggested |
| Cubic | 0.9629 | 0.9110 | -0.5841 | |
Table 2: Summary Of Model Fit Study For Response Parameters
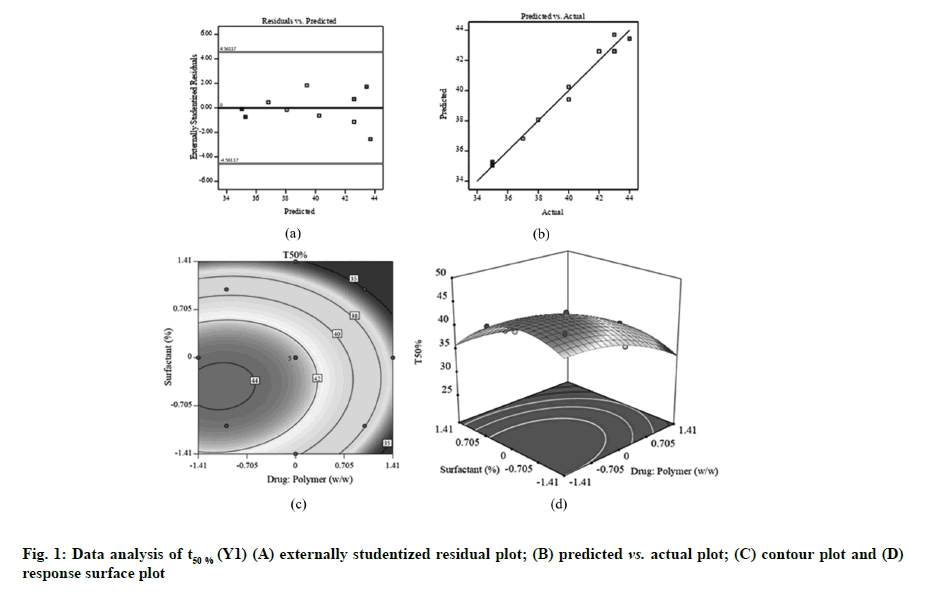
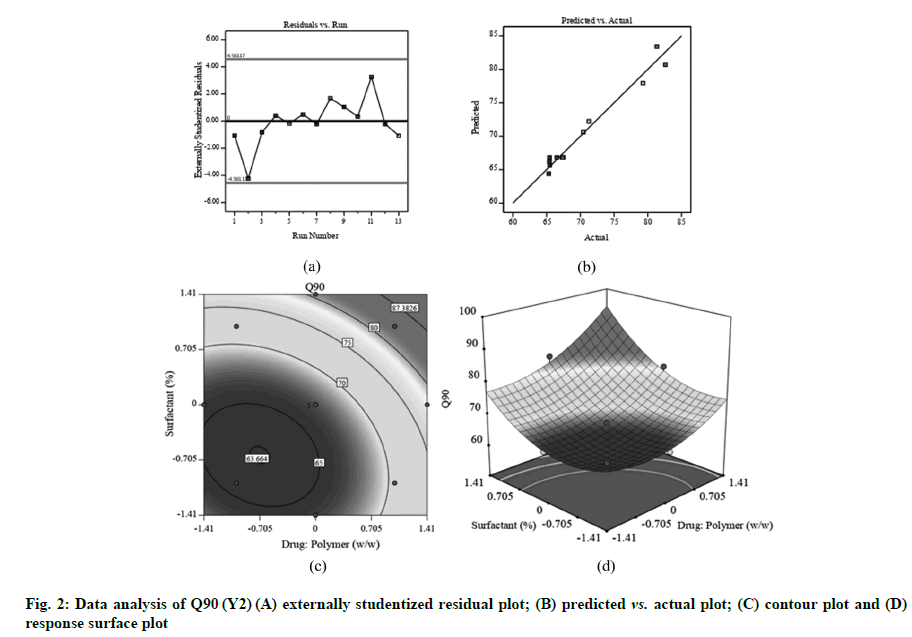
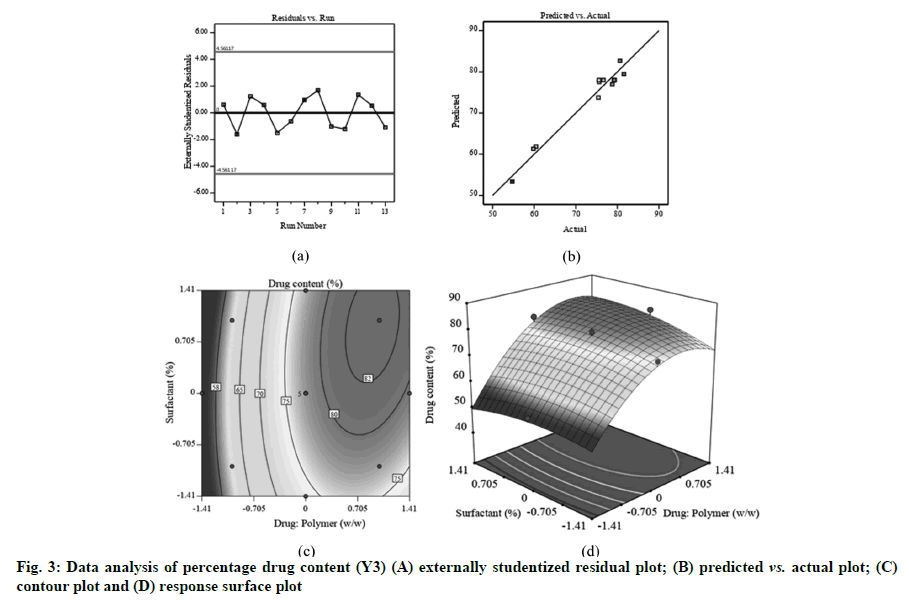
Fig. 1A, fig. 2A and fig. 3A displayed externally studentized residuals against the predicted values of response variables which showed that the points referring to response variables i.e. Y1, Y2 and Y3 were adjacent to the zero-axis suggesting no consistent bias. Predicted versus actual data graph depicted in fig. 1B, fig. 2B and fig. 3B showed a significant linear curve running through the origin, which confirmed that response parameters were conjunctiva with predicted value [23,24].
The two dimensional (contour) and three dimensional (response surface) plots for Y1-Y3 are presented in fig. 1-fig.3 to illustrate the influence of independent variables on Y1 (t50 %), Y2 (Q90) and Y3 (percentage drug content). The findings obtained in this study suggested that independent factors influencing t50 % were drug:polymer (X1), surfactant (X2), X12 and X22 (p<0.05) (Table 3). The quantitative assessment of the important models showed that drug: polymer (X1) and surfactant (X2) had the foremost antagonistic effect on t50 % of FLS-MS, implying that accelerating X1 and X2 values in composition reduces the t50 %. This signified that addition of higher amounts of PVP K-30 and Poloxamer 407 to FLS-MS significantly enhances the drug dissolution profile as indicated by decreased t50 % value. The following regression equation represented a fitted model for t50 %.
| Source | DF | Sum of squares | Mean square | F-value | p-value |
|---|---|---|---|---|---|
| Model for Y1 | 5 | 118.56 | 23.71 | 65.94 | <0.0001* |
| X1 | 1 | 47.48 | 47.48 | 132.03 | <0.0001* |
| X2 | 1 | 24.75 | 24.75 | 68.82 | <0.0001* |
| X1X2 | 1 | 0.2500 | 0.2500 | 0.6952 | 0.4319 |
| X12 | 1 | 9.53 | 9.53 | 26.51 | 0.0013* |
| X22 | 1 | 40.83 | 40.83 | 113.55 | <0.0001* |
| Model for Y2 | 5 | 475.62 | 95.12 | 44.07 | <0.0001* |
| X1 | 1 | 150.84 | 150.84 | 69.88 | <0.0001* |
| X2 | 1 | 211.70 | 211.70 | 98.08 | <0.0001* |
| X1X2 | 1 | 6.10 | 6.10 | 2.83 | 0.1366 |
| X12 | 1 | 43.46 | 43.46 | 20.13 | 0.0028* |
| X22 | 1 | 76.48 | 76.48 | 35.43 | 0.0006* |
| Model for Y3 | 5 | 939.92 | 187.98 | 35.75 | <0.0001* |
| X1 | 1 | 684.70 | 684.70 | 130.21 | <0.0001* |
| X2 | 1 | 10.39 | 10.39 | 1.98 | 0.2026 |
| X1X2 | 1 | 8.01 | 8.01 | 1.52 | 0.2570 |
| X12 | 1 | 234.44 | 234.44 | 44.59 | 0.0003* |
| X22 | 1 | 12.12 | 12.12 | 2.31 | 0.1727 |
Note: *p<0.05
Table 3: Anova For Y1 (T50 %), Y2 (Q90) And Y3 (% Drug Content)
Y1=42.6-2.44X1-1.76X2+0.25X1X2-1.18X12- 2.43X22
The perfect fit design for t50% was quadratic (r2=0.9792) (Table 2). As anticipated, fig. 1C and fig. 1D showed that t50 % of FLS-MS was antagonized by significantly increasing the two factors. The F-values and related p-values for response parameters are summarized in Table 3. A model was considered significant if p<0.05. A negative value in quadratic equation indicates an inverse relationship or antagonistic effect between the factor and the response while a positive value in the regression equation exhibits an effect that favors the optimization due to synergistic effect. A negative sign in quadratic formula implies a negative correlation or antagonistic action whilst the positive value in regression model demonstrates synergistic effect of factors on response variables [31,32]. This might be linked to the fact that PVP K-30 and Poloxamer 407 have solubilizing effect on hydrophobic drug particles due to their characteristics of decreasing surface tension and increasing wettability and dispersibility. Therefore, PVP K-30 and Poloxamer 407 helps to improve the dissolution profile of FLS which decreases the t50 % value [12,29].
Following equation can explain the effect of factors levels on Q90:
Y2:66.82+4.35X1+5.15X2+1.24X1X2+2.51X12 +3.33X22
Good correlation among adjusted and predicted value had been shown by r2 of 0.9692 (Table 2). Q90 (Y2) was dramatically influenced with X1, X2, X12 and X22 (p<0.05). The positive regression coefficient showed that rise in the drug:polymer (X1) could result in a substantial boost in the percentage of drug release which could be correlated to the PVP K-30 and Poloxamer 407 solubilizing action [12,29]. The Q90 pattern is progressively rising to its highest point (region of plot pointing upwards) (fig. 2C and fig. 2D).
The percentage drug content is an incredibly vital consideration for any formulation. As specified in Table 3, main and quadratic effect of drug:polymer has statistically substantial influence on percentage drug content which could be expressed through following regression equation:
Y3=78.01+9.27X1+1.14X2+1.42X1X2-5.83X12- 1.33X22
With an increase in drug:polymer (X1), there was an increasing trend in the values of percentage drug content that might be due to higher quantity of polymer accessible to hold enormous quantity of drugs [33] (fig. 3C and fig. 3D). Drug:polymer showed significant positive effect on X3 as indicated by the large F-value (130.21) (Table 3) and positive coefficient value (b1=9.27).
Graphical plot shown in fig. 4 was obtained using software optimization process which illustrated that the suggested coded levels for X1 and X2 were 0.496 (actual value: 1:3.496) and 1.102 (actual value: 3.102 %), correspondingly which provides 36.33 min, 79.99 % and 81.589 % theoretical value for t50 %, Q90 and drug content, respectively. An additional batch of FLSMS was produced with optimal amount of X1 and X2. The experiential t50 %, Q90 and percentage drug content for formulated batch were estimated 32 min, 83.9 % and 84.6 %, respectively, which concurred intimately with the theoretical values [13].
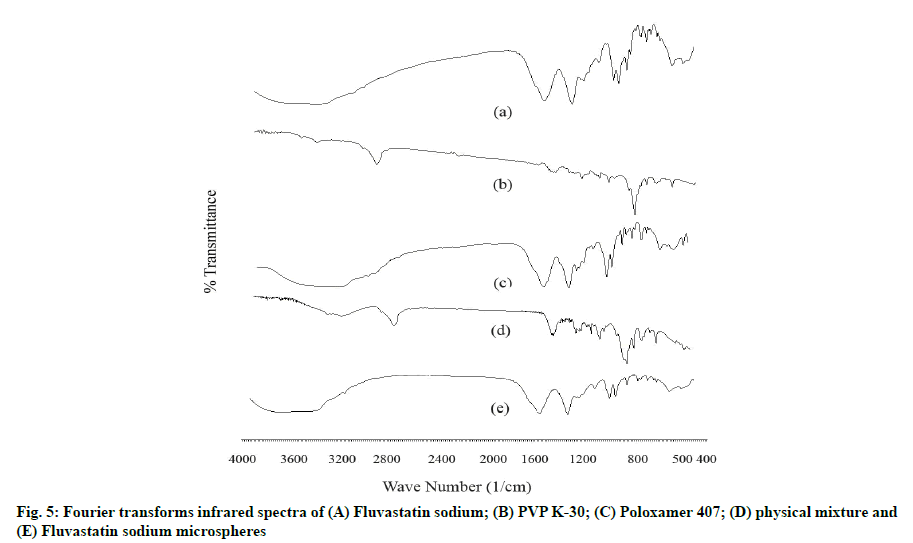
The FTIR spectrum of pure FLS displayed characteristic peaks at 3182, 1602, 1400, 1074, 918, and 882 cm-1 corresponding to O-H stretch (s) of alcohol, C=O (s), aromatic C=C bending (b), C-F (s), =C-H (b) of alkene and aromatic C-H (b), respectively. PVP K-30 spectrum gives peaks at 2971, 1343, 1145, 1670 and 842 cm-1 related to C-H (s), C-H (b), C-N (s), C=O (s) and aromatic C-H (b) groups. Poloxamer 407 FTIR spectra showed characteristic peaks at 3209, 1400, 1110 and 1073 cm-1 comparable to alcohol O-H (s), C-H (b), C-O-C (s) and alcohol C-O (s). Important functional groups peaks of drug and polymers remained intact in spectra of physical mixture. The FTIR spectra of optimized FLS-MS revealed neither appearance of extra peaks nor disappearance of essential distinctive peaks of FLS which established incorporation of drug in microspheres formulation [9,12] (fig. 5).
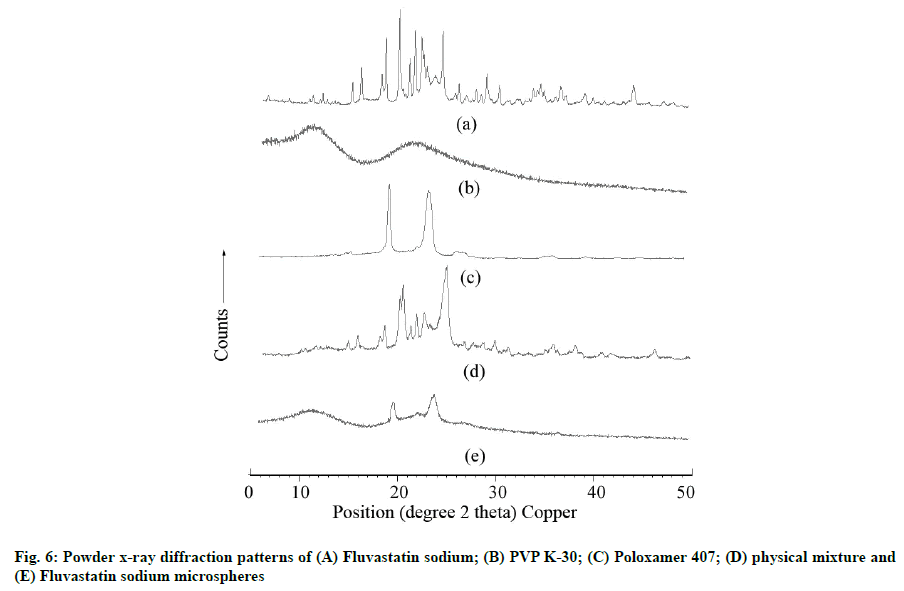
The PXRD pattern of FLS, PVP K-30, Poloxamer 407, PM and optimized FLS-MS are shown in fig. 6. The abundant diffraction peaks of FLS were observed at 4.67, 6.08, 9.15, 10.27, 11.85, 13.75, 14.71, 16.92, 17.37, 18.84, 19.93, 20.51, 21.24, 22.66, 23.49, 24.82, 25.22, 26.03, 27.58, 28.24, 29.56, 30.53, 31.53, 32.43, 33.23, 34.4, 35.03, 36.7, 38.72, 39.65, 40.86, 41.79, 42.98, 44.01, 45.44, 47.28, 48.24, and 49.17 at o2θ scale which indicated extremely crystalline nature of drug. The absence of peaks in PXRD of PVP K-30 revealed its enormously amorphous characteristics. PXRD of Poloxamer 407 illustrated various peaks at 19.17, 22.69, 23.35, 26.19, 30.8, 32.72, 35.35, 36.19, 39.64, 43.08 and 45.25 at o2θ scale which suggested its semi-crystalline character. PXRD of PM showed the occurrence of several peaks corresponding to FLS and Poloxamer 407 which established drug-polymers compatibility. The diffraction peaks of FLS nearly disappeared in PXRD patterns of optimized FLSMS, reflecting drug amorphization that could have been through lyophilization applied during FLS-MS production [9,12].
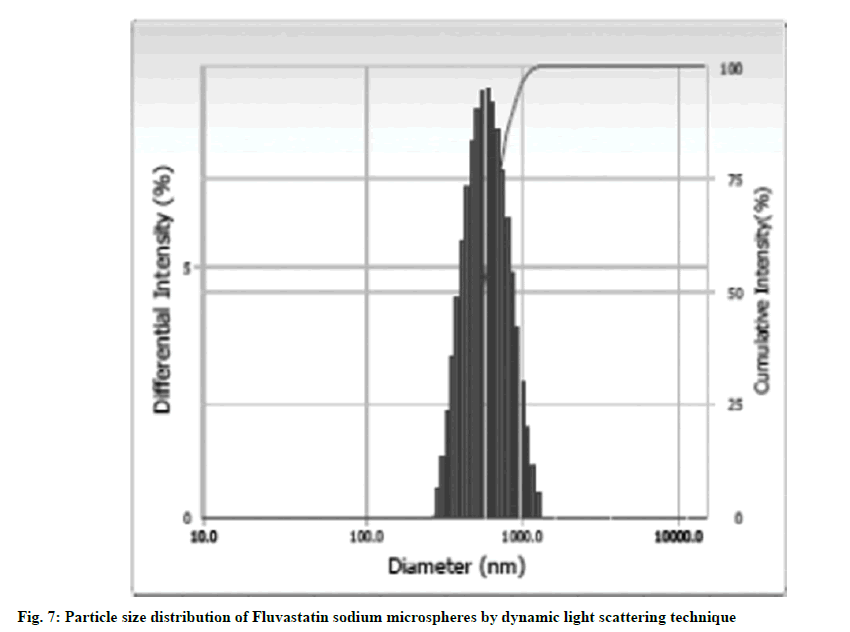
The mean diameter and PDI of FLS-MS using dynamic light scattering was found 0.78 μm and 0.287, respectively which revealed that produced microspheres have smaller size in micrometric range and superior degree of homogeneity as indicated by small PDI value (fig. 7). The smaller diameter of FLS-MS could be attributable to Poloxamer 407 which lowers surface tension at the particles interfaces and thereby providing a shielding barrier which obstructs microspheres aggregation to synthesize smaller size microspheres having uniform particle size distribution [34].
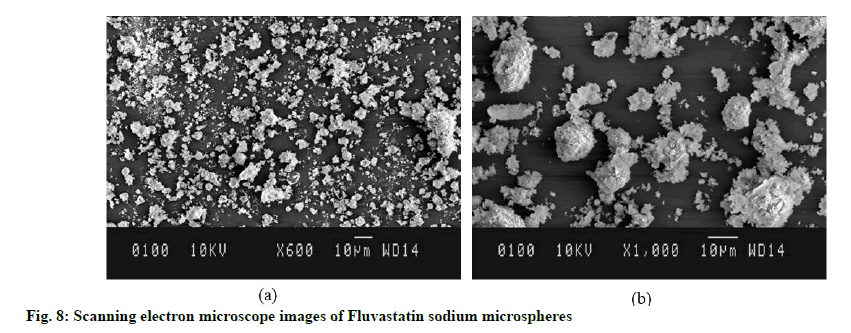
SEM observed the morphological features of FLSMS and illustrated spherical shape as well as porous rough exterior morphology of microspheres (fig. 8). The surface of FLS-MS was coarse with homogeneous micropores which could be attributed to hydrophilic nature of PVP K-30 and Poloxamer 407 which leached out during lyophilization process and consequently producing pores over the surface of microspheres. Furthermore, particles do not get agglomerates and appears discretely from one another which could be due to high zeta potential and potent surface charge over particles [35].
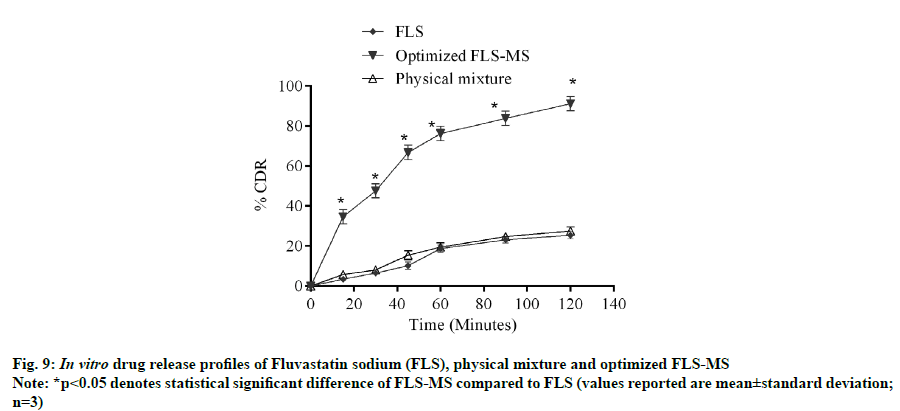
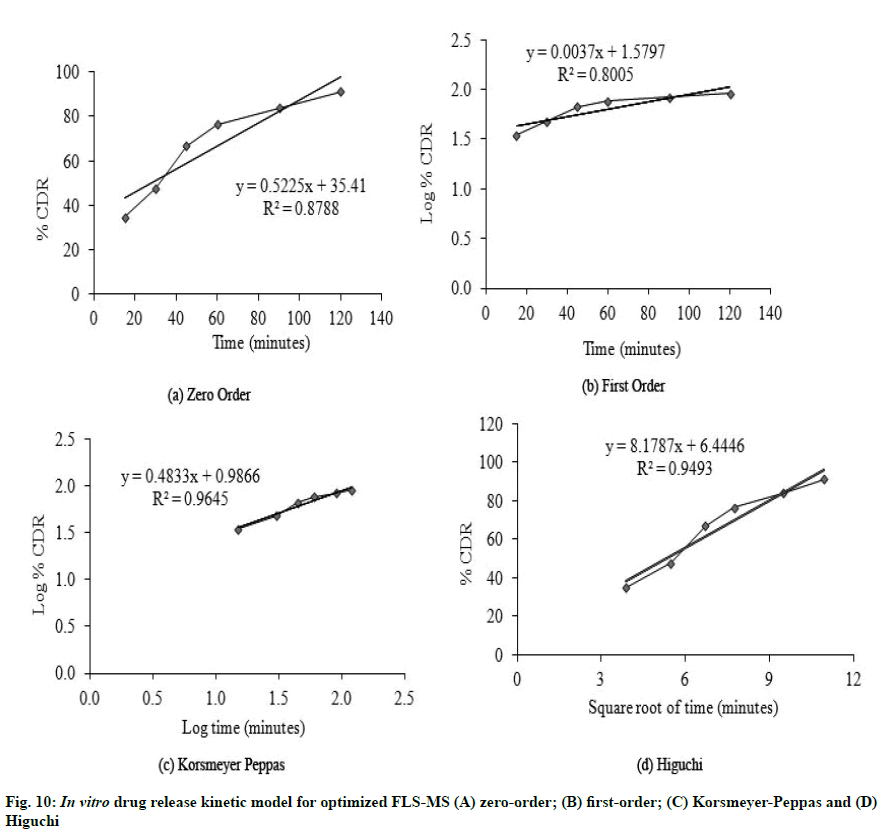
It is evident from in vitro dissolution study that 25.43 %, 27.54 % and 91.2 % cumulative drug release (% CDR) were achieved from FLS, PM and FLS-MS within 2 h, respectively which demonstrated 3.58- fold improvement in dissolution of FLS through manufacturing of freeze dried microspheres (*p<0.05) (fig. 9). The correlation coefficients for the Zeroorder, First-order, Korsmeyer-Peppas, and Higuchi models for FLS-MS were 0.8788, 0.8005, 0.9645 and 0.9493, respectively. Korsmeyer- Peppas model was discovered to be extremely good (y=0.4833x+0.9866, r2=0.9645). The ‘n’ value was 0.48 which demonstrated that drug release from FLS-MS was through Fickian diffusion [14,36] (fig. 10).
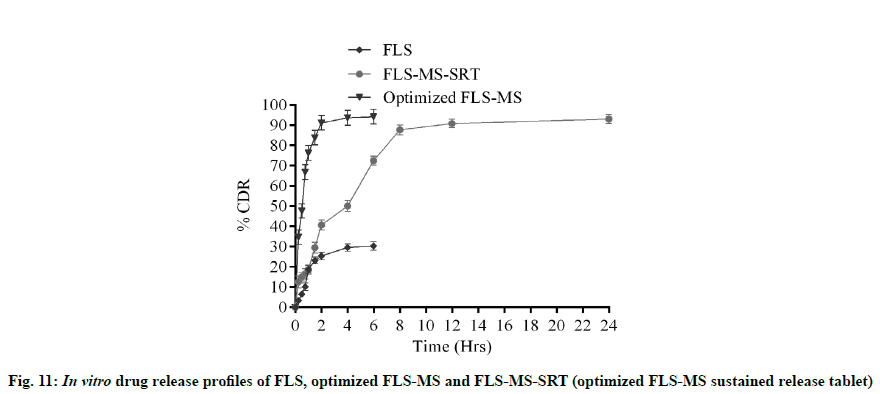
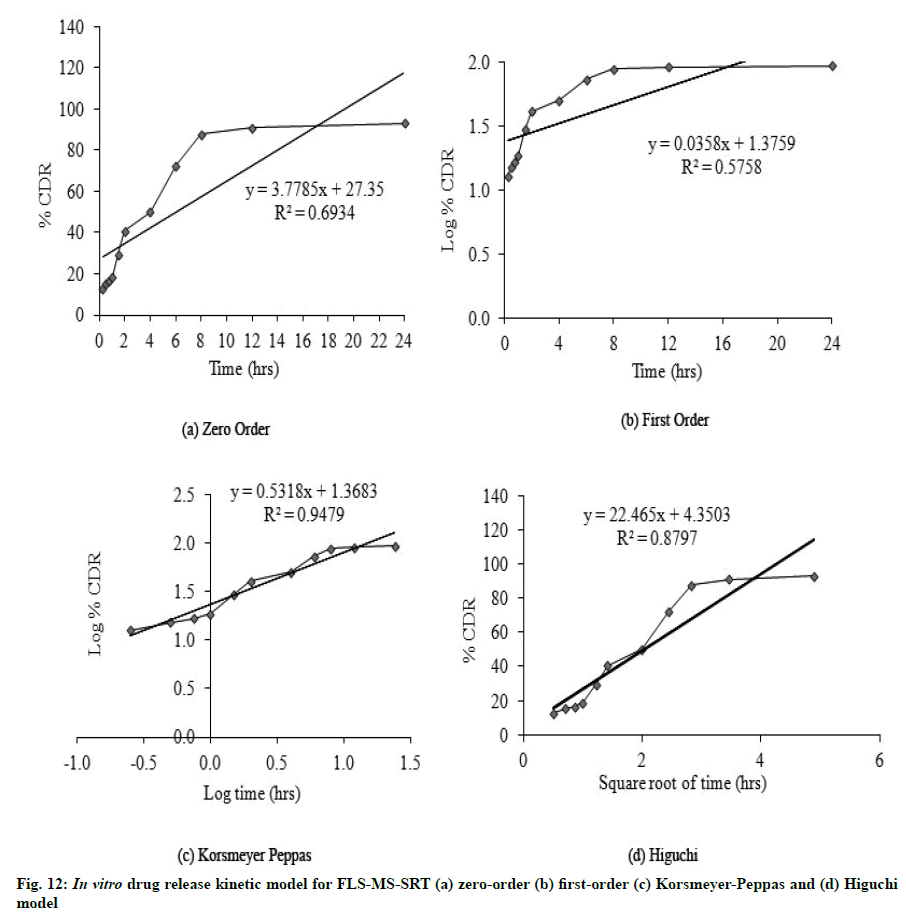
FLS-MS rendered a rapid release of 91.2 % and 94.21 % of drug within 2 and 6 h, whereas FLS-MS-SRT revealed 93.1 % drug release through diffusion over 24 h (fig. 11). The slow drug release from matrix tablet could attributable to swelling tendency of eudragit polymeric matrix. According to the Korsmeyer-Peppas equation, the ‘n’ value of 0.5318 indicated ananomalous (diffusion/erosion controlled) drug release mechanism from FLS-MS-SRT [14-17,37] (fig. 12)
In this study, we utilized a combination of freeze dried microspheres and their Eudragit polymers-based matrix tablet techniques in order to acquire improved dissolution profile and sustained release of Fluvastatin sodium to reduce dosage frequency. Solvent evaporated freeze dried microspheres manufactured using PVP K-30 and Poloxamer 407 exhibited 3.58-fold improvement in dissolution of Fluvastatin sodium in 2 h. Furthermore, sustained release of Fluvastatin sodium over 24 h was achieved through Eudragit RL 100 and Eudragit RS 100 based sustained release matrix tablet. The drug release mechanism from FLS-MS-SRT was found anomalous (n=0.5318) which suggested diffusion- along with erosion-controlled release mechanism. Conclusively, it has been shown that the innovative integration of freeze dried microspheres and their Eudragit polymerbased matrix tablet strategies could gain significant potential to boost drug dissolution and sustained release of water-insoluble drugs together with reduced dosage frequency.
Acknowledgements:
The authors wish to thanks Chitkara College of Pharmacy, Chitkara University, Punjab, India for providing infrastructure facilities for carrying out this work. The authors express their gratitude to Evonik Industries AG (Mumbai, India) for supplying Eudragit RL 100 & RS 100. The researchers do acknowledge Stat-Ease, Inc for trial version 11.1.2.0 of Design- Expert software.
Conflict of interests:
The authors declare that they have no competing interest.
References
- Bikiaris DN. Solid dispersions, Part I: recent evolutions and future opportunities in manufacturing methods for dissolution rate enhancement of poorly water-soluble drugs. Expert Opin Drug Deliv 2011;8(11):1502-19.
- Vo CLN, Park C, Beom-Jin Lee BJ. Current trends and future perspectives of solid dispersions containing poorly water-soluble drugs. Eur J Pharm Biopharm 2013;85(3):799-813.
- Li J, Yang M, Xu WR. Enhanced oral bioavailability of fluvastatin by using nanosuspensions containing cyclodextrin. Drug Des Devel Ther 2018;12:3491-9.
- El-Helw AR, Fahmy UA. Improvement of fluvastatin bioavailability by loading on nanostructured lipid carriers. Int J Nanomedicine 2015;10:5797-804.
- Papageorgiou GZ, Papadimitriou S, Karavas E, Georgarakis E, Docoslis A, Bikiaris D. Improvement in chemical and physical stability of fluvastatin drug through hydrogen bonding interactions with different polymer matrices. Curr Drug Deliv 2009;6(1):101-12.
- Kim JS, Park JH, Jeong SC, Kim DS, Yousaf AM, Din FU, et al. Novel revaprazan-loaded gelatin microsphere with enhanced drug solubility and oral bioavailability. J Microencapsul 2018;35(5):421-7.
- Yousaf AM, Kim DW, Kim DS, Kim JO, Youn YS, Cho KH, et al. Influence of polyvinylpyrrolidone quantity on the solubility, crystallinity and oral bioavailability of fenofibrate in solvent-evaporated microspheres. J Microencapsul 2016;33(4):365-71.
- Siow CR, Wan Sia Heng P, Chan LW. Application of freeze-drying in the development of oral drug delivery systems. Expert Opin Drug Deliv 2016;13(11):1595-608.
- Patel RP, Patel MM. Physicochemical characterization and dissolution study of solid dispersions of lovastatin with polyethylene glycol 4000 and polyvinylpyrrolidone K30 solid dispersions of lovastatin. Pharm Dev Technol 2007;12:21-33.
- Franco P, Marco ID. The use of poly (N-vinyl pyrrolidone) in the delivery of drugs: A review. Polymers 2020;12(5):1114-43.
- Thybo P, Pedersen BL, Hovgaard L, Holm R, Müllertz A. Characterization and physical stability of spray dried solid dispersions of probucol and PVP-K30. Pharm Dev Technol 2008;13(5):375-86.
- Eloy JO, Marchetti JM. Solid dispersions containing ursolic acid in poloxamer 407 and PEG 6000: A comparative study of fusion and solvent methods. Powder Technol 2014;253:98-106.
- Sharma N, Deshpande RD, Sharma D, Sharma RK. Development of locust bean gum and xanthan gum based biodegradable microparticles of celecoxib using a central composite design and its evaluation. Ind Crops Prod 2016;82:161-70.
- Basalious EB, El-Sebaie W, El-Gazayerly O. Application of pharmaceutical QbD for enhancement of the solubility and dissolution of a class II BCS drug using polymeric surfactants and crystallization inhibitors: Development of controlled-release tablets. AAPS PharmSciTech 2011;12(3):799-810.
- Ali R. Ammonio methacrylate copolymer as a carrier for water-insoluble drug, preparation and characterization of an oral controlled-release matrix tablet. J Drug Deliv Sci Technol 2017;41:7-12.
- Tabandeh H, Mortazavi SA, Guilani TB. Preparation of sustained-release matrix tablets of aspirin with ethylcellulose, Eudragit RS100 and Eudragit S100 and studying the release profiles and their sensitivity to tablet hardness. Iran J Pharm Res 2010;20(4):201-6.
- Reddy KR, Mutalik S, Reddy S. Once-daily sustained-release matrix tablets of nicorandil: Formulation and in vitro evaluation. AAPS PharmSciTech 2003;4(4):480-8.
- Kim JE, Cho HJ, Kim DD. Budesonide/cyclodextrin complex-loaded lyophilized microparticles for intranasal application. Drug Dev Ind Pharm 2014;40(6):743-8.
- Morita T, Horikiri Y, Suzuki T, Yoshino H. Preparation of gelatin microparticles by co-lyophilization with poly (ethylene glycol): characterization and application to entrapment into biodegradable microspheres. Int J Pharm 2001;219(1-2):127-37.
- Dixit M, Kini AG, Kulkarni PK. Enhancing the aqueous solubility and dissolution of olanzapine using freeze-drying. Braz J Pharm Sci 2011;47(4):743-9.
- Jelvehgari M, Hassanzadeh D, Kiafar F, Loveym BD, Amiria S. Preparation and determination of drug-polymer interaction and in vitro release of mefenamic acid microspheres made of celluloseacetate phthalate and/or ethylcellulose polymers. Iran J Pharm Res 2011;10(3):457-67.
- Ganesan P, Soundararajan R, Shanmugam U, Ramu V. Development, characterization and solubility enhancement of comparative dissolution study of second generation of solid dispersions and microspheres for poorly water soluble drug. Asian J Pharm Sci 2015;10(5):433-41.
- Mwila C, Walker RB. Improved stability of rifampicin in the presence of gastric-resistant isoniazid microspheres in acidic media. Pharmaceutics 2020;12(3):234-62.
- Sibeko B, Choonara YE, Toit LCD, Modi G, Naidoo D, Khan RA, et al. Composite polylactic-methacrylic acid copolymer nanoparticles for the delivery of methotrexate. J Drug Del 2012;2012:1-18.
- Khairnar G, Naik J, Mokale V. A statistical study on the development of micro particulate sustained drug delivery system for Losartan potassium by 32 factorial design approach. Bull Fac Pharm Cairo Univ 2017;55(1):19-29.
- Subhedar P, Naik JB, Muley DN. Effect of polymer concentration on sustained release microparticles of metformin hydrochloride prepared by using spray dryer. Polym Plast Technol Eng 2010;49(3):267-71.
- Xu H, Liu L, Li X, Ma J, Liu R, Wang S. Extended tacrolimus release via the combination of lipid-based solid dispersion and HPMC hydrogel matrix tablets. Asian J Pharm Sci 2019;14(4):445-54.
- Roni MA, Kibria G, Jalil R. Formulation and in vitro evaluation of alfuzosin extended release tablets using directly compressible eudragit. Indian J Pharm Sci 2009;71(3):252-8.
- Sheng X, Tang J, Bao J, Shi X, Su W. Enhancement of in vitro dissolution and in vivo performance/oral absorption of FEB-poloxamer-TPGS solid dispersion. J Drug Deliv Sci Technol 2018;46:408-15.
- Parmar K, Patel J, Sheth N. Formulation and optimization of Embelin nanosuspensions using central composite design for dissolution enhancement. J Drug Deliv Sci Technol 2015;29:1-7.
- Wu XG, Li G, Gao YL. Optimization of the preparation of nalmefene-loaded sustained-release microspheres using central composite design. Chem Pharm Bull 2006;54(7):977-81.
- Jaswir I, Noviendri D, Taher M, Mohamed F, Octavianti F, Lestari W, et al. Optimization and Formulation of fucoxanthin-loaded microsphere (F-LM) using response surface methodology (RSM) and analysis of its fucoxanthin release profile. Molecules 2019;24(5):947-63.
- Dey S, Pramanik S, Malgope A. Formulation and optimization of sustained release stavudine microspheres using response surface methodology. Int Sch Res Notices 2011;2011:1-7.
- Salama AH, Mahmoud AA, Kamel R. A novel method for preparing surface-modified fluocinolone acetonide loaded PLGA nanoparticles for ocular use: in vitro and in vivo evaluations. AAPS PharmSciTech 2016;17(5):1159-72.
- Ma G, Song C. PCL/Poloxamer 188 blend microsphere for paclitaxel delivery: Influence of poloxamer 188 on morphology and drug release. J Appl Polym Sci 2007;104(3):1895-9.
- Szafraniec J, Antosik A, Knapik-Kowalczuk J, Chmiel K, Kurek M, Gawlak K, et al. The self-assembly phenomenon of poloxamers and its effect on the dissolution of a poorly soluble drug from solid dispersions obtained by solvent methods. Pharmaceutics 2019;11(3):130-52.
- Joshi AS, Patil CC, Shiralashetti SS, Kalyane NV. Design, characterization and evaluation of eudragit microspheres containing glipizide. Drug Invent Today 2013;5(3):229-34.
