- *Corresponding Author:
- Vandana Jain
Department of Quality Assurance,
Oriental College of Pharmacy,
Mumbai, Maharashtra 400705,
India
E-mail: vandana.jain@ocp.edu.in
| Date of Received | 18 May 2020 |
| Date of Revision | 16 June 2021 |
| Date of Acceptance | 01 January 2022 |
| Indian J Pharm Sci 2022;84(1):66-71 |
This is an open access article distributed under the terms of the Creative Commons Attribution-NonCommercial-ShareAlike 3.0 License, which allows others to remix, tweak, and build upon the work non-commercially, as long as the author is credited and the new creations are licensed under the identical terms
Abstract
A novel, simple, accurate and precise isocratic high performance liquid chromatographic method was developed for the estimation of four phenolic acids, namely gallic acid, protocatechuic acid, vanillic acid and syringic acid in the sugarcane roots. The selected phenolic acids were analyzed using shim-pack high performance liquid chromatography C18 column (250×4.6 mm, 5 μm) by isocratic elution. The mobile phase used was methanol:water containing 0.2 % ortho-phosphoric acid in the ratio of 20:80 at 28°. The flow rate was 1 ml/min and detection wavelength was set to 220 nm. The run time was kept 30 min. The retention time of gallic acid, protocatechuic acid, vanillic acid and syringic acid was found to be 4.864, 8.741, 20.298 and 25.268 min, respectively. Linearity was established for all the selected phenolic acids in the range of 0.25-20 μg/ml. The percentage recoveries of gallic acid, protocatechuic acid, vanillic acid and syringic acid were found to be in the range of 98-102 %. The method was found to be robust. Therefore, the method was successfully applied for the determination of the above mentioned phenolic acids in the sugarcane rootss. Key words: Sugarcane roots.
Keywords
Sugarcane roots, phenolic acids, high performance liquid chromatography, C18 column
Sugarcane (Saccharum officinarum) is an important crop in tropical and subtropical areas. It is one of the ancient crops known to man[1,2]. India is the highest producer of sugarcane in the world, after Brazil[3]. In India, sugar industry with 400 sugar factories rank as the second major agro-industry in the country[4]. Sugarcane crops are primarily grown for sugar production, after the main use of sugarcane crop, the crop generates large quantities of agriculture waste including green tops, leaves and roots[5,6].
The sugarcane stalk is well studied for its phytochemical composition; the important constituents are phenolic acids, flavonoids, steroids, fatty acids, fatty alcohols[7]. The lesser studied parts of sugarcane are leaves and roots which form a substantial quantity of waste from sugarcane crop. The leaves are reported to contain sterols such as stigmasterol and sitosterol, flavonoids, anthocyanins. Phytochemical nature of roots is still unfamiliar except for the few papers indicating the presence of flavonoids and anthocyanins[8].
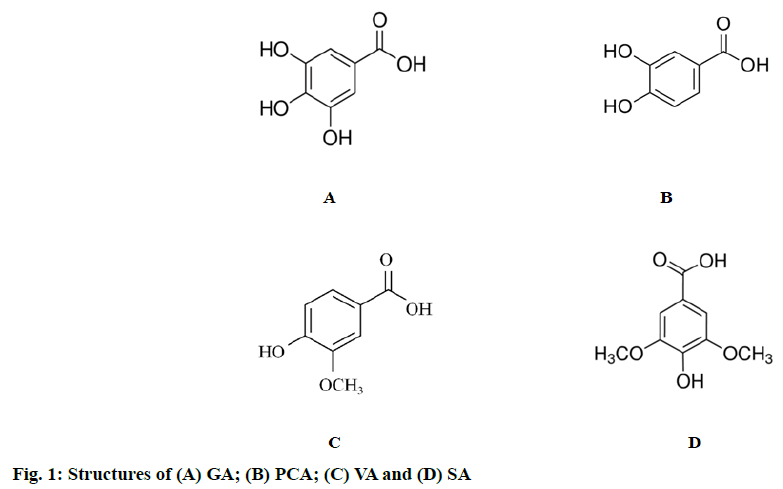
The literature survey revealed that roots are unexplored with respect to quantitative determination of phytoconstituents, hence it was necessary to study the roots for the quantitative estimation of polyphenolic compounds. Based on the occurrence of polyphenolics in sugarcane, Gallic Acid (GA), Protocatechuic Acid (PCA), Vanillic Acid (VA) and Syringic Acid (SA) were selected for the present study (fig. 1)[9].
Literature survey also revealed that so far there is no isocratic Reversed Phase High Performance Liquid Chromatographic (RP-HPLC) method reported for simultaneous estimation of these important polyphenolic constituents. Hence it was thought worthwhile to develop a novel, simple isocratic RP-HPLC method for simultaneous estimation of GA, PCA, VA and SA. The developed novel RP-HPLC was applied for the first time for quantification of selected polyphenolics in sugarcane roots.
The selected polyphenolic compounds are well known bioactive constituents. GA is reported to possess strong antioxidant, astringent activity and cytotoxic activity[10]. PCA is reported to act as antibacterial, antifibrotic and anti-ageing[11]. VA is reported to possess anti-inflammatory and neuroprotective effect[12]. While SA is a well-known antioxidant, anti-inflammatory and antimicrobial compound[13].
Materials and Methods
GA, PCA, VA and SA (purity 95 %) were procured from Sigma-Aldrich, Mumbai, India. HPLC grade methanol and ortho-phosphoric acid were purchased from Thomas Baker Chemicals Pvt. Ltd. Mumbai, India. High quality pure water obtained from Lab Q Ultra Type-1 was used throughout the analysis.
RP-HPLC system (Shimadzu, LC-2030) comprising of an auto start-up, auto injector, quick batch function and Ultraviolet (UV) detector was used for the analysis. Analytical column used for separation of analytes was shim-pack HPLC C18 (250×4.6 mm, 5 μm). The data was noted using “Lab Solutions” software.
Plant materials and sample preparation:
Sugarcane roots were procured from the sugarcane fields in Karad, Maharashtra. The roots were washed with water and subjected to sun drying for 7 d. The roots were then dried in oven at 60° for 2 d. The dried plant material grinded into coarse powder using Hanningfield Uni-Mill M10 (Gansons Pvt Ltd), with screen 37R having size 1 mm grater hole. The resulting powder was subjected to extraction for further HPLC analysis.
Preparation of sample solution:
Accurately 5 g powder of sugarcane roots was weighed and subjected to extraction with 80 ml hydro alcohol for 20 min using reflux assembly. The solution was then centrifuged to get a clear solution. The volume was made up to 100 ml with hydro alcohol and was used for HPLC analysis.
Preparation of standard solutions:
GA, PCA, VA and SA (100 mg) were accurately weighed and transferred into separate 100 ml volumetric flasks and volume was adjusted to 100 ml with HPLC grade methanol. The stock solution was further used for RP- HPLC analysis after suitable dilutions.
Chromatographic conditions:
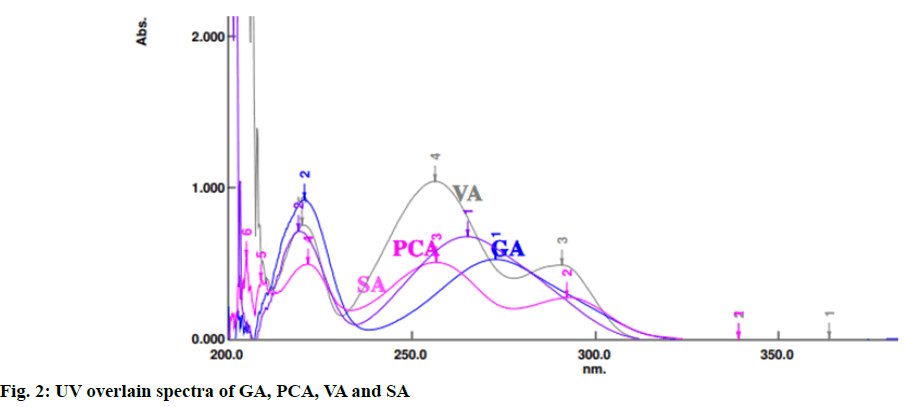
The method was developed using RP-HPLC, Shimadzu LC Prominance-i 2030 model. The column used for separation of the analytes was shim-pack HPLC C18 column (250´4.6 mm, 5 µm). The optimized mobile phase used was methanol:water containing 0.2 % ortho-phosphoric acid in the ratio of 20:80 at a flow rate of 1 ml/min, column temperature was maintained at 28°. The suitable wavelength for the HPLC analysis was determined by taking separate UV spectrum of GA, PCA, VA and SA in the range of 200-400 nm. UV overlain spectra of these four standards showed that they absorbed appreciably at 220 nm (fig. 2) and hence, 220 nm was selected as detection wavelength using a UV-visible detector. The run time was kept 30 min. The injection volume was 10 μl.
Method validation:
The developed method was validated for specificity, linearity, accuracy, precision, Limits of Detection (LOD), Limits of Quantification (LOQ) and robustness as per International Council for Harmonisation (ICH) Q2 (R1) guidelines[14].
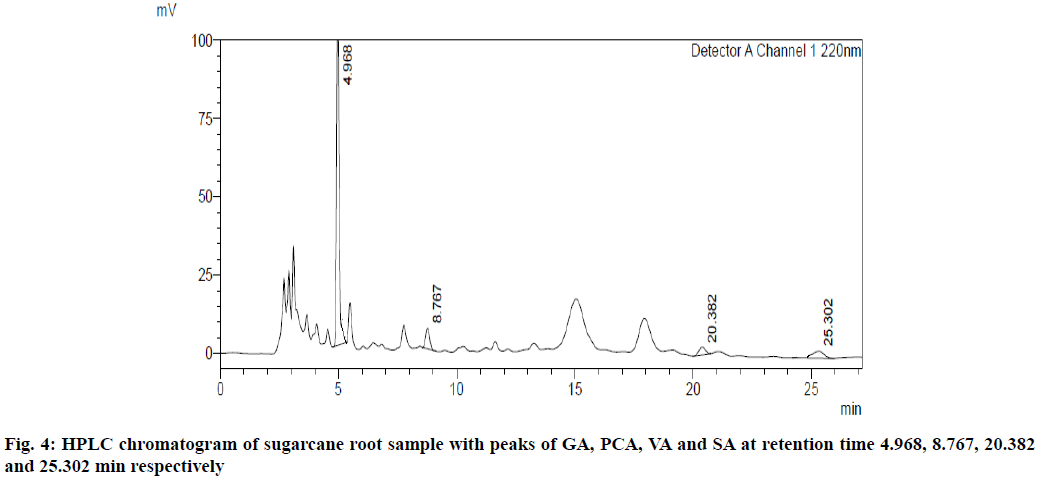
Specificity: Specificity was confirmed by comparing the retention time of the standards with the retention time of components obtained from the extract.
Linearity: Linearity was evaluated by analyzing the plot area as a function of the concentration of analyte. The standards, GA, PCA, VA and SA showed a linear response in the tested concentration range of 0.25- 20 µg/ml. Each standard was run in triplicate. The linearity was constructed by plotting a peak area versus concentration of analyte. The linearity of the detector response for the prepared standards was evaluated by means of linear regression with respect to the amounts of each standard, measured in micrograms (μg) and the area of the corresponding peak from the chromatogram.
Accuracy: Recovery of GA, PCA, VA and SA acid was checked by spiking a known quantity of standards at three concentration levels (i.e., 80 %, 100 % and 120 % of the quantified amount) to the pre-analysed sample in triplicate using HPLC. This way, accuracy was performed and mean recovery was calculated.
Precision: The precision of the method was confirmed by intra-day and inter-day variation studies. Six replicates of mixed standards were injected and the percentage Relative Standard Deviation (% RSD) was calculated.
LOD and LOQ: The LOD of an individual analytical method is the lowest amount of analyte in a sample which can be detected but not essentially quantified as an exact value. The LOD is expressed as LOD=3.3 σ/S, where σ=standard deviation of intercepts of the calibration curve and S is the slope of the calibration curve.
LOQ is a parameter of quantitative assays for low levels of compounds (standards) in extracts. The LOQ is expressed as LOQ=10 σ/S
Robustness: The robustness of the method was determined by making slight changes in the chromatographic conditions (flow rates, wavelength and temperature). Each marker was analyzed in triplicate.
Results and Discussion
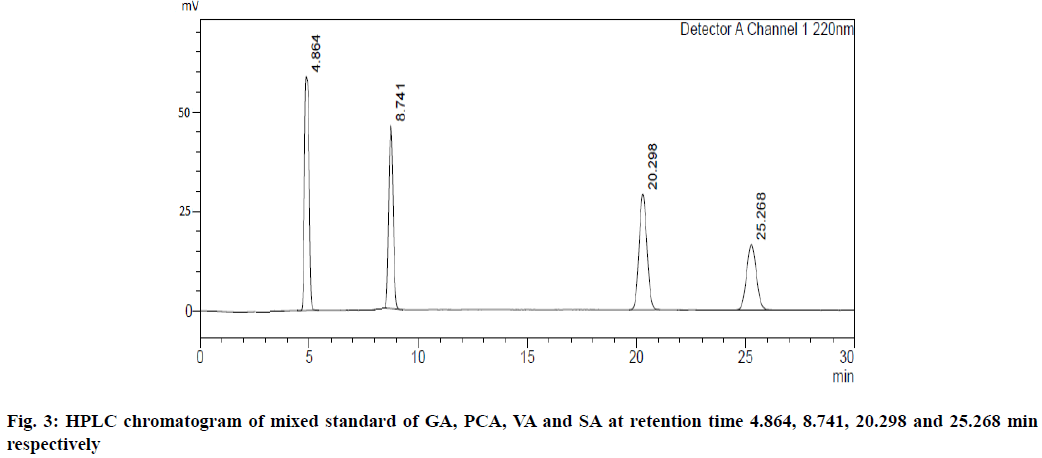
UV overlain spectra of all the four standards showed that drugs absorbed appreciably at 220 nm, so this wavelength was selected as the detection wavelength. Optimization of chromatographic condition was performed to obtain the good peak shape, resolution and peak parameter (tailing factor, theoretical plates). For the selection of mobile phase initially water:methanol and acetonitrile:water has been tried in different proportions but it gave poor peak shape and poor resolution. Finally, methanol:water containing 0.2 % ortho-phosphoric acid in the ratio of 20:80 at the flow rate of 1 ml/min was found to be satisfactory. The optimized mobile phase gave sharp, well-resolved peaks with minimum tailing factor for the selected standards of GA, PCA, VA and SA in mixed standard solution and in sugarcane root extract (fig. 3 and fig. 4).
The retention time for GA, PCA, VA and SA was found to be 4.86, 8.74, 20.29 and 25.26 min, respectively.
The calibration curve for GA, PCA, VA and SA was found to be linear over the range of 0.25-20 μg/ml. The data obtained for regression analysis of the calibration curves is shown in Table 1.
| Parameters (units) | GA | PCA | VA | SA |
|---|---|---|---|---|
| Linearity range (μg/ml) | 0.25-20 | 0.25-20 | 0.25-20 | 0.25-20 |
| Correlation coefficient (R2 ) | 0.9984 | 0.9979 | 0.9985 | 0.9983 |
| Regression equation | y=203993x-12660 | y=115246x+181291 | y=195369x+46364 | y=102490x+11856 |
Note: GA-Gallic acid; PCA-Protocatechuic acid; VA-Vanillic acid; SA-Syringic acid
Table 1: Linear Regression Data of GA, PCA, VA and SA
Accuracy was determined by calculating the percentage (%) recovery. The method was found to be accurate with % recovery between 98.12-101.88 % for all the selected standards. The results are tabulated in Table 2. Robustness of the method was confirmed by injecting the standard solution at change in flow rate, wavelength and temperature. No marked changes were noticed in the sample when compared to the standard chromatogram.
| Drugs | Recovery level (%) | Amount of standard (μg/ml) | Standard added (μg/ml) | Total concentration of standard (μg/ml) | Total amount recovered (μg/ml) | % Recovery |
|---|---|---|---|---|---|---|
| GA | 80 | 3.59 | 2.87 | 6.46 | 6.52 | 99.07 |
| 100 | 3.59 | 3.59 | 7.18 | 7.26 | 98.89 | |
| 120 | 3.59 | 4.30 | 7.89 | 7.95 | 99.24 | |
| PCA | 80 | 4.45 | 3.56 | 8.01 | 8.12 | 98.64 |
| 100 | 4.45 | 4.45 | 8.9 | 9.07 | 98.12 | |
| 120 | 4.45 | 5.34 | 9.79 | 9.75 | 100.41 | |
| VA | 80 | 0.06 | 0.04 | 0.108 | 0.106 | 101.88 |
| 100 | 0.06 | 0.06 | 0.12 | 0.121 | 99.17 | |
| 120 | 0.06 | 0.07 | 0.132 | 0.130 | 101.53 | |
| SA | 80 | 2.65 | 2.12 | 4.77 | 4.80 | 99.37 |
| 100 | 2.65 | 2.65 | 5.3 | 5.39 | 98.33 | |
| 120 | 2.65 | 3.18 | 5.83 | 5.85 | 99.69 |
Table 2: Recovery Study of GA, PCA, VA and SA
The results are presented in Table 3 are indicative that the developed HPLC method is robust.
| Parameters | % RSD (GA) (n=3) | % RSD (PCA) (n=3) | % RSD (VA) (n=3) | % RSD (SA) (n=3) |
|---|---|---|---|---|
| Minus flow rate (0.9 ml/min) | 1.56 | 0.92 | 1.83 | 1.92 |
| Plus flow rate (1.1 ml/min) | 0.69 | 0.81 | 0.92 | 0.76 |
| Minus wavelength (219 nm) | 0.01 | 0.01 | 0.19 | 0.51 |
| Plus wavelength (221 nm) | 0.23 | 0.66 | 0.21 | 1.56 |
| Minus temperature (27°) | 0.36 | 0.37 | 0.41 | 0.68 |
| Plus temperature (29°) | 0.29 | 0.22 | 0.24 | 0.54 |
Note: Robustness parameters were studied by making slight changes in flow rate (±0.1 ml/min), wavelength (±1 nm) and temperature (±1°), for n=3 observations
Table 3: Data of Robustness Studies For GA, PCA, VA and SA
The developed method was found to be specific as there was no interference of any other constituents at the retention time of all four standards, GA, PCA, VA and SA. The % RSD for intra-day and inter-day precision of GA, PCA, VA and SA was found to be 0.43, 0.10, 0.55 and 0.75 respectively, while the % RSD for the intraday precision of GA, PCA, VA and SA was found to be 1.06, 0.48, 0.45 and 1.18 which indicates that the method is precise with % RSD less than 2. The LOD for GA, PCA, VA and SA was found to be 0.062 μg/ml, 0.029 μg/ml, 0.085 μg/ml and 0.116 μg/ml, respectively, while LOQ were 0.188 μg/ml, 0.088 μg/ml, 0.258 μg/ml and 0.353 μg/ml, respectively, which indicates that the developed method is sensitive. The results for validation and system suitability test parameters are tabulated in Table 4, which shows that the parameters are within the acceptable range as per the ICH guidelines.
| Parameters | GA | PCA | VA | SA |
|---|---|---|---|---|
| Retention time (min) | 4.864 | 8.741 | 20.298 | 25.268 |
| Theoretical plates | 3011 | 8050 | 14970 | 14709 |
| Tailing factor | 1.245 | 1.087 | 1.068 | 1.056 |
| Specificity | Specific, no interference | Specific, no interference | Specific, no interference | Specific, no interference |
| Precision (% RSD) Interday (n=6) Intraday (n=6) |
0.43 1.06 |
0.10 0.48 |
0.55 0.45 |
0.75 1.18 |
| LOD (μg/ml) | 0.062 | 0.029 | 0.085 | 0.116 |
| LOQ (μg/ml) | 0.188 | 0.0885 | 0.258 | 0.353 |
Table 4: Summary of Validation and System Suitability Test
In the present study, a novel RP-HPLC method was developed and validated as per the ICH guidelines for the simultaneous estimation of GA, PCA, VA and SA in sugarcane roots. It has been shown that the developed method achieved specificity, linearity, accuracy, precision and robustness which prove the reliability of the method. The method was applied for the quantification of selected standards in the sugarcane root for the first time. The results showed that this method can be easily applied for the estimation and isolation of the four above mentioned phenolic acids in sugarcane roots.
Acknowledgements:
The authors are thankful to the Oriental College of Pharmacy for providing necessary research facilities.
Conflict of interests:
The authors declared no conflict of interest.
References
- Thongchul N, Songserm P, Ngaosuwan K. Whole crop feedstocks in biorefinery: A common classification. In: AZ of Biorefinery. Elsevier; 2022. p. 35-77.
- Dalvi SG. In vitro approaches for improvement of sugarcane cultivar. Shodhganga 2014;1-4.
- Deininger K, Byerlee D. Rising global interest in farmland: Can it yield sustainable and equitable benefits? World Bank Publications; 2011.
- Bhosale PR, Chonde SG, Raut PD. Studies on extraction of sugarcane wax from press mud of sugar factories from Kolhapur district, Maharashtra. J Environ Res Dev 2012;6:715-20.
- Mezimela Z, Mochane M, Tshwafo M. Sugarcane waste management. In: Linda Zikhona Linganiso editor. “Waste to Profit”-(W-t-P): Value added products to generate wealth for a sustainable economy; Waste-to-Profit Book Series 2018. p. 293-302.
- Pierossi MA, Bernhardt HW, Funke T. Sugarcane leaves and tops: Their current use for energy and hurdles to be overcome, particularly in South Africa, for greater utilization. Int Sugar J 2016;89:350-60.
- Singh A, Lal UR, Mukhtar HM, Singh PS, Shah G, Dhawan RK. Phytochemical profile of sugarcane and its potential health aspects. Pharmacogn Rev 2015;9(17):45.
[Crossref] [Google Scholar] [PubMed]
- Li X, Yao S, Tu B, Li X, Jia C, Song H. Determination and comparison of flavonoids and anthocyanins in Chinese sugarcane tips, stems, roots and leaves. J Sep Sci 2010;33(9):1216-23.
[Crossref] [Google Scholar] [PubMed]
- Zhao ZG, Zhu LC, Yu S, Fu X, Zeng XA. Simultaneous determination of ten major phenolic acids in sugarcane by a reversed phase HPLC method. Zuckerindustrie 2008;133(8):503.
- Genwali GR, Acharya PP, Rajbhandari M. Isolation of gallic acid and estimation of total phenolic content in some medicinal plants and their antioxidant activity. Nepal J Sci Technol 2013;14(1):95-102.
- Khan AK, Rashid R, Fatima N, Mahmood S, Mir S, Khan S, et al. Pharmacological activities of protocatechuic acid. Acta Pol Pharm 2015;72(4):643-50.
[Google Scholar] [PubMed]
- Singh JC, Kakalij RM, Kshirsagar RP, Kumar BH, Komakula SS, Diwan PV. Cognitive effects of vanillic acid against streptozotocin-induced neurodegeneration in mice. Pharm Biol 2015;53(5):630-6.
[Crossref] [Google Scholar] [PubMed]
- Srinivasulu C, Ramgopal M, Ramanjaneyulu G, Anuradha CM, Kumar CS. Syringic acid (SA)-a review of its occurrence, biosynthesis, pharmacological and industrial importance. Biomed Pharmacother 2018;108:547-57.
[Crossref] [Google Scholar] [PubMed]
- ICH Harmonised Tripartite Guideline. Validation of analytical procedures: Text and methodology Q2(R1). Geneva; 2005. p. 1-13.


