- *Corresponding Author:
- J. K. Patel
Department of Pharmacognosy, Agricultural Produce Market Committee College of Pharmaceutical Education and Research, Himatnagar 383001, Gujarat, India
E-mail: ncp.nisu@gmail.com
| Date of Received | 02 March 2020 |
| Date of Revision | 06 September 2020 |
| Date of Acceptance | 03 August 2021 |
| Indian J Pharm Sci 2021;83(4):765-774 |
This is an open access article distributed under the terms of the Creative Commons Attribution-NonCommercial-ShareAlike 3.0 License, which allows others to remix, tweak, and build upon the work non-commercially, as long as the author is credited and the new creations are licensed under the identical terms
Abstract
Epigallocatechin gallate is a potent phytomolecule with wide biological activity and is a class III drug. The therapeutic effect is limited, owing to poor stability and limited membrane permeability across the intestine. The aim of this study was to develop and evaluate colon-targeted microspheres of epigallocatechin gallate, using natural polymers. Water-in-oil emulsion crosslinking technique was used to prepare microspheres of epigallocatechin gallate using interpenetrating network of chitosan and gum acacia and glutaraldehyde was used as a crosslinking agent. Prepared microspheres were filled in capsules coated with Eudragit S100. The prepared microspheres were evaluated in vitro for preformulation studies, encapsulation efficiency, micromeritic properties, dissolution studies and stability studies. Fourier transform infrared spectroscopy and differential scanning calorimetry studies had proved that the drug and polymers are compatible. The good flow property of microspheres show that the microspheres are not aggregated. Scanning electron microscope micrographs of microspheres show a rough and folded surface morphology. The microspheres are spherical and uniform in shape. Formulations show good encapsulation efficiency. Formulation F1 to F6 show sustained release of drug for 10 h. The in vitro drug release of batch F1 to F6 were best explained by Higuchi models due to diffusion mechanism of drug release from polymeric matrix system. The selected formulation batch for a period of 3 mo at 40±2°/75±5 % RH show no significant changes. The current approach was helpful to develop polysaccharide based microspheres of epigallocatechin gallate to enhance colonic drug delivery.
Keywords
Epigallocatechin gallate, gum arabic, chitosan, colonic drug delivery, microspheres
Extensive research has expanded the role of green tea as bioactive molecules from a traditional beverage for healing many health ailments. Camellia sinensis is ample with catechins consisting of around 8 polyphenolic compounds. Different sources suggests, the most plentiful catechins present in tea are (-)-epigallocatechin gallate (EGCG) and (-)-epigallocatechin (EGC)[1,2]. EGCG shows beneficial health effects including anti- oxidation[3], anti-diabetes[4], anti-inflammation[5,6] and anti-tumorigenesis activity[7].
Many possible mechanisms have been explored to study the healthy benefits of tea catechins, in various areas such as antioxidative activity, regulating the tumor-suppressor microRNAs, inhibiting C-Met (hepatocyte growth factor receptor (HGFR)) activity, inhibiting IκB kinase activity[3,8-11]. The preventive actions of EGCG on signaling pathways controlling cyclooxygenase 2 (COX-2) expressions were observed. EGCG suppressed the extracellular signal-regulated protein kinase (ERK1/2) and Protein kinase B (PKB/ Akt) pathways in colon cancer cells[12].
However, the oral administration of green tea catechins shows sub-or low-micromolar range peak plasma levels in human subjects or animals[13,14], which was lesser compared to the effective concentration of in vitro tests. Therefore, the practical utility of this therapeutically potential molecule is restricted, owing to poor stability in the colon and limited membrane permeability across the intestine[15-17]. Catechins are unstable under physiologic conditions and they could be rapidly degraded or metabolized through interactions with the hydroxyl groups on the phenol rings[18].
Accompanying antioxidant agents is vital for the stability of EGCG in gastrointestinal solutions[19,20]. Antioxidants inhibit formation of EGCG dimers, so as to inhibit epimerization of EGCG to GCG, which offers protection to EGCG.
Gum Arabic (GA) is an edible, dried gummy exudate from the trees of Acacia senegal and Acacia seyal. GA has been supposed to act as an antioxidant, which may prevent the degradation of EGCG and cytoprotective agent. A number of studies have reported cross-linking of GA with other biopolymers such as gelatin, chitosan and pectin. Cross-linking of polymers results in a new polymeric material with improved properties and functionality[21,22] . Chitosan is the most widely used material as an EGCG carrier, as the stability of EGCG in the intestinal fluid and plasma concentration are enhanced by chitosan as per reported literature[23,24]. The properties of chitosan can be improved by modifications in presence of other hydrocolloids[25], which has inspired the researcher in formulating advanced formulations by complexing chitosan with additional natural polymers.
In the present study, interpenetrating network (IPNs) have been prepared using blends of chitosan and GA in the form of microspheres of EGCG for colon targeted delivery. Microspheres were prepared by water-in-oil (w/o) emulsion crosslinking method and glutaraldehyde was used as a crosslinking agent. Prepared microspheres were evaluated for drug polymer study, particle size, percentage drug entrapment, surface morphology, percentage yield, in vitro drug release and stability studies.
Materials and Methods
Materials:
Epigallocatechin Gallate (EGCG) was obtained as gift sample from Kan Phytochemicals Private Ltd. Haryana, India. Chitosan and Arabic gum were purchased from Merck, Mumbai, India. Glutaraldehyde aqueous solution 25 % (v/v) (AR), ethanol, n-hexane and liquid paraffin oil were purchased from S.D. fine Chemicals, Mumbai, India. Tween-80 was purchased from Lesser Chemicals, Mumbai, India.
Methods:
Drug characterization, identification and drug polymer compatibility study: Drug sample was authenticated by ultraviolet (UV) absorbance, melting point measurement, Fourier transform infrared spectroscopy (FTIR) and ultra-performance liquid chromatography (UPLC). Chromatographic separation was attained on Thermo scientific Dionex Ultimate 3000 having ODS C18 Perkin Elmer column. The mobile phase consisting of acetic acid (1 %, v/v): acetonitrile (87:13, v/v) isocratically pumped at a flow rate of 0.25 ml/min and detection was monitored at 280 nm. The pH of mobile phase was default. 10 μl of sample solution was injected in each run. The column and auto-sampler were maintained at 30° and 35°, respectively. The melting point of the drug was determined by Differential scanning calorimetry (DSC) technique. The sample powder of the formulation was dispersed in potassium bromide (KBr) powder and compressing into disc by applying pressure of 5 tonnes for 5 min in hydraulic press. Spectra were recorded from 4500 to 400 cm-1 scanning range and the observed spectra were compared with reference FTIR spectra. FTIR of EGCG, polymers and microspheres were determined by Shimadzu FT-IR 8300 Spectrophotometer (Shimadzu, Tokyo, Japan). The UV Spectrum of EGCG in methanol was recorded using Shimadzu UV–1700 and compared with reported literature.
Solubility study: Excess amount of EGCG was put into 25 ml of 0.1 N hydrochloric acid (HCl) (pH 1.2), phosphate buffer (pH 6.8) and phosphate buffer (pH 7.4), water and methanol separately in conical flasks. Then these flasks were kept in orbital shaker at 37°. After 1 h all the solutions were filtered and measured using UV spectrophotometer at 273.5 nm against 0.1N HCl (pH 1.2), phosphate buffer (pH 6.8) and phosphate buffer (pH 7.4). Then the amount of drug solubilized was calculated.
Preparation of microspheres: Briefly, required amounts of chitosan was dissolved in 2 % acetic acid solution and EGCG and GA were dissolved in deionized water using magnetic stirrer (remi)/ sonicator (Toshniwal process ultrasonicator bath) for 60 min. Afterwards, both the solutions were mixed for each formulation maintaining polymer to drug ratio and mixed thoroughly using a magnetic stirrer. This solution was incorporated drop by drop into 80 ml of liquid paraffin containing tween 80 (2 % v/v) followed by required stirring speed for 45 min with the help of a mechanical stirrer (Remi electro-technik Ltd., Vasai, India). After 45 min, 1 ml of 0.1 M HCl and required amount of glutaraldehyde (25 %) was added to the resultant emulsion and was stirred for 2 h. Finally, microspheres were obtained by vacuum filtration and washed with n-hexane and dried in hot air oven at 40°. All the studies were carried out in amber colored glass containers under dark conditions. Composition of different batches was tabulated in Table 1.
| Formulations | Drug | GA:Chitosan | Glutaraldehyde | Stirring speed |
|---|---|---|---|---|
| (ml) | (rpm) | |||
| F1 | 200 | 01:01 | 1 | 1700 |
| F2 | 200 | 01:02 | 2 | 1500 |
| F3 | 200 | 01:01 | 1 | 1500 |
| F4 | 200 | 01:02 | 1 | 1700 |
| F5 | 200 | 01:01 | 2 | 1500 |
| F6 | 200 | 01:02 | 2 | 1700 |
Table 1: Preparation of EGCG Microspheres
Optimization of microspheres by preliminary batches: Several ratios for drug:polymer was tried like 1:1, 1:2, 1:3, but 1:2 yield spherical microspheres. Amount of drug:polymer ratio was optimized at 1:2. Amount of external phase for the preparation of emulsion had a significant effect on formation of stable emulsion. Less volume of external liquid (60 ml) A1 leads to aggregation of microsphere and more volume of external phase (80 ml) A2 leads to formation of spherical to coarse particles. Therefore, 80 ml of external phase was optimized. Slower stirring speed produces lump and patch like formation inside beaker. As the rotation speed of the propeller increased from 1100-1700 rpm, the average particle size decreased. Stirring speed of 1500 and 1700 rpm (A5 and A6) was selected for further studies. Room temperature (A7) did not produced microspheres and 80° (A9) produces aggregated lumps, whereas 60° produces spherical microspheres, so 60° (A8) was selected for further studies.
Evaluation of chitosan loaded EGCG microspheres:
Micromeritic properties of microspheres: Various parameters such as angle of repose, bulk density, tapped density; compressibility index and Hausner’s ratio were evaluated for the prepared EGCG microspheres.
Morphology and size of microspheres: Laser diffraction analyzer (Symantec Helos BF) was used to measure the particle size of prepared formulation batches. The average size range values were expressed for all formulations. Shape and surface morphology of the prepared microspheres were characterized by scanning electron microscope (SEM) (Nova nano scanning electron microscope 450 FEI Ltd.). Intensity of 10 kV was used for taking the photographs of microspheres at different selected magnifications.
Determination of percentage yield, drug loading and entrapment efficiency: 100 mg of prepared microspheres were first crushed with the help of glass mortar pestle followed by dispersion in 100 ml of methanol and kept for overnight for the extraction of drug. The supernatant was diluted with methanol after centrifugation at 2500 rpm for 10 min and using UV spectrophotometer (Shimadzu UV-1700) absorbance was measured at 273.5 nm. After that the mass of EGCG in microspheres was calculated by calibration curve. The percentage entrapment efficiency (EE) was calculated for each batch six times.
Using following equation, percentage yield, drug loading (DL) and EE were determined.
Percentage yield=Mass of obtained microspheres/ Initial Mass of drug+Initial mass of Polymer×100
Drug Loading=Mass of EGCG in microspheres/Initial Mass of Microspheres×100
Entrapment Efficiency=Mass of EGCG in microspheres/ Initial Mass of Drug×100
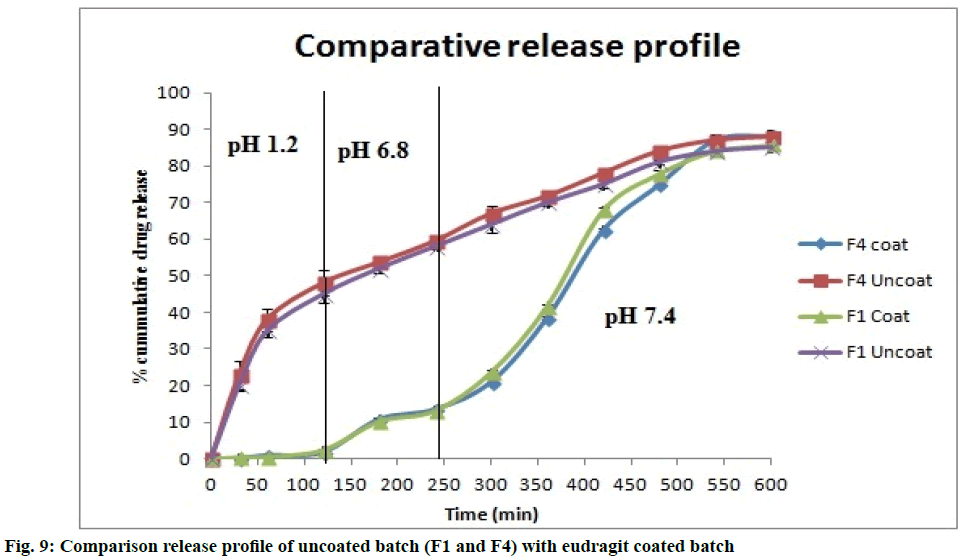
In vitro release study: USP type-I dissolution apparatus (paddle apparatus), (Electrolab, EDT–08 LX, Mumbai, India) was employed for in vitro release study. The dissolution medium selected was pH 1.2 for 2 h, pH 6.8 for next 2 h and then pH 7.4 up to 10 h. 5 ml of samples were taken at regular interval of time and sink conditions were maintained and the absorbance were taken at 273.5 nm.
Kinetics of release study: To study the mechanism of EGCG release from the microspheres, the release data is fitted to the zero order, first order, Higuchi equation and Korsmeyer peppas equation models.
Preparation and evaluation of Eudragit S100 coated capsules filled with EGCG microspheres: The coating solution consisted of a mixture of eudragit S100 (polymer), polyethylene glycol 400 (plasticizer) and talc. A mixture of isopropanol (IPA) and acetone (1:1) served as the solvent. Briefly, polyethylene glycol-400 (PEG-400) at 20 % w/w of polymer was dissolved in IPA-acetone mixture to obtain a clear solution. Next, eudragit S100 was added in small amounts so as to dissolve the polymer. Finally, talc was added to reduce tackiness and stickiness of eudragit films. The final coating solution was stirred for 10 min. The coating solution was applied to capsules (No. 4) containing 100 mg microspheres of batch F1 and F4 by dip coating technique and compared with uncoated batch for in vitro release. The new coated batches are named as F7 and F8.
Stability study:
Stability studies of the selected formulation [F8 (F4 coated batch)] was carried out as per The International Council for Harmonization (ICH) guidelines for a period of 3 mo at 40±2°/75±5 % RH[26]. The batch was then evaluated for percentage drug entrapment and percentage drug release. Similarity factor (f2) was calculated using following equation.
![]()
Results and Discussion
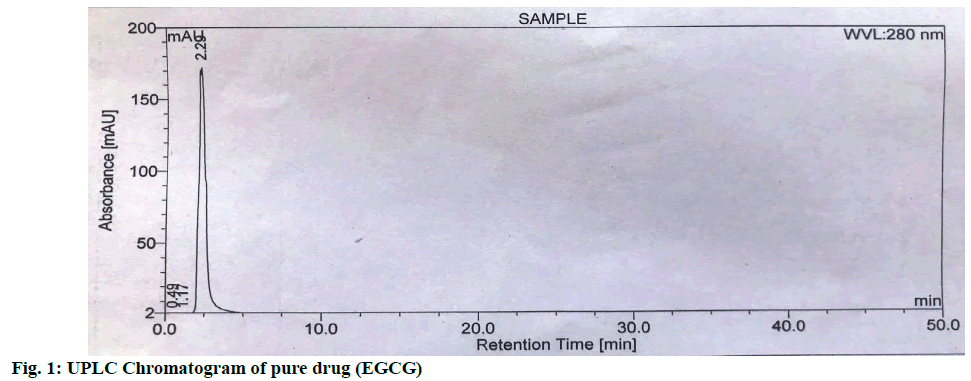
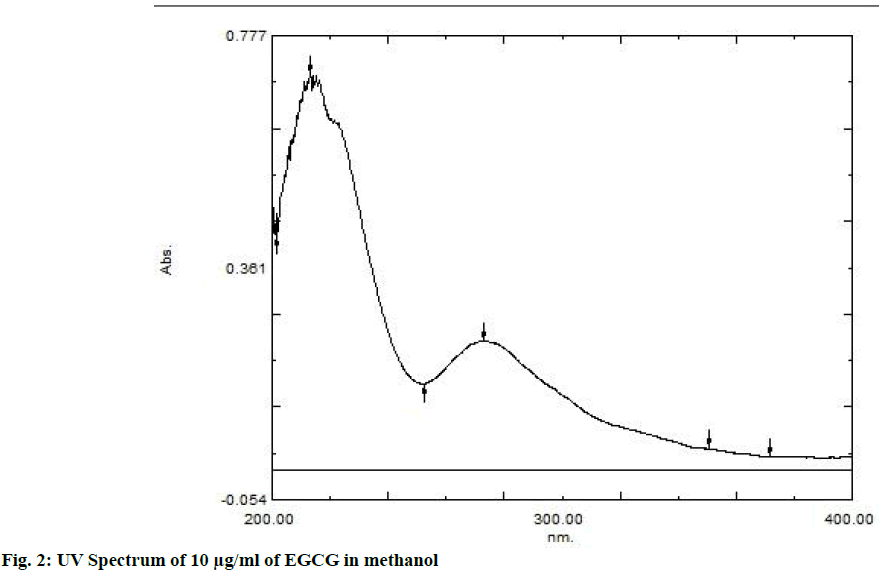
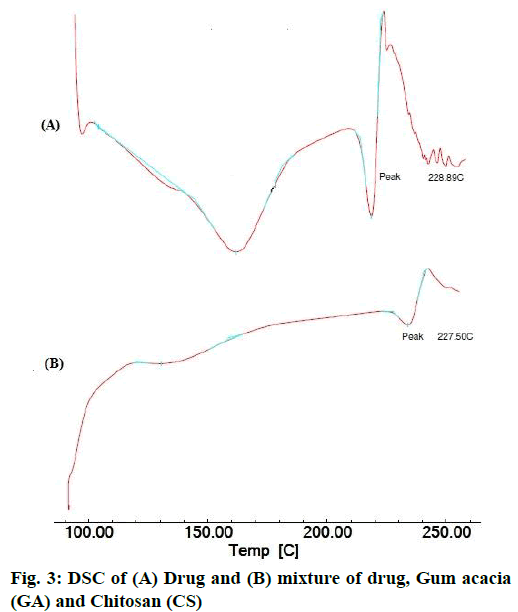
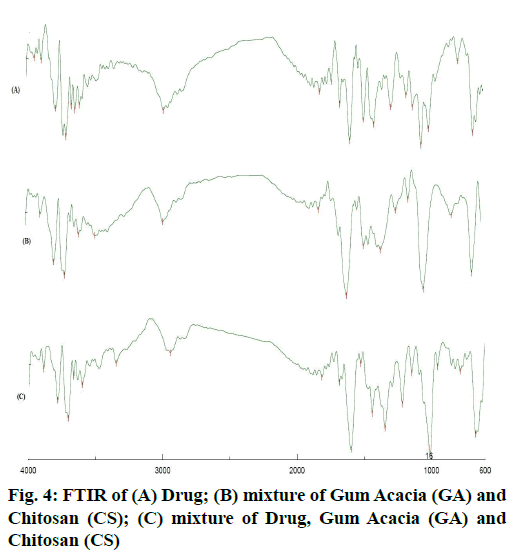
The area count of the EGCG peak was found to be 5539.695. The relative area percentage was found 99.96 %. The Chromatogram of procured sample was represented in fig. 1. The observed melting point of the drug was found to be in the range of reference value. The UV absorption spectrum of drug was recorded and λmax of pure drug EGCG was found to be 273.5 nm. It complies with reported value of standard literature. The spectrum of pure drug was shown in fig. 2. The DSC thermogram of pure drug was depicted in fig. 3. The melting point of pure drug was found 228.29º±1.47, which complies with the reported range. FTIR analysis of the drug in powdered form was scanned from a wavelength of 4500 to 400 cm-1. FTIR Spectra of pure drug was represented in fig. 4.
DSC and FTIR analysis was performed for physical mixture of drug and polymer to verify any physicochemical interaction of drug and polymer. The DSC thermograms of drug and drug-polymers show that there is no change in melting point which confirms that there does not exist any interaction. The DSC thermogram of pure drug and physical mixture was represented in fig. 3. Furthermore, the Infrared spectroscopy (IR) spectra of pure drug and physical mixture of drug and polymer was compared. Frequencies of functional groups of pure drug remained intact in physical mixture containing polymers, so it was concluded that there was no major interaction occurred between the drug and polymers used in the study. The IR spectra of pure drug and physical mixture of drug and polymer was depicted in fig. 4.
Solubility study of EGCG was performed using orbital shaker in 0.1N HCl (pH 1.2), phosphate buffer (pH 6.8), phosphate buffer (pH 7.4), water and methanol by equilibrium solubility method. The result was shown in Table 2.
| SL. No | Medium | Solubility* |
|---|---|---|
| (mg/ml) | ||
| 1 | Phosphate Buffer (pH 7.4) | 22.69±0.059 |
| 2 | Phosphate Buffer (pH 6.8) | 25.78±0.035 |
| 3 | 0.1 N HCl (pH 1.2) | 28.43±0.018 |
| 4 | Water | 25.23±0.023 |
| 5 | Methanol | 18.45±0.041 |
*Results are shown as mean±SD (n=6)
Table 2: Solubility Studies of EGCG In Different Media
The bulk and tapped density values of the microspheres were found between 0.241 to 0.416 g/cm3 and 0.296 to 0.482 g/cm3 respectively. The Carr's index and
Hausner's ratio was found between 13.69 to 18.58 % and 1.15 to 1.22. The angle of repose of the microspheres was found between 27.78° to 33.59°. The good flow property of microspheres show that the microspheres are not aggregated. Thus, it is an advantage while processing the formulation using high-speed packaging equipment. The values of different parameters for different batches were tabulated in Table 3.
| Batches | Bulk density* | Tapped density* | Carr’s index* | Hausner’s ratio* | Angle Of Repose* |
|---|---|---|---|---|---|
| (g/cm3) | (g/cm3) | (θ) | |||
| F1 | 0.253±0.0144 | 0.301±0.0274 | 15.94±0.37 | 1.18±0.027 | 33.59±0.18 |
| F2 | 0.382±0.0120 | 0.455±0.0165 | 16.04±0.23 | 1.19±0.013 | 32.61±0.24 |
| F3 | 0.416±0.0251 | 0.482±0.0143 | 13.69±0.28 | 1.15±0.038 | 30.78±0.26 |
| F4 | 0.316±0.0190 | 0.374±0.0138 | 15.5±0.19 | 1.18±0.029 | 32.63±0.25 |
| F5 | 0.376±0.029 | 0.452±0.0235 | 16.81±0.41 | 1.20±0.031 | 27.78±0.14 |
| F6 | 0.241±0.0131 | 0.296±0.0179 | 18.58±0.14 | 1.22±0.020 | 30.12±0.28 |
*Results are shown as mean±SD (n=6)
Table 3: Micromeritic Properties of EGCG Microspheres
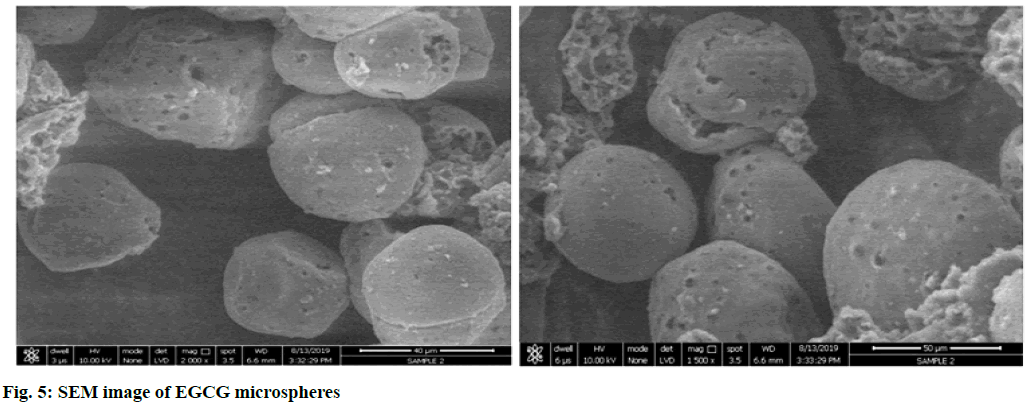
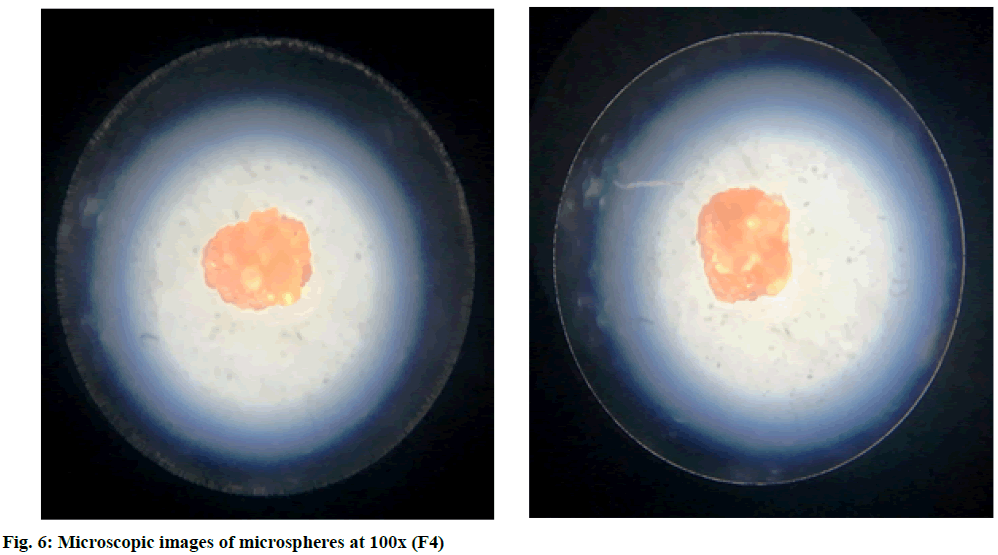
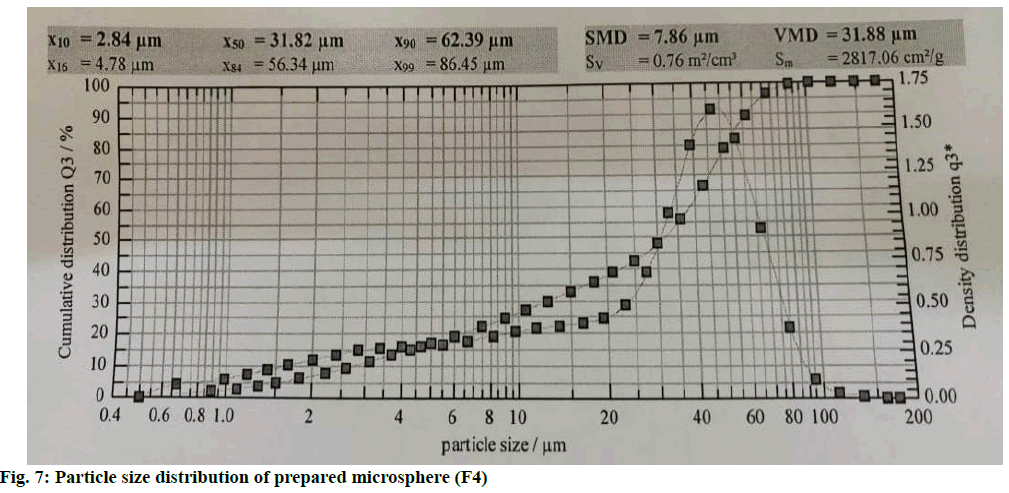
The microspheres were nearly spherical and uniform in shape. The SEM images and microscopic images of microspheres at 100x (F4) of microspheres show a rough surface morphology (fig. 5 and fig. 6). Particle sizes of the formulated batches were found between 31.82±0.17 to 87.43±0.67 μm. The values are shown in Table 4. Particle size distribution of formulation batch (F4) was represented in fig. 7.
| Batches | Mean particle size# | % yield# | % Drug entrapment efficiency# | % Drug Loading# | % release at 10th h# |
|---|---|---|---|---|---|
| (µm) | |||||
| F1 | 37.24±0.35 | 84.52±0.66 | 78.28±0.054 | 31.48±0.05 | 85.06±1.45 |
| F2 | 59.28±0.57 | 83.79±0.36 | 75.27±0.042 | 30.54±0.012 | 78.96±3.86 |
| F3 | 72.19±0.24 | 87.32±0.63 | 77.79±0.085 | 30.28±0.037 | 76.04±3.26 |
| F4 | 31.82±0.17 | 87.08±0.62 | 79.59±0.039 | 32.49±0.029 | 87.94±1.11 |
| F5 | 87.43±0.67 | 83.27±0.45 | 75.98±0.019 | 29.66±0.069 | 82.98±1.69 |
| F6 | 49.23±0.52 | 84.54±0.49 | 74.87±0.083 | 30.11±0.043 | 81.06±1.14 |
#Results are shown as mean±SD (n=3)
Table 4: Mean Particle Size, Percent Yield, Entrapment Efficiency, Drug Loading and In Vitro Release For All Batches
The percentage yield of F1 to F6 was found between 83.27±0.45 to 87.32±0.63 %. Percentage drug entrapment efficiency of F1 to F6 was found between 74.87±0.083 to 79.59±0.039 %. Percentage drug loading efficiency of F1 to F6 was found between 29.66±0.069 to 32.49±0.029 %. All values are shown in Table 4.
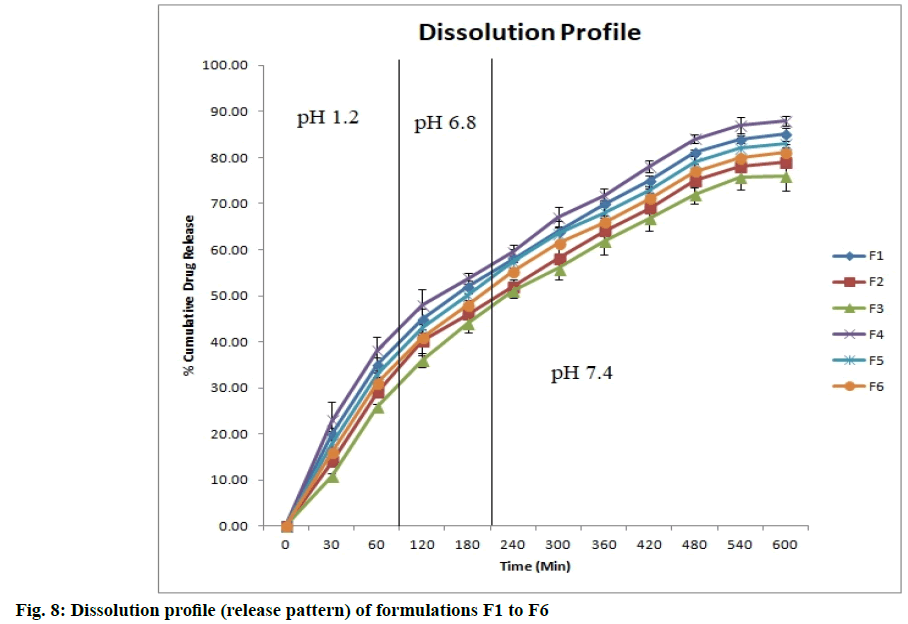
The drug release profiles were found to be dependent on the concentration of crosslinking agent and polymer ratio. The different formulation exhibits different drug release pattern. Formulation F1 to F6 show sustained release of drug for 10 h. Fig. 8 (n=3) shows the release profiles of different formulations.
Zero order plots were obtained by plotting percentage release against time and first order plot by log percent remaining against time. The Higuchi plot was obtained by plotting percentage release against square root of time and Korsmeyer peppas by plotting cumulative percentage drug release against square root of time in h. Various models investigated for formulations, ranked in order of Higuchi>First order>Korsmeyer peppas>Zero order. Formulation batch (F4) has highest regression coefficient for Higuchi model, showing fickian diffusion. Kinetic model Higuchi and first order model fitted better than Korsmeyer peppas and Zero order. The in vitro drug release of batch F1 to F6 were best explained by Higuchi models due to diffusion mechanism of drug release from polymeric matrix system. The values were shown in Table 5.
| Formulation code | Zero order kinetics | Korsmeyer peppas model | Higuchi model | First order kinetics | |||
|---|---|---|---|---|---|---|---|
| R2 | K0 | R2 | n | R2 | R2 | K1 | |
| F1 | 0.8019 | 10.03 | 0.85 | 0.179 | 0.9889 | 0.9545 | 0.363 |
| F2 | 0.835 | 9.354 | 0.877 | 0.154 | 0.9953 | 0.959 | 0.421 |
| F3 | 0.868 | 9.301 | 0.905 | 0.149 | 0.9996 | 0.9719 | 0.481 |
| F4 | 0.7752 | 10.17 | 0.829 | 0.188 | 0.9807 | 0.9456 | 0.319 |
| F5 | 0.8204 | 9.975 | 0.865 | 0.175 | 0.9933 | 0.9604 | 0.393 |
| F6 | 0.833 | 9.747 | 0.876 | 0.165 | 0.9958 | 0.963 | 0.413 |
Table 5: Drug Release Kinetics Model Fitting (R2) Of Batches F1 to F6
The microspheres coated with eudragit S100 show better release compared to uncoated microspheres. There was minor drug release during first 4 h and high release was seen in next 6 h. The comparative release profile of formulation batch F1 and F4 was represented in fig. 9. From the results of stability studies (Table 6), similarity factor was calculated. The similarity factor was found to be 85.80. It suggests the similarity as the f2 value exceeds 50. Similarity factor is used when dissolution profile has more than four time periods.
| Parameters | Initial | After 90 d |
|---|---|---|
| % Drug entrapment | 79.59±0.039 | 78.23±0.023 |
| % Cumulative drug release | 88.32±1.68 | 89.48±1.29 |
Table 6: Stability Study Data of Formulation Batch (F8)
The chitosan loaded EGCG microsphere could be prepared by o/w emulsion cross linking method. The prepared microsphere exhibit good release profile owing to the small particle size, which might help better absorption. The EGCG release from microspheres was extended up to 10 h. The drug release depends upon the concentration of polymer. GA plays the role of antioxidant and stabilizer in polyelectrolyte complexes due to its unique surface property and ability to attain lower viscosity at a higher concentration in solution compared to other polysaccharides. Glutaraldehyde has been supposed to act as an antioxidant and cytoprotective agent. The microspheres were filled in to the capsule (No. 4) to make them a single unit dosage form.
Acknowledgements:
The authors also thankAPMC College of Pharmaceutical Education and Research, managed by Himatnagar Kelavani Mandal (Himatnagar, India) for rendering the facilities for the experimental work.
Conflict of Interest:
The authors declare that there is no conflict of interest.
References
- Nagle DG, Ferreira D, Zhou YD. Epigallocatechin-3-gallate (EGCG): chemical and biomedical perspectives. Phytochemistry 2006;67(17):1849-55.
- Koch W, Kukula-Koch W, Komsta ?, Marzec Z, Szwerc W, G?owniak K. Green tea quality evaluation based on its catechins and metals composition in combination with chemometric analysis. Molecules 2018;23(7):1689.
- Miyazawa T. Absorption, metabolism and antioxidative effects of tea catechin in humans. Biofactors 2000;13(4):55-9.
- Fu QY, Li QS, Lin XM, Qiao RY, Yang R, Li XM, et al. Antidiabetic effects of tea. Molecules 2017;22(5):849.
- Cavet ME, Harrington KL, Vollmer TR, Ward KW, Zhang JZ. Anti-inflammatory and anti-oxidative effects of the green tea polyphenol epigallocatechin gallate in human corneal epithelial cells. Mol Vis 2011;17:533-42.
- Oz HS, Chen TS, McClain CJ, de Villiers WJ. Antioxidants as novel therapy in a murine model of colitis. J Nutr Biochem 2005;16(5):297-304.
- Xiang LP, Wang A, Ye JH, Zheng XQ, Polito CA, Lu JL, et al. Suppressive effects of tea catechins on breast cancer. Nutrients 2016;8(8):458.
- Roberto BS, Macedo GA, Macedo JA, Martins IM, Nakajima VM, Allwood JW, et al. Immobilized tannase treatment alters polyphenolic composition in teas and their potential anti-obesity and hypoglycemic activities in vitro. Food Funct 2016;7(9):3920-32.
- Zhong Z, Dong Z, Yang L, Chen X, Gong Z. Inhibition of proliferation of human lung cancer cells by green tea catechins is mediated by upregulation of let-7. Exp Ther Med 2012;4(2):267-72.
- Larsen CA, Bisson WH, Dashwood RH. Tea catechins inhibit hepatocyte growth factor receptor (MET kinase) activity in human colon cancer cells: kinetic and molecular docking studies. J Med Chem 2009;52(21):6543-5.
- Yang F, Oz HS, Barve S, de Villiers WJ, McClain CJ, Varilek GW. The green tea polyphenol (-)-epigallocatechin-3-gallate blocks nuclear factor-kappa B activation by inhibiting I kappa B kinase activity in the intestinal epithelial cell line IEC-6. Mol Pharmacol 2001;60(3):528-33.
- Peng G, Dixon DA, Muga SJ, Smith TJ, Wargovich MJ. Green tea polyphenol (-)-epigallocatechin-3-gallate inhibits cyclooxygenase-2 expression in colon carcinogenesis. Mol Carcinog 2006;45(5):309-19.
- Narumi K, Sonoda JI, Shiotani K, Shigeru M, Shibata M, Kawachi A, et al. Simultaneous detection of green tea catechins and gallic acid in human serum after ingestion of green tea tablets using ion-pair high-performance liquid chromatography with electrochemical detection. J Chromatogr B 2014;945:147-53.
- Lambert JD, Lee MJ, Lu H, Meng X, Hong JJ, Seril DN, et al. Epigallocatechin-3-gallate is absorbed but extensively glucuronidated following oral administration to mice. J Nutr 2003;133(12):4172-7.
- Cai Y, Anavy ND, Chow HS. Contribution of presystemic hepatic extraction to the low oral bioavailability of green tea catechins in rats. Drug Metab Dispos 2002;30(11):1246-9.
- Krook MA, Hagerman AE. Stability of polyphenols epigallocatechin gallate and pentagalloyl glucose in a simulated digestive system. Food Res Int 2012;49(1):112-6.
- Zhang L, Zheng Y, Chow MS, Zuo Z. Investigation of intestinal absorption and disposition of green tea catechins by Caco-2 monolayer model. Int J Pharm 2004;287(1-2):1-2.
- Krupkova O, Ferguson SJ, Wuertz-Kozak K. Stability of (-)-epigallocatechin gallate and its activity in liquid formulations and delivery systems. J Nutr Biochem 2016;37:1-12.
- Fangueiro JF, Parra A, Silva AM, Egea MA, Souto EB, Garcia ML, et al. Validation of a high performance liquid chromatography method for the stabilization of epigallocatechin gallate. Int J Pharm 2014;475(1):181-90.
- Chen ZY, Zhu QY, Wong YF, Zhang Z, Chung HY. Stabilizing effect of ascorbic acid on green tea catechins. J Agric Food Chem 1998;46:2512-6.
- Avadi MR, Sadeghi AM, Mohammadpour N, Abedin S, Atyabi F, Dinarvand R, et al. Preparation and characterization of insulin nanoparticles using chitosan and Arabic gum with ionic gelation method. Nanomedicine 2010;6(1):58-63.
- Al-Yahya AA, Al-Majed AA, Gado AM, Daba MH, Al-Shabanah OA, El-Azab AS, et al. Acacia Senegal gum exudate offers protection against cyclophosphamide-induced urinary bladder cytotoxicity. Oxid Med Cell Longev 2009;2(4):207-13.
- Dube A, Ng K, Nicolazzo JA, Larson I. Effective use of reducing agents and nanoparticle encapsulation in stabilizing catechins in alkaline solution. Food Chem 2010;122(3):662-7.
- Dube A, Nicolazzo JA, Larson I. Chitosan nanoparticles enhance the plasma exposure of (−)-epigallocatechin gallate in mice through an enhancement in intestinal stability. Eur J Pharm Sci 2011;44(3):422-6.
- Park SY, Lee BI, Jung ST, Park HJ. Biopolymer composite films based on κ-carrageenan and chitosan. Mater Res Bull 2001;36(3-4):511-9.
- Kulkarni GT, Gowthamarajan K, Suresh B. Stability testing of pharmaceutical products: an overview. Ind J Pharm Educ 2004;38(4):24-30.
