- *Corresponding Author:
- M. A. Raval
Ramanbhai Patel College of Pharmacy, Charotar University of Science and Technology, Changa, Gujarat 3884241, India
E-mail: mananraval.ph@charusat.ac.in
| Date of Received | 21 February 2020 |
| Date of Revision | 06 December 2021 |
| Date of Acceptance | 30 November 2022 |
| Indian J Pharm Sci 2022;84(6):1544-1555 |
This is an open access article distributed under the terms of the Creative Commons Attribution-NonCommercial-ShareAlike 3.0 License, which allows others to remix, tweak, and build upon the work non-commercially, as long as the author is credited and the new creations are licensed under the identical terms
Abstract
Curcumin, demethoxy curcumin and bis-demethoxy curcumin were isolated from the dried root powder of Curcuma longa through the combined application of flash chromatography and open column chromatography. Isolated constituents were identified using spectral methods. An analytical method was developed for simultaneous quantitative estimation of curcuminoids from fast dissolving tablets containing ethanolic extract of Curcuma sp., as an active ingredient. The separation was achieved in a C18 column using an isocratic mobile phase comprised of acetonitrile:water (aqueous phase containing 4 % v/v glacial acetic acid) (50:50 % v/v), with the flow rate set at 2.0 ml/min. The chromatogram was recorded at 425 nm, using a photodiode array detector. The developed analytical method was validated as per international conference on harmonisation guidelines. The developed analytical method was found to be linear in the concentration range of 5-120 μg/ml, precise and robust to minor modifications in selected chromatographic parameters. The average of recovery was found within the range of 98 %-102 %. Limit of detection and limit of quantification value for curcumin was determined to be 0.35 and 1.06, respectively. The tablets containing 100 mg Curcuma ethanolic extract were formulated using the directly compressible vehicle. Each tablet was found to contain 20.77 %±0.22 % w/w curcumin, 3.18 %±0.03 % w/w demethoxy curcumin and 0.33 %±0.006 % w/w bis-demethoxy curcumin when estimated using developed analytical method.
Keywords
Flash chromatography, open column chromatography, high performance liquid chromatography separation of curcuminoids
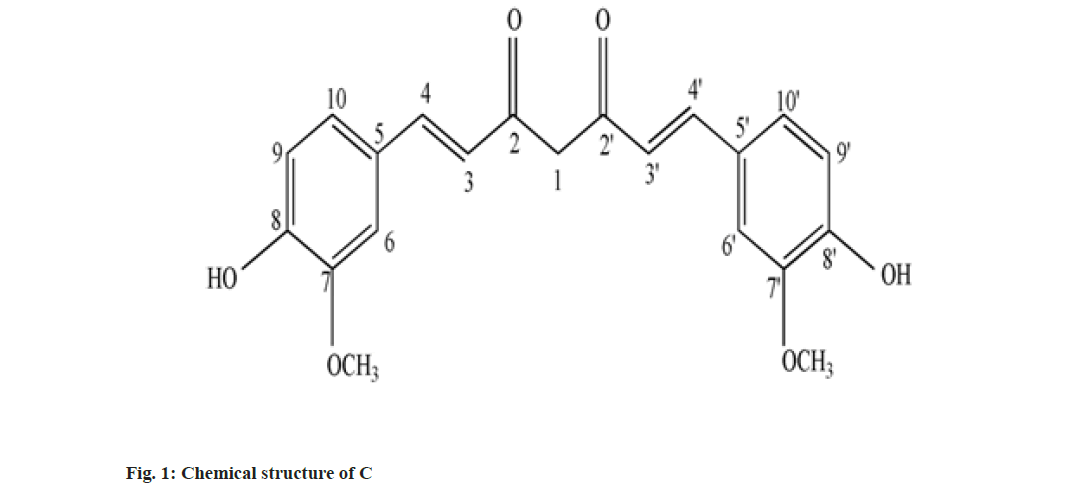
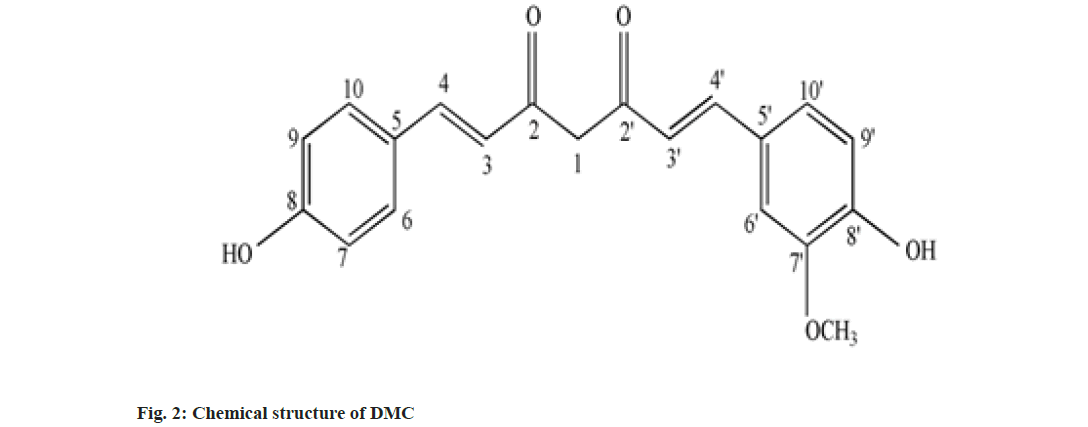
Curcumin (C), Demethoxy Curcumin (DMC) and Bis-Demethoxy Curcumin (BDMC) are few of curcuminoids present in plants of Curcuma sp. belonging to Zingiberaceae family. C has been reported to present in predominantly higher concentration and commercially obtained from Curcuma sp.,[1]. C is a phenolic compound and largely responsible for the color of turmeric. It is chemically diaryl heptanoid. IUPAC name of C is (16,6E)-1,7-bis (4-hydroxy-3-methoxy phenyl)-1,6- heptadiene-3,5-dione[2]. DMC and BDMC are natural demethoxy derivatives of C[3]. Chemical structure of C, DMC and BDMC is shown in fig. 1-fig. 3, respectively. These constituents are orange to yellow crystalline solid at room temperature and reported to be soluble in methanol but insoluble in water[4]. Anti-oxidant, anti-inflammatory, antidermatoris, anthelmintic, wound healing and adjuvant to cancer therapy is few of the therapeutic indications for Curcuma sp.,[5]. C and natural derivatives of C were found responsible for these activities of Curcuma sp.,[1]. Curcuma extract is incorporated in many therapeutic formulations due to its diversified therapeutic applications. Curcuminoids are also used as a colorant in pharmaceuticals as well as food industries[6]. Few procedures have been reported to isolate C included extracting the roots and rhizomes of Curcuma sp., using organic solvent followed by column chromatography[7,8]. The process of isolation of C, as well as other curcuminoids has been reported[8]. C is reported to be isolated using basified water and precipitated following acidification and purified using recrystallization from ethanol[9]. Curcuminoids were also isolated using vacuum column chromatography followed by flash chromatography[10]. Fast dissolving tablets, containing ethanolic extract of Curcuma, were prepared after optimizing the formula in the institute. The weight of each tablet was within the range of 600 to 602 mg and each tablet contained 100 mg, C extract supplied by M/s Pharmanza Herbal Pvt LTD. India. Literature survey revealed that several analytical methods were reported for estimation of C[4,11,12]. Few analytical methods were reported to estimate C as well as individual curcuminoids too[13-17]. These High Performance Liquid Chromatography (HPLC) based analytical methods could achieve the separation of curcuminoids, using gradient mobile phase. The analytical methods could separate peaks corresponding to C, DMC and BDMC using isocratic solvent mixture, but when implemented; yielded poor separation in estimating C, DMC and BDMC from the tablet matrix[15,18]. This might be attributed to the presence of excipients in the matrix. The analytical method reported to estimate C, DMC and BDMC suggested the use of tetra hydro furan as one of the solvents[13]; damaged the plastic tubing as well as stationary phase of the column, when employed for the purpose.
The experiments were planned to isolate C, DMC and BDMC using flash chromatography, characterize them using spectral methods and to develop and validate analytical method based upon isocratic elution of constituents using HPLC, for quantitative estimation of individual curcuminoids from the tablets.
Materials and Methods
Chemicals:
All the solvents used for extraction and column chromatography were of Analytical Research (AR) grade, and procured from Ms. Loba Chemie, Mumbai, India. The solvents were distilled at respective boiling point and stored in airtight amber colored glass bottles. Thin Layer Chromatographic (TLC) plates were procured from Ms. Merk INC. (Silica Gel G 60 F 254, aluminium packed silica plates, 200 mm×200 mm, Merk, Catalog No. 1003900001). Solvents used for HPLC analysis were of HPLC grade and procured from Ms. Merk INC. Silica Gel for column chromatography (60-120 #) was procured from Ms. Loba Chemie, Mumbai, India and used as stationary phase in column chromatographic separations.
Isolation of C, DMC and BDMC from extract:
Isolation of curcuminoids from methanolic extract: The plant was collected from the medicinal plant garden of Ramanbhai Patel College of Pharmacy, in the month of May and identified as Curcuma longa (C. longa) by Taxonomist at J and J College of Science, Nadiad, Gujarat, India. The voucher specimen was submitted in Department of Pharmacognosy, Ramanbhai Patel College of Pharmacy, wide number RPCP/2016/PP/CUR. The rhizomes were separated from the collected plants and washed with distilled water to remove adhering soil particles. The material was dried under the shed for 10 d, cut into small pieces and powdered using a laboratory grinder. Coarse turmeric powder (250 g) was refluxed with hexane (AR) (750 ml) (50° for 3 h). The dried defatted powder was packed in Soxhlet extractor and extracted using methanol (750 ml) (60° until the solvent collected in the siphoned tube became colorless). The extract was filtered and concentrated (40°) to one third of original volume using rotary vacuum evaporator. The concentrated extract was evaporated to dryness using a water bath and stored in a desiccator. The whole set of experiments were performed in the diffused light area and desiccator contained extract was kept in the dried, dark area at room temperature.
Separation of curcuminoids using flash chromatography:
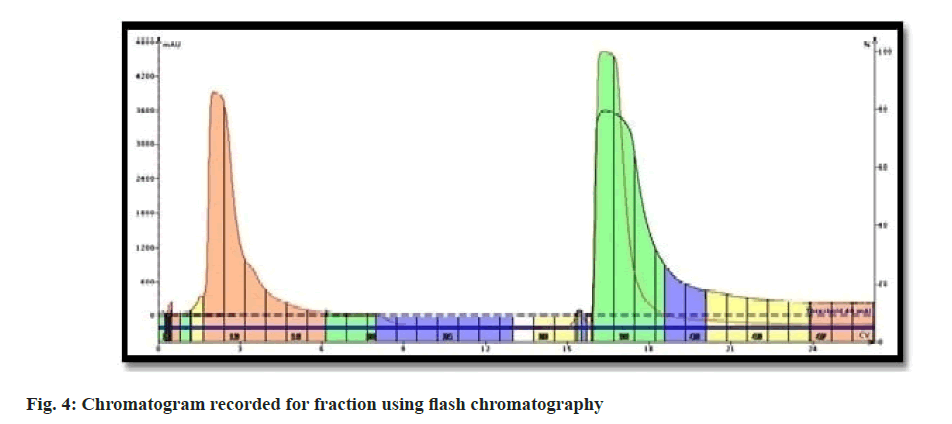
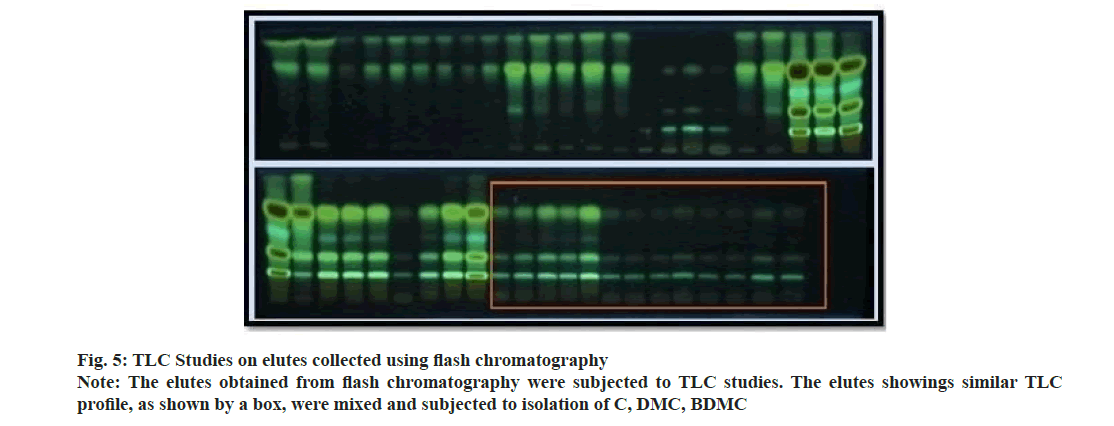
The resultant extract (5 gm) was dissolved in methanol (10 ml) and mixed with silica for column chromatography (1 g). This dried mixture was loaded in a pre-packed flash column (Biotage KPSil 50, Snap Column, 50 g) contained silica gel as a stationary phase. The system employed for separation was Biotage Isolera-I equipped with dual-channel Ultraviolet (UV) detector. The column was eluted using the solvent comprised of methanol (4 % v/v) in chloroform at the set flow rate of 10 ml/min. The proportion of methanol in the mobile phase and flow rate were finalized through pre-experiments. Elutes were monitored using a UV detector, set at 425 nm. The fractions were collected using a fraction collector (20 ml each). The chromatogram recorded using the flash chromatographic system. All collected fractions were concentrated (35°) using rotary vacuum evaporator and subjected to TLC analysis. The optimized mobile phase comprised of Chloroform:Methanol:Glacial acetic acid (9.4:0.4:0.1 v/v/v) and compounds were resolved on Silica Gel G coated TLC plates. Fractions showed similar TLC pattern were mixed together. The process of separation was repeated six times to collect a sufficient quantity of fraction for further processing.
Separation of curcuminoids using column chromatography:
The dried fraction (15 gm) obtained from flash chromatography was subjected to open column chromatography to isolate individual C, DMC and BDMC. The column was packed using silica gel (60- 120 #) for column chromatography (150 g) by pouring silica slurry prepared in chloroform. The column was eluted using a solvent comprising of chloroform with gradual increase in methanol content. The proportion of methanol to be used to separate an individual constituent was set by performing pre-experiments. The process was monitored continuously through TLC, moreover the fractions of elutes showed single spot on TLC were evaporated to dryness and subjected to purity assessment using HPLC. The compounds yielded one major peak in HPLC chromatogram was subjected to Infrared (IR), 1H-Nuclear Magnetic Resonance (NMR) and Mass Spectroscopy (MS).
Chemical characterization of isolated compounds:
IR spectroscopy: Isolated curcuminoids (about 5 mg) were ground individually with dried and finely powdered potassium bromide (IR grade) (100 mg). This mixture was pressed in a hydraulic press to form a translucent pallet to record the IR spectrum. The IR spectrum was recorded in a range of 4000-400 cm-1 using IR spectrophotometer (Nicolet 6700, thermos scientific, United States of America (USA)).
1H-NMR spectroscopy: 1H-NMR spectroscopy was performed using Advance III 400 MHz FT NMR (SICART, Sardar Patel University, Vallabh Vidyanagar, Gujarat, India). The compounds were dissolved in Deuterated dimethyl sulfoxide-d6 and subjected to 1H-NMR spectroscopy.
MS: Each isolated compound (5 mg) was dissolved in methanol (5 ml), individually. Mass spectroscopy was performed using Liquid Chromatography (LC)- MS system (Simadzu 8040 LC/MS/MS system, Saurashtra University, Rajkot, Gujarat, India). The optimized parameters for MS are ion spray voltage 5500 V; curtain gas 20 l/min; the temperature was room-temperature; nebulizing gas flow 20 l/ min; focusing potential 400 v; collision activated dissociation gas flow was 6 l/min. The sample solution was infused using a Hamilton syringe into MS spectrometer to record the MS spectrum.
HPLC method:
Preparation of standard stock solution: Accurately weighted quantity (10 mg) of C, DMC and BDMC was dissolved, individually, in methanol (5 ml) using sonication at room temperature. The solution was diluted using methanol to prepare standard stock solution (1000 μg/ml).
Preparation of combined working standard solution: Different aliquots of standard stock solutions of C, DMC and BDMC were quantitatively transferred in a volumetric flask and diluted using methanol to produce different dilutions in the range of 5 μg/ml to 120 μg/ml for C, DMC and BDMC in individual solution.
Preparation of sample solution: Tablets containing ethanolic extract of C. longa were grounded manually using mortar and pestle to a fine powder. Accurately weighed quantity (50 mg) of the powder was transferred to a volumetric flask containing methanol (25 ml). The mixture was sonicated for 10 min and diluted using methanol to prepare sample solution (1000 μg/ml). The resultant mixture was filtered using Whatman filter paper and was used to estimate DMC. The aliquot of this solution was diluted using methanol and resultant solution (100 μg/ml) was used to estimate the amount of C. Accurately weighed (25 mg) quantity of the powdered tablet was dissolved in methanol (5 ml) and diluted using methanol (2500 μg/ml). The resultant mixture was filtered and used to estimate the amount of BDMC.
Development and optimization of HPLC method:
HPLC method for quantitative estimation of C, DMC and BDMC was developed by modifying the reported analytical method for estimation of C from C. longa extract[1,2]. The chromatographic conditions were optimized through trial and error approach to yield three distinct Gaussian peaks; each corresponding to C, DMC and BDMC at RT less than 10.0 min.
System Suitability Parameters (SSP):
SSP were evolved for the peak corresponding to C, DMC and BDMC. Repeatability (measuring percentage Relative Standard Deviation (% RSD), individually, for the peak of C, DMC, BDMC after injecting a combined standard solution containing 30 μg/ml each, C, DMC and BDMC), capacity factor, resolution and tailing factor were selected as SSP.
HPLC method validation:
Newly developed and optimized HPLC method was subjected to analytical method validation by adopting the methodology proposed in International Conference on Harmonisation (ICH) guidelines[19]. Linearity, precision, accuracy, sensitivity, selectivity and robustness were established for C, DMC and BDMC.
Linearity:
Linearity was established using a series of the combined standard solution. Each concentration was injected for six times and the chromatograms were recorded. A calibration curve was constructed by plotting average peak area for respective concentration of C, DMC and BDMC, individually, using the least square equation. The average value of correlation coefficient (r2), y-intercept (c) and slope of the calibration curve (m) were calculated.
Precision:
Three selected concentrations of combined standard solution (10, 60 and 90 μg/ml), were subjected to intra-day and inter-day precision studies. The fixed volume was injected and chromatogram was recorded by following optimized chromatographic conditions. Each concentration was injected for six times in a day for determining intra-day precision and once daily for consecutive 6 d for determining inter-day precision. % RSD value was determined for peak area corresponding to C, DMC and BDMC.
Accuracy:
The accuracy of the analytical method was determined by performing recovery studies. The recovery studies were performed by adopting the standard addition method. The studies were carried out at three levels of the working concentration of the analytes. A known amount of C, DMC and BDMC, individually, was spiked in pre-analyzed sample solution and the amount of respective curcuminoids was determined from peak area. The average recoveries were calculated and reported as average with % RSD.
Selectivity:
The selectivity of analytical method was established by measuring peak purity angle for respective peak. Peak purity angle and peak threshold were determined using EmpowerTM software. The value obtained for peak purity angle and peak purity threshold for peak corresponding to C, DMC and BDMC were used to ensure the selectivity.
Sensitivity:
The sensitivity of the developed method was evolved in form of Limit of Detection (LOD) and Limit of Quantification (LOQ). Value of LOD and LOQ for each analytes was evolved initially from by measuring signal to noise ratio for the peak corresponding to C, DMC and BDMC. LOD and LOQ were finally determined using the mathematical formula involving standard deviation of the response (standard deviation of y-intercept) and the slope of the calibration curve for the respective analytic.
Robustness:
Robustness studies were performed by introducing deliberate alterations in selected chromatographic parameters. Selected parameters included change in the proportion of water in mobile phase (±2 %); change in % glacial acetic acid in water (±0.1 %); change in flow rate (±0.2 ml). The studies were performed by incorporating alteration in one selected chromatographic parameters at a time. Each chromatogram was recorded for three times and area for peak corresponding to C, DMC and BDMC as well as respective Retention Time (RT) value was noted for each set of experiment and datasets were prepared. Effect of alterations on selected dependent variables was assessed by determining the statistical significance in the different of the mean value for a response obtained after incorporating alteration, with those received after following optimized chromatographic conditions. Statistical significance was determined using analysis of variance. p≤0.05 was selected as a level of significance.
Results and Discussion
Curcuma powder was defatted using hexane to remove fatty constituents. Methanolic extract of Curcuma was introduced to flash chromatography to separate the curcuminoids. The series of experiments suggested that the gradient of methanol was required to separate individual curcuminoid was too low. Due to comparatively higher flow rate and owing to the similarity in chemical structure; the curcuminoids could not be retained on the stationary phase and came out as a mixture of three constituents. The chromatogram recorded using flash chromatographic system (fig. 4) showed distinct zones, but could not be able to separate individual constituents. Elutes collected were subjected to TLC analysis to ensure the chemical homogeneity (fig. 5). The fractions yielded similar pattern on TLC were pooled, concentrated and was subjected to open column chromatography. Being non-polar constituents, curcuminoids were subjected to separation using silica gel for column chromatography (60-120 #) as a stationary phase.
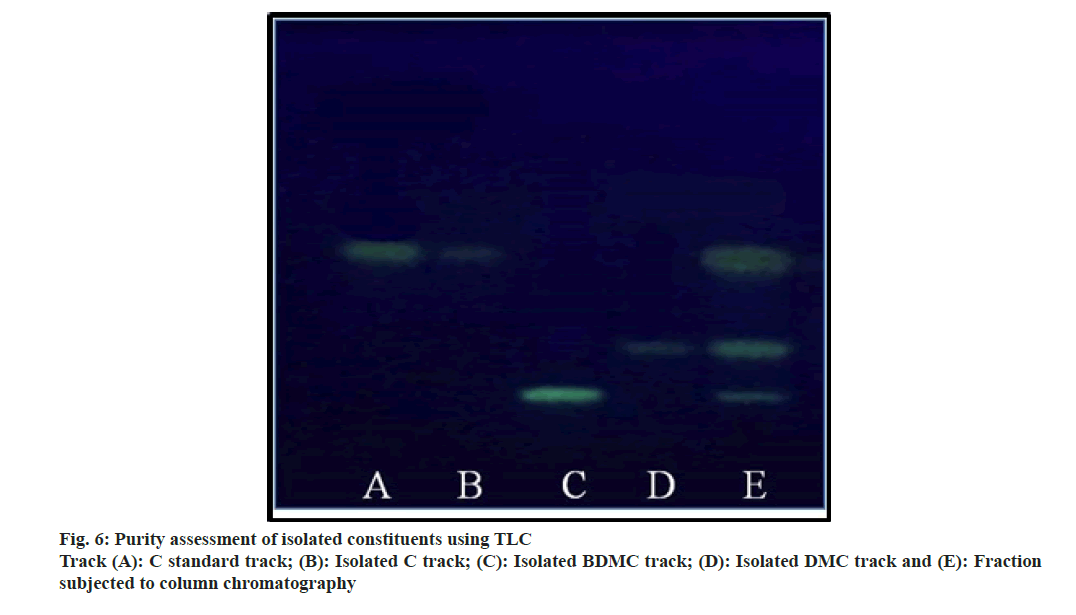
The ratio for the amount of stationary phase to analytic mixture was kept high to avoid overloading of the column. The column was eluted initially using chloroform with careful increment in the proportion of methanol. Column yielded 3.55 g C (0.1 % v/v methanol in chloroform), 1.59 g DMC (1.5 % v/v methanol in chloroform) and 1.08 g BDMC (3.0 % v/v methanol in chloroform). Being the least polar amongst all the three analytes; BDMC was retained by silica, and eluted at last with a higher proportion of methanol. The compounds yielded single spot on TLC plate (fig. 6), confirmed the purity of compounds. The purity of the compounds was ensured using HPLC at the later stage.
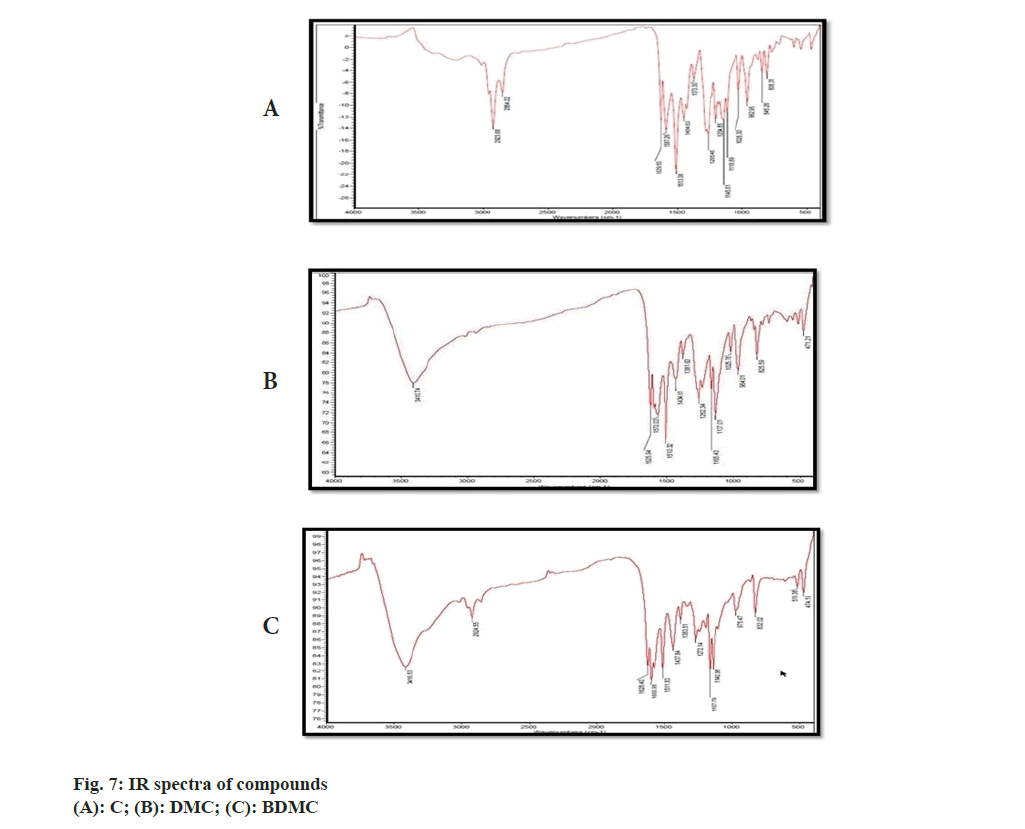
IR, 1H-NMR and a MS spectrum of C was reported in compendia (Tandon 2010). The recorded IR, 1H-NMR and MS spectra were compared with reported spectral data. Recorded IR spectra of C (fig. 7A) showed a broad stretch at 3600 cm-1; corresponding to –OH stretch. Aromatic C-H stretch was noted between 3100-3000 cm-1. Though, this stretch could not be separated from aliphatic C-H stretch expected to be present in IR spectra of C. Conjugation C=O with C=C delocalizes pi-electrons from both the groups and reduces double bond characteristics of C=O bond, which resulted in absorption of C-O at lower wave number. C-O stretch for ketone was not observed at the wave number 1720 cm-1; instead a stretch appeared at 1629 cm-1 might be attributed to enolized C=O due to conjugation with C=C. C-O-C (assay) and C-O-C (sym) stretch appeared, respectively, at 1247 cm-1 and 1040 cm-1[20]. Stretch corresponding to C-O-C was attributed to the presence of methoxy group attached to the aromatic ring. The major stretches in recorded IR spectra of C matched with reported IR spectra of C (Tandon 2010). There were no stretches, corresponding to, C-O-C observed in recorded IR spectra of BDMC (fig. 7B) confirmed the absence of methoxy groups, while the C-O-C stretch was observed in IR spectra of DMC (fig. 7C).
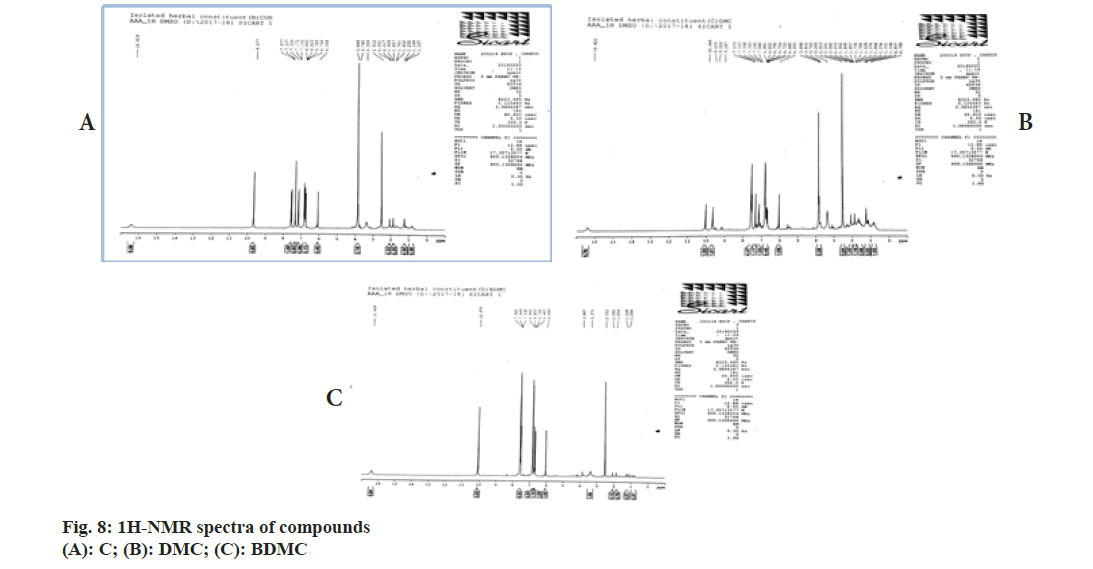
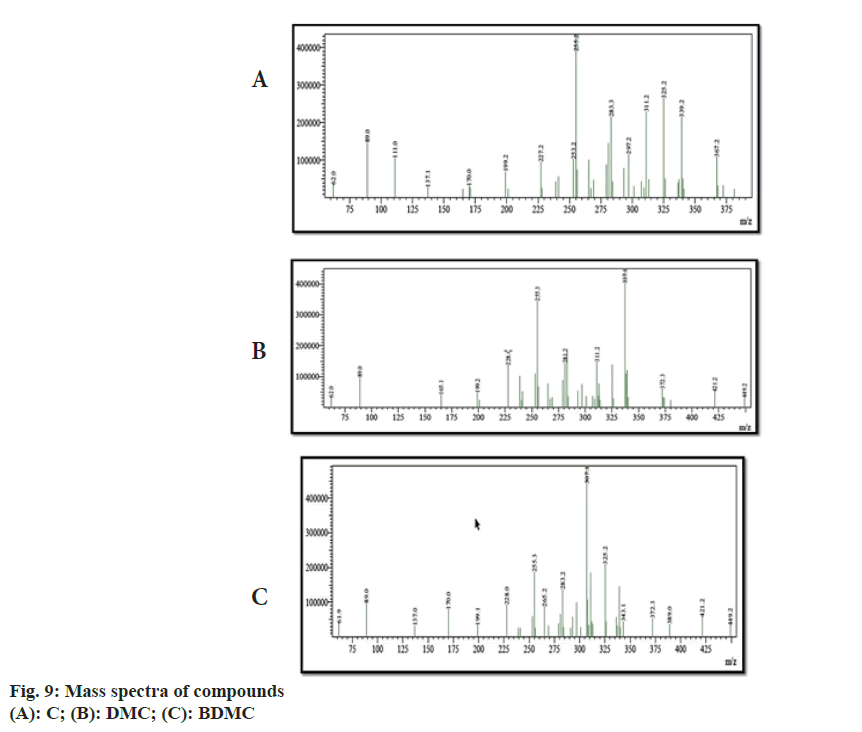
Chemical shift for signals corresponding to different protons (hydrogen) was noted for recorded 1H-NMR spectra of C, DMC and BDMC (fig. 8A-fig. 8C). Peak at δ value 3.84 (6H, s) was corresponding to Methylthaizolo (-OCH3). Peak at 6.06 (2H, s) was attributed to C1H and C’1H. C3H and C’3H peak appeared at δ value 6.74 (2H, d, J=16 Hz). C9H (Aromatic) and C’9H (Aromatic) appeared at 6.82 (2H, d, J=8 Hz), while signal at δ value 7.15 (2 h, d, J=8 Hz) showed presence of C10H (Aromatic) C’10H (Aromatic). C6H (Aromatic) and C’6H (Aromatic) appeared at δ value 7.33. C4H (Alkene) and C’4H (Alkene) appeared at 7.53 (2H, d, J=16 Hz). Hydrogen of OH appeared at δ 9.67 (2H, s). 1H-NMR spectra of DMC showed a peak at δ value 3.81 (3H, s). This was corresponding to hydrogen present in one methoxy group, confirmed removal of one methoxy group, as compared to C. It also showed an additional peak at 6.68 (1H, d, J=16 Hz), corresponding to C7H. Probably, this was the place in C, where methoxy group was present. This led to two different signals for H of hydroxyl group in C. One signal was observed at 9.67 corresponding to a hydrogen of the shielded hydroxyl group, adjacent to methoxy group, while a signal at 10.06 corresponding to a hydrogen of de-shielded hydroxyl group, adjacent to C7 of C. This was the place from where methoxy group was removed in DMC. 1H-NMR spectra for BDMC showed no signal for methoxy hydrogen, while only one signal at 10.06 corresponding to de-shielded hydrogen of hydroxyl group. Recorded mass spectra showed molecular ion peak at m/z=367.2 for C, 337.1 for DMC and 307.1 for BDMC (fig. 9A-fig. 9C). The spectral studies confirmed that, isolated compounds were indeed C, DMC and BDMC.
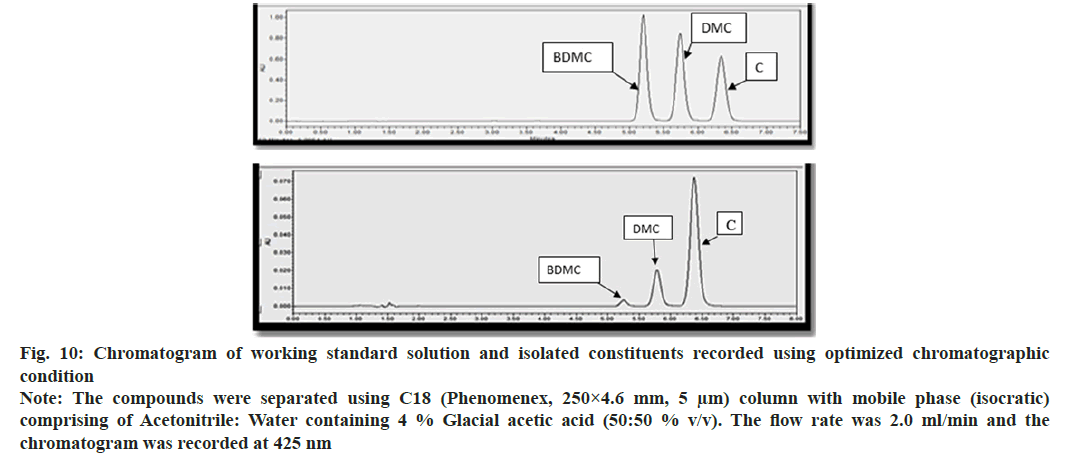
Trial and error approach was adopted for modifying reported analytical method; yielded acceptable resolution for the peak corresponding to C, DMC and BDMC, when the mobile phase was acetonitrile:water containg 4 % Glacial Acetic Acid (GAA) (50:50 v/v). The flow rate was 2 ml/min and detection wavelength was 425 nm (Table 1). While optimizing the chromatographic conditions, it was observed that increase in the proportion of acetonitrile decreased RT of peak corresponding each to C, DMC and BDMC, while an increase in flow rate, suppressed the value of RT corresponding to C, DMC and BDMC. Amount of GAA was critical for sharpness and plate number, while the proportion of acetonitrile was optimal for RT. The relative amount of acetonitrile and water was needed for achieving reported resolution and capacity factor. Optimized chromatographic method showed three distinctly resolved, sharp, gaussian peaks, each corresponded to C, DMC and BDMC (fig. 10A and fig. 10B). It was observed that RT of C and DMC was 6.42 min 5.68 min respectively, while RT of BDMC was 5.21 min. System suitability tests were performed to ensure the adequacy of the analytical method to estimate C, DMC and BDMC (Table 2).
| Parameter | Optimized condition |
|---|---|
| Mobile phase | Acetonitrile:water containing 4 % Glacial acetic acid (50:50 % v/v) |
| Stationary phase | C18 (Phenomenex, 250×4.6 mm, 5µm) |
| Concentration | 100 µg/ml |
| Flow rate | 2 ml/min |
| Run time | 10 min |
| Detection wavelength | 425 nm |
Table 1: Optimized Chromatographic Conditions
Fig. 10: Chromatogram of working standard solution and isolated constituents recorded using optimized chromatographic condition
Note: The compounds were separated using C18 (Phenomenex, 250×4.6 mm, 5 μm) column with mobile phase (isocratic) comprising of Acetonitrile: Water containing 4 % Glacial acetic acid (50:50 % v/v). The flow rate was 2.0 ml/min and the chromatogram was recorded at 425 nm
| S.no | Parameter | Value determined | Recommended value | ||
|---|---|---|---|---|---|
| C | DMC | BDMC | |||
| 1 | Reproducibility | 0.3 | 0.34 | 0.38 | RSD less than 1 % |
| 2 | Capacity factor | 4.85 | 5.45 | 6.11 | Greater than 2.0 |
| 3 | Number of plates | 11880 | 4897 | 2158 | Greater than 2000 |
| 4 | Resolution | 1.087 | 0.895 | --- | Greater than 2.0 |
| 5 | Tailing factor | 1.07 | 1.09 | 1.12 | Less than 1.5 |
Table 2: System Suitability Parameters for Peak Corresponding to C, Dmc And Bdmc in Sample Solution
The repeatability was ensured from the low % RSD value for the peaks corresponding to the analytes. Capacity factor was maximum for C and minimum for BDMC. Capacity factor for BDMC was near to five, ensured that appropriate time duration was provided to the analytic to interact with stationary phase. Number of theoretical plate was more than two thousand in case of BDMC, which was the lowest amongst all three analytes. Nonetheless, higher Number of plates for analytes suggested narrower and sharp peak, which was evident from the chromatogram. The resolution of a peak from nearby peaks is the function of theoretical plates. Though, resolution for DMC and C was found less than recommended, sharp and narrow peaks pose no issue of separation in the sample solution, especially during accuracy studies. While, optimizing the chromatographic conditions, it was revealed that lowering flow rate yielded resolution more than 1.5, but at that time capacity factor was high and RT of C peak was near to 15 min. Higher plate numbers ensured that the efficient separation could be achieved with the lower value of resolution with the reduced chromatographic run time. Tailing factor value 1.12 was the highest for BDMC peak. This suggested that the peaks obtained were symmetric and heights of the peak was appropriate as well as the packing of the column was not disturbed at the time of experimentation.
The developed analytical method was validated according to ICH Q2 (R1) guideline to ensure the performance of an analytical method for the purpose. Linearity was evolved over a concentration range of 5-120 μg/ml. The line equation was derived using the least square regression analysis. Regression coefficient (r2) was determined and found to be approached to 1.0. Regression coefficient approached to 1.0 and low value of y-intercept confirmed linearity (Table 3). % RSD value for inter-day variation for each analyte at all selected concentration level, was higher than corresponding intra-day variation (Table 4). However, lower the value of deviation in the area of the peak corresponding to the analytes suggested the precision of the developed analytical method. Percentage recovery for C, DMC and BDMC was found near to 100 % (Table 5) confirmed that the developed analytical method was accurate and free from the interference of other material used in formulation. Selectivity of analytical method was established through comparing peak purity angle and peak purity threshold for a peak. Purity threshold accounts for the presence of mobile phase induced spectral changes when purity angle exceed value of purity threshold it indicates presence of impurity in peak spectra. The value of purity angle corresponding to each peak of interest was found lesser than value of peak purity threshold (Table 6), suggested spectrally homogenous peak corresponding to C, DMC and BDMC. The studies indicated that LOD of C was 0.35 μg/ml while that for DMC and BDMC was 1.29 μg/ml and 0.89 μg/ml, respectively. LOQ value was determined to be 1.06 μg/ml, 3.92 μg/ ml and 2.96 μg/ml. The developed method, thus, was sensitive enough to carry out the desired task. Robustness of an analytical method is a measure of its capacity to remain unaffected by small but deliberate variations in chromatographic parameters. The studies showed that the mean of the area and RT for peak corresponding to C, DMC and BDMC were not significantly different, for chromatograms recorded after incorporating the alterations in selected chromatographic parameters compared with those recorded following optimized chromatographic parameters. The studies showed that the developed method was robust for the alterations in selected chromatographic parameters within certain ranges. The developed analytical method was implemented to estimate C, DMC and BDMC simultaneously, from fast dissolving tablets showed, that a tablet contained 20.77 %±0.22 % w/w C, 3.81 %±0.03 % w/w DMC and 0.33 %±0.006 % w/w BDMC.
| Analyte | Concentration range (µg/ml) | Slope (m) Mean±SD | Confidence interval* | y-intercept (C) Mean±SD | Confidence interval* | Regression coefficient (r2) Mean±SD |
|---|---|---|---|---|---|---|
| C | 5.0-120.0 | 61406.81±329.06 | 263.3 | 47693.47±6684.53 | 41834.33-53552.61 | 0.9998±0.0004 |
| DMC | 77110.75±1044.47 | 835.74 | 125608.89±30279.32 | 99068.38-152149.4 | 0.9988±0.0006 | |
| BDMC | 79253.69±718.55 | 574.95 | 103677.6±21434.4 | 84889.2-122465 | 0.9981±0.0005 |
Table 3: Linearity Data for C, Dmc and Bdmc
Note: n=5; *95 % confidence interval; SD: Standard Deviation
| Concentration of analyte (µg/ml) | C | DMC | BDMC | |||
|---|---|---|---|---|---|---|
| Intra-day (% RSD) | Inter-day (% RSD) | Intra-day (% RSD) | Inter-day (% RSD) | Intra-day (% RSD) | Inter-day (% RSD) | |
| 10 | 0.14 | 1.36 | 0.08 | 1 | 0.06 | 1.5 |
| 30 | 0.3 | 1.54 | 0.34 | 0.58 | 0.38 | 0.25 |
| 90 | 0.79 | 1.25 | 0.67 | 0.8 | 0.85 | 0.52 |
Table 4: Precision of Analytical Method
Note: n=6
| S. no | Analyte | % Analyte spiked | Conc. of analyte determined in solution Average±SD (µg/ml) | % Amount Recovered±SD | Average recovery |
|---|---|---|---|---|---|
| 1 | C | 0 | 21.90±0.95 | --- | --- |
| 2 | ~50 | 32.16±0.33 | 106.06±3.30 | 102.94 | |
| 3 | ~100 | 41.81±0.27 | 101.25±1.36 | ||
| 4 | ~150 | 51.85±0.82 | 100.98±2.73 | ||
| 5 | DMC | 0 | 40.33±1.48 | --- | --- |
| 6 | ~50 | 60.69±0.78 | 101.81±3.93 | 100.9 | |
| 7 | ~100 | 80.50±0.58 | 100.44±1.45 | ||
| 8 | ~150 | 100.45±0.47 | 100.45±0.47 | ||
| 9 | BDMC | 0 | 8.16±0.04 | --- | --- |
| 10 | ~50 | 12.27±0.64 | 102.75±16.05 | 101.84 | |
| 11 | ~100 | 16.19±0.33 | 100.41±4.15 | ||
| 12 | ~150 | 20.45±0.42 | 102.38±3.57 |
Table 5: Accuracy Studies
Note: n=3
| Analyte | Peak purity angle | peak threshold |
|---|---|---|
| C | 1.484 | 1.521 |
| DMC | 0.264 | 0.27 |
| BDMC | 0.214 | 0.219 |
Table 6: Assessing Selectivity of Analytes
The mixture of curcuminoids was separated from methanolic extract of Curcuma plant powder using flash chromatography and three curcuminoids were isolated using column chromatography. The purity of isolated curcuminoids was ensured using TLC and the compounds were identified as C, DMC and BDMC through spectral studies. A precise, selective, accurate and robust analytical method was developed using isocratic mobile phase for simultaneous estimation of C, DMC and BDMC from fast dissolving tablet containing ethanolic extract of Curcuma as an active ingredient.
Conflict of interests:
The authors declared no conflict of interests.
References
- Gupta AK. Quality standards of Indian medicinal plants, 2003.
- Indian Pharmacopoeia, Controller of Publication, Govt. of India, Ministry of Health and Family Welfare, New Delhi; 2014.
- Tandon N. Phytochemical Reference Standards of Selected Indian Medicinal Plants. New Delhi: Indian Council of Medical Research; 2010.
- Indian Pharmacopoeia, Controller of Publication, Govt. of India, Ministry of Health and Family Welfare, New Delhi; 2001.
- Evans WC. Trease and Evans Pharmacognosy. 9th ed. London: Saunders Elsevier; 2002.
- Siddiqui, Anees A, Seemi S. Natural products chemistry practical manual. Delhi: CBS Publishers; 2012.
- Revathy S, Elumalai S, Antony MB. Isolation, purification and identification of curcuminoids from turmeric (Curcuma longa L.) by column chromatography. J Exp Sci 2011;2(7):21-5.
- Nabati M, Mahkam M, Heidari H. Isolation and characterization of curcumin from powdered rhizomes of turmeric plant marketed in Maragheh city of Iran with soxhlet technique. Quarterly J Ir Chem Commun 2014;2(4):236-43.
- Pawar H, Karde M, Mundle N, Jadhav P, Mehra K. Phytochemical evaluation and curcumin content determination of turmeric rhizomes collected from Bhandara District of Maharashtra (India). Med Chem 2014;4(8):588-91.
- Vitasari RA, Wibowo FR, Marliyana SD, Wartono MW. Isolation and identification of curcumin and bisacurone from rhizome extract of temu glenyeh (Curcuma soloensis. Val). IOP Conf Ser: Mater Sci Eng 2016;107(1):12063.
- Li J, Jiang Y, Wen J, Fan G, Wu Y, Zhang C. A rapid and simple HPLC method for the determination of curcumin in rat plasma: Assay development, validation and application to a pharmacokinetic study of curcumin liposome. Biomed Chromatogr 2009;23(11):1201-7.
[Crossref] [Google Scholar] [PubMed]
- Syed HK, Liew KB, Loh GO, Peh KK. Stability indicating HPLC–UV method for detection of curcumin in Curcuma longa extracts and emulsion formulation. Food Chem 2015;170(3):321-6.
- United State Pharmacopoeia Convention, United State Pharmacopoeia and National Formulary: United State Pharmacopoeia Volume IV; Rockville 2016.
- Jadhav BK, Mahadik KR, Paradkar AR. Development and validation of improved reversed phase-HPLC method for simultaneous determination of curcumin, demethoxycurcumin and bis-demethoxycurcumin. Chromatographia 2007;65(7):483-8.
- Chauhan SK, Singh BP, Agrawala S. Estimation of curcuminoids in Curcuma longa by HPLC and spectrophotometric methods. Indian J Pharm Sci 1999;61(1):58-60.
- Taylor SJ, McDowell IJ. Determination of the curcuminoid pigments in turmeric (Curcuma domestica Val) by reversed-phase high-performance liquid chromatography. Chromatographia 1992;34(1):73-7.
- Paramasivam M, Poi R, Banerjee H, Bandyopadhyay A. High-performance thin layer chromatographic method for quantitative determination of curcuminoids in Curcuma longa germplasm. Food Chem 2009;113(2):640-4.
- Péret-Almeida L, Cherubino AP, Alves RJ, Dufossé L, Glória MB. Separation and determination of the physico-chemical characteristics of curcumin, demethoxycurcumin and bisdemethoxycurcumin. Food Res Int 2005;38(8-9):1039-44.
- Silverstein, Robert M, Francis X, Webster, David J. Kiemle, David L. Bryce. Spectrometric identification of organic compounds. 8th ed. John Wiley sons; 2014.
- International Conference on Harmonization. Validation of analytical procedures: text and methodology Q2 (R1). In: International Conference on Harmonization; 1996.
- US Food and Drug Administration. Guidance for industry: analytical procedures and methods validation for drugs and biologics. US Food and Drug Administration. 2015.
