- *Corresponding Author:
- Mrinalini Damle
Department of Pharmacy, All India Shri Shivaji Memorial Society’s College of Pharmacy, Pune, Maharashtra 411001, India
E-mail: damle_mc@aissmscop.com
| Date of Received | 17 July 2023 |
| Date of Revision | 12 August 2024 |
| Date of Acceptance | 11 October 2024 |
| Indian J Pharm Sci 2024;86(5):1747-1755 |
This is an open access article distributed under the terms of the Creative Commons Attribution-NonCommercial-ShareAlike 3.0 License, which allows others to remix, tweak, and build upon the work non-commercially, as long as the author is credited and the new creations are licensed under the identical terms
Abstract
Deferasirox is used in the treatment of chronic iron overload due to blood transfusions. Many studies have reported the high-performance liquid chromatography, high-performance thin-layer chromatography and ultraviolet spectroscopic methods for the estimation of deferasirox. The current work is intended for the development of a stability indicating method by high-performance thin layer chromatography for the estimation of deferasirox. The chromatographic development was performed on aluminium plates coated with silica gel 60 F254 using chloroform:methanol:triethylamine (9:1:0.5 v/v/v) as the mobile phase. Densitometric scanning was achieved at the absorbance maxima 248 nm. Deferasirox was subjected to stress conditions like hydrolysis under different pH conditions, acid, alkali, oxidation, thermal and photolytic stress conditions. A well-separated band was observed with an retardation factor value of 0.44±0.03. The calibration curve plotted in the concentration range 250-1250 ng/band exhibited an excellent linear relationship with the coefficient of determination value of 0.9951. The method was found to comply with all the validation parameters as per the International Council for Harmonisation guidelines Q2(R1). This stability indicating method ensures a short analysis time compared to other reported analytical methods. This validated method can be used by quality control laboratories for monitoring the stability of deferasirox.
Keywords
Deferasirox, high-performance thin layer chromatography, densitometric, validation, hydrolysis
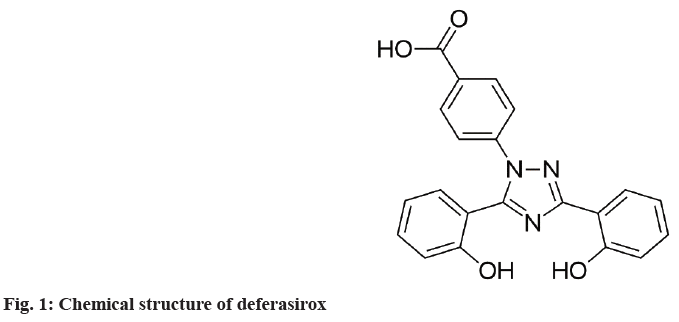
Deferasirox is used in the treatment of chronic iron overload due to blood transfusions. Deferasirox is an oral tridentate chelator that mobilizes iron stores by binding selectively to the ferric form of iron[1]. The chemical name of deferasirox is 4-[3,5-bis(2- hydroxyphenyl)-1,2,4-triazol-1-yl]benzoic acid[2]. Deferasirox is a white crystalline powder. Its molecular formula is C21H15N3O4 and its molecular weight is 373.46 g/mol. Its melting point is 116°-117°. It is soluble in methanol, and dimethylformamide[3]. The chemical structure of deferasirox is shown in fig. 1. It is an oral iron chelator with a long halflife, that can be given once daily because it provides 24 h chelation[4]. Its primary application is to reduce chronic iron overload in patients undergoing longterm blood transfusion for conditions such as betathalassemia and other chronic anaemias[5]. It is a tridentate ligand that binds iron with high affinity in a 2:1 ratio[6]. More than 700 adult and pediatric patients with transfusion-related iron overload and underlying thalassemia, sickle cell anemia, myelodysplastic syndrome, Diamond-Blackfan syndrome, or another rare anemia were studied with deferasirox[1]. Deferasirox was approved by the United States Food and Drug Administration (USFDA) in November 2005 and was subsequently approved in the European Union in 2006[7]. According to FDA guidelines, a stability indicating method is a validated analytical procedure that accurately and precisely measures active ingredients (drug substance or drug product) free from process impurities, excipients and degradation products. The main objective of a stability indicating method is to monitor results during stability studies to guarantee safety, efficacy and quality. It is a powerful tool when investigating Out-Of-Trend (OOT) or Out-Of-Specification (OOS) results in quality control processes[8]. According to the literature survey, Reversed-Phase High Performance Liquid Chromatography (RP-HPLC) and by High-Performance Thin Layer Chromatographic (HPTLC) methods are reported[9], Ultraviolet (UV) spectroscopy[10], liquid chromatography-tandem mass spectrometry using electrospray ionization source and Q-trap mass analyzer[11], liquid chromatographic methods[12] are reported. The results of stress studies reported by different researchers do not match well. There was a need to confirm the results of stress degradation. The present study aims to develop a simple, rapid, accurate HPTLC analytical method for the estimation of deferasirox as per Q1A(R2) and Q2(R1) International Council for Harmonisation (ICH) guidelines.
Materials and Methods
Chemical and reagents:
Deferasirox was gifted by industry and other chemicals and reagents like methanol (High Performance Liquid Chromatography (HPLC) grade), chloroform (Analytical Reagent (AR) grade), Hydrochloric acid (HCl) (AR grade), Sodium hydroxide (NaOH) (AR grade), triethylamine (HPLC grade) and 30 % v/v Hydrogen peroxide (H2O2) (AR grade) were procured from Loba Chemie Pvt. Ltd. Mumbai.
Instrumentation:
Instruments used in this method were HPTLC system Chromatography and Analytical Methods for Application in Green Chemistry (CAMAG) comprising of Thin Layer Chromatography (TLC) scanner III, Linomat 5 applicator, software (winCATS (version 1.4.3)), syringes (Hamilton (100 µl)), TLC plates (Merck’s aluminium TLC plate precoated with silica gel 60 F254), twin trough glass chamber. Other instruments used are UV-visible spectrophotometer (Shimadzu model: UV-1780), electronic balance (Shimadzu model: ATX-224R), sonicator (Pragmatic Risk Analysis and Management Approach (PRAMA) model: SM15 US), hot air oven, photo-stability chamber (Newtronic model: NEC103RSPI).
Mobile phase optimization:
To optimize the mobile phase various trails were taken such as n-butyl acetate:methanol (5:5 v/v), chloroform:methanol (5:5 v/v), toluene:ethyl acetate (5:5 v/v), chloroform:methanol:acetic acid (6:4:0.5 v/v/v) and chloroform:methanol:triethylamine (6:4:0.5 v/v/v), but Retardation factor (Rf) as well as peak shape, was not satisfactory. The mobile phase composed of chloroform:methanol:triethylamine (9:1:0.5 v/v/v) has resulted in considerable improvement of Rf and peak shape.
Preparation of standard stock solution (1000 μg/ml):
An accurately weighed 10 mg of deferasirox was transferred into working standard into a 10 ml volumetric flask and made the volume up to the mark with methanol.
Preparation of standard solution (50 μg/ml):
Transfer 0.5 ml of the standard stock solution into a 10 ml volumetric flask and made the volume up to the mark with methanol to prepare standard stock solution of 50 μg/ml.
Detection of wavelength:
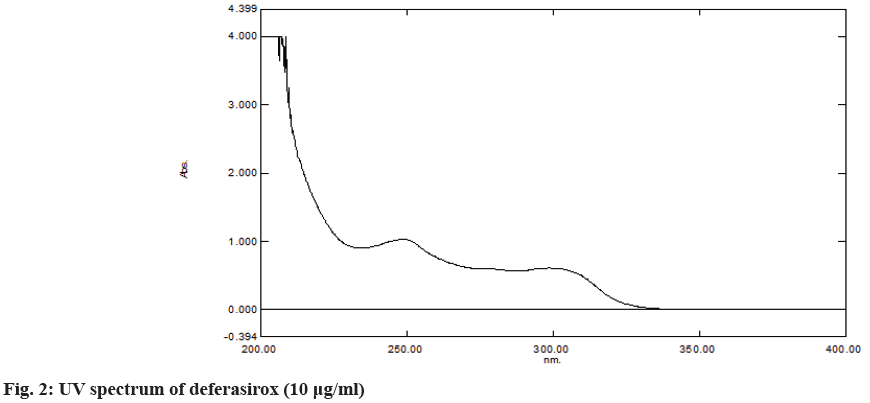
A solution of 10 µg/ml (transfer the 2 ml of the standard solution into a 10 ml volumetric flask and made the volume up to the mark with methanol) was prepared and scanned over 200-400 nm using a UV- spectrophotometer. The maximum absorbance was shown at 248 nm. The UV spectrum is shown in fig. 2.
Chromatographic conditions:
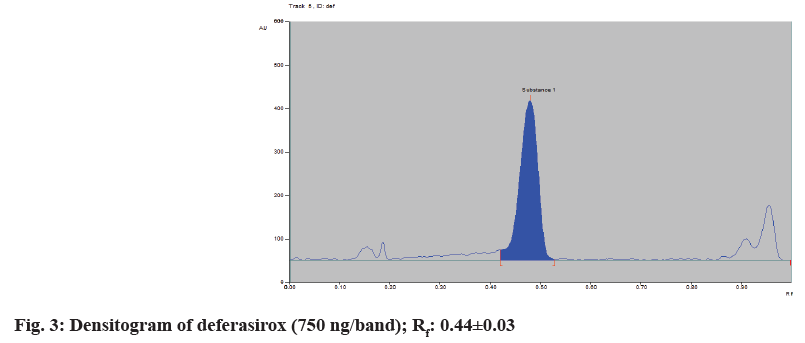
Chromatographic separation of deferasirox drug was performed on aluminium plates precoated with silica gel 60 F254, (10×10 cm with 250 μm layer thickness). Samples were applied on the plate as a band of 6 mm width using a 100 μl syringe with a Linomat applicator. The mobile phase was composed of chloroform:methanol:triethylamine (9:1:0.5 v/v/v). A well-separated band was observed with a Rf value of 0.44±0.03 (compounds present in the mixture will be visible on the Thin Layer Chromatography (TLC) plate and show good resolution when the Rf value lies between the range 0.3 and 0.7)[13]. The Rf value at the extremities was avoided to prevent any signals due to solvent front (mobile phase or solvent used). The twin trough glass chamber (10×10) cm was used for linear ascending development of the TLC plate with 15 min saturation conditions, migration distance was 70 mm. Densitometric scanning was performed at 248 nm, operated by CAMAG (winCATS software 1.4.2) and slit dimensions were 5×0.45 mm. The standard densitogram of deferasirox (750 ng/band) is shown in fig. 3.
Forced degradation study:
To evaluate the stability indicating the property of the developed method, forced degradation studies were carried out according to ICH guidelines Q1A(R2)[14]. Before finalizing a degradation condition for achieving degradation of 10 %-30 % (The shelf life of Active Pharmaceutical Ingredients (API) is 90 % as a result 10 %-30 % degradation is considered practical to study forced degradation study and identify the degradation products)[15], whereas degradation to an extent more than 30 % may lead to secondary degradations. There were several trials carried out to reach a final conclusion. The trials for all stress condition are as follows.
Trials for acid degradation: Firstly, the drug was treated to conditions like 0.1 N HCl for 2 h, 4 h, overnight, 1 d, 2 d, 3 d but the drug did not show ˃10 % degradation. Then the drug was treated to 1 N HCl and refluxes it for 2 h at 800°, which was a final stress condition.
Trials for alkali degradation: Firstly, the drug was treated to conditions like 0.05 N NaOH for 2 h, 4 h, overnight, 1 d, 2 d, 3 d but the drug did not show ˃10 % degradation. Then the drug was treated to 1 N NaOH instantaneously which was a final stress condition.
Trials for oxidation degradation: Firstly, the drug was treated to conditions like 30 % H2O2 for 2 h, 4 h, overnight, 1 d, 2 d, 3 d but the drug did not show ˃10 % degradation. Then the drug was treated to 30 % H2O2 and refluxes it for 2 h at 800° which was a final stress condition.
Trials for thermal degradation: Firstly, the drug was treated to conditions like 800° for 4 h, but the drug did not show ˃10 % degradation. Then the drug was treated to 800° for 8 h, which was a final stress condition.
Acid hydrolysis:
Transferred 2.5 ml of the standard stock solution into a 50 ml clean and dry volumetric flask, added 30 ml of methanol and 5 ml of 1 N HCl, mixed well. The solution was refluxed for 2 h at 80° and cooled to room temperature, neutralized with 1 N NaOH and made the volume up to the mark with methanol. The resultant solution was applied to the TLC plate and developed using an optimized mobile phase.
Base hydrolysis:
Transfer 0.5 ml of the standard stock solution into a 10 ml clean and dry volumetric flask, added 7 ml of methanol, and 1 ml of 0.1 N NaOH, mixed well. Neutralized with 0.1 N HCl and made the volume up to the mark with methanol. The resultant solution was applied to the TLC plate and developed using an optimized mobile phase.
Oxidative degradation:
To study the effect of oxidation stress, transferred 2.5 ml of the standard stock solution into a 50 ml clean and dry volumetric flask, added 30 ml of methanol and 5 ml of 30 % v/v H2O2, mixed well. The solution was refluxed for 2 h at 80° and cooled to room temperature. The resultant solution was applied to the TLC plate and developed using an optimized mobile phase.
Thermal degradation:
The thermal degradation was carried out by placing the drug in a solid state in an oven at 80° for 8 h. A sample was taken from the oven, cooled to room temperature, accurately weighed and transferred 10 mg of deferasirox into a 10 ml volumetric flask and made the volume up to the mark with methanol. Transferred the 0.5 ml of this solution into a 10 ml volumetric flask and made the volume up to the mark with methanol. The resultant solution was applied to the TLC plate and developed using an optimized mobile phase.
Photolytic degradation using sunlight:
The photo degradation study of the API was performed by exposing the drug to sunlight for 20 h. From the exposed API, accurately weighed and transferred 10 mg of deferasirox into a 10 ml volumetric flask and made the volume up to the mark with methanol. Transferred the 0.5 ml of this solution into a 10 ml volumetric flask and made the volume up to the mark with methanol.
The resultant solution was applied to the TLC plate and developed using an optimized mobile phase.
Photolytic degradation using cool white fluorescent light:
The photo degradation study of the API was performed by exposing the API to cool white fluorescent light providing illumination of not less than 1.2×10⁶ lux h of fluorescent light. From the exposed API, accurately weighed and transferred 10 mg of deferasirox into a 10 ml volumetric flask and made the volume up to the mark with methanol. Transferred the 0.5 ml of this solution into a 10 ml volumetric flask and made the volume up to the mark with methanol. The resultant solution was applied to the TLC plate and developed using an optimized mobile phase.
Method validation:
The HPTLC method for deferasirox was validated as per the ICH guidelines ICH Q2(R1) in terms of linearity, range, assay, accuracy, precision, limit of detection, limit of quantitation and robustness[16].
Linearity and range:
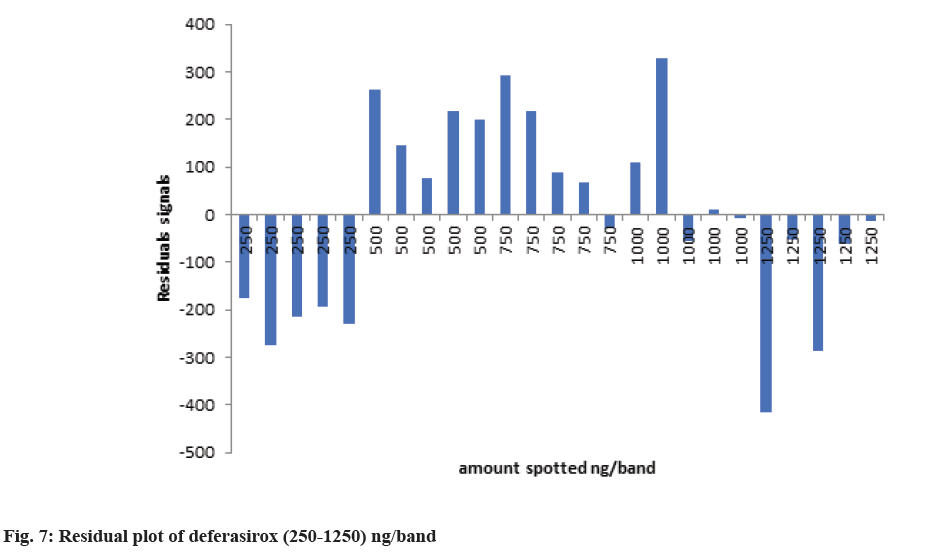
The linearity of an analytical method is its ability to elicit test results that are proportional to the concentration of analytes in samples within a given range. The range of an analytical method is the interval between the upper and lower levels. A standard solution of deferasirox were spotted on TLC plate with spotting volume 5, 10, 15, 20 and 25 to achieve spotted amount in the range 250-1250 ng/band. The linearity was observed over the range of 250-1250 ng/band. The calibration curve was made using five different volume (250, 500, 750, 1000 and 1250) ng/band. The values were plotted as the amount of drug spotted (ng/band) against the peak area to obtain a calibration curve. The pattern of the residual plot was also evaluated to further validate the linearity.
Precision:
This parameter is indicative of method’s reproducibility. The precision of a method is the extent to which the individual test results of multiple injections of a series of standards agree. Intraday (repeatability) precision and inter day (intermediate) precision were performed. Intraday precision was performed by analysing 250 ng/band of deferasirox, as six replicates in same day. For interday precision, the procedure was repeated on three consecutive days. The peak areas were measured and Percent Relative Standard Deviation (% RSD) was calculated. The limit is % RSD should not be more than 2 %.
Assay:
Weighed 20 tablets (Deferijet 250 mg) and determined the average weight of tablets. Crushed them and made a blend. Weighed and transferred a blend equivalent to 10 mg of the deferasirox into a 10 ml volumetric flask and added 7 ml of methanol. The mixture was shaked well and sonicated for 10 min and then made the volume upto the mark with methanol. The solution was centrifuged at 3000 revolutions per minute (rpm) for 10 min. and filtered through Whatman filter paper No. 40, discarded the first few ml of filtrate. Pipetted 0.5 ml of filtrate into a 10 ml volumetric flask and diluted up to 10 ml with methanol. The resultant solution was applied to the TLC plate and developed using an optimized mobile phase. The amount of deferasirox was calculated using the linearity regression equation.
Accuracy:
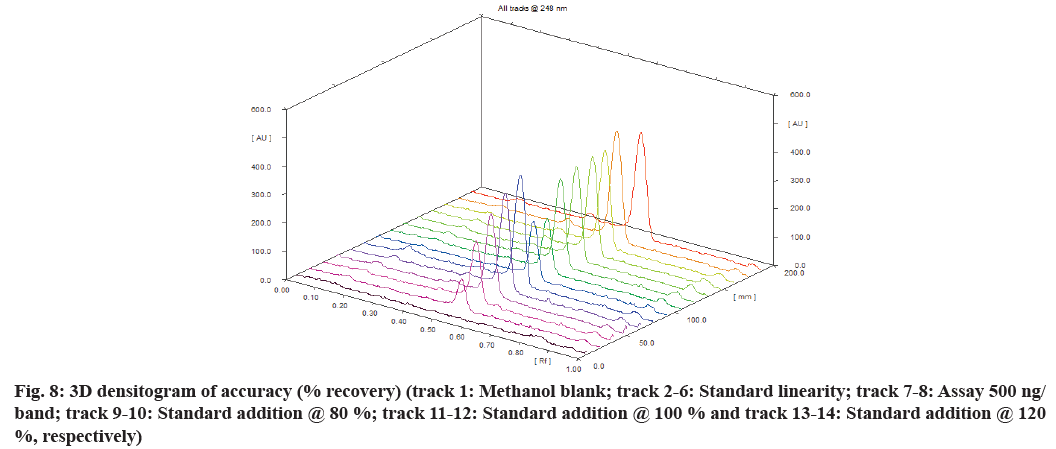
The accuracy of an analytical method may be defined as the closeness of the test results obtained by the method to the true value. The accuracy was evaluated as a percentage of recovery from the spiked samples at three concentration levels. The recovery study was done by performing the standard addition method at 80 %, 100 % and 120 % levels. The standard drug deferasirox was added to the pre-analysed sample solution at three levels. The basic concentration of the sample chosen was 500 ng/band. The peak areas obtained after development of plate were extrapolated from standard linearity to calculate the recovered amount. The sample preparation for accuracy is shown in Table 1.
| % level | Amount from marketed formulation (ng/band) | Amount of standard added (ng/band) | Total amount of the drug (ng/band) | % recovery |
|---|---|---|---|---|
| 80 | 500 | 400 | 900 | 100.37 |
| 100 | 500 | 500 | 1000 | 101.27 |
| 120 | 500 | 600 | 1100 | 101.55 |
Table 1: Accuracy (% Recovery) Studies
Robustness:
The robustness of an analytical method is a measure of its capacity to remain unaffected by small but deliberate variation in method parameters and provides an indication of its reliability during normal usage. The robustness was examined by evaluating the influence of small variations in different conditions such as saturation time, wavelength, mobile phase ratio, time for an application to development and time for development to scanning. The average value of % RSD for the determination of deferasirox less than 2 % confirmed the robustness of the method.
Limit of Detection (LOD) and Limit of Quantitation (LOQ):
LOD and LOQ range is used to describe the span of analyte levels, as contained in a sample matrix, for which method performance has been tested and data quality is deemed acceptable for its intended use. The detection limit is used to describe the lowest analyte level that can be confidently identified.
The LOD and LOQ were calculated using the Standard Deviation (SD) method.
LOD=3.3×SD/S
LOQ=10×SD/S
where SD is the response at the lowest concentration and ‘S’ is the slope of the corresponding calibration curve.
Results and Discussion
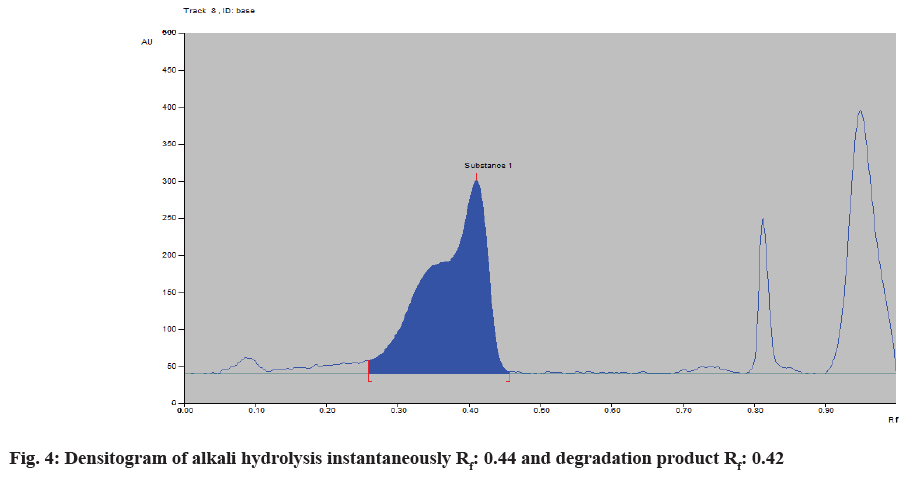
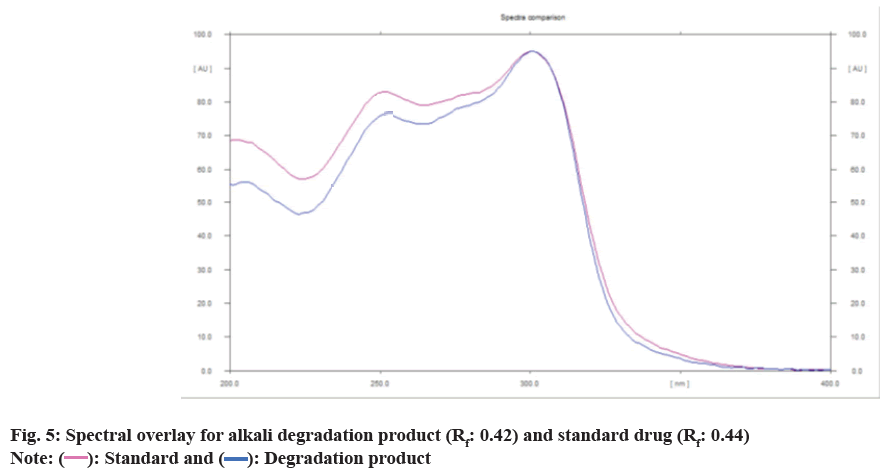
To evaluate the stability indicating the property of the developed method, forced degradation studies were carried out and optimized to 10 %-30 % degradation by ICH guidelines Q1A(R2) (Table 2). Deferasirox was found to be sensitive to acidic and alkali hydrolysis and stable in oxidative, thermal stress and photolytic stress. In alkali hydrolysis, a degradant peak was obtained at Rf 0.42. The densitogram of alkali hydrolysis is shown in fig. 4 and a spectral overlay for the alkali degradation product and the standard drug is shown in fig. 5.
| Stress type | Stress condition | % Recovery | Rf of drug product |
|---|---|---|---|
| Acidic hydrolytic | 1 N HCl 2 h reflux at 80° | 73.38 | - |
| Alkali hydrolytic | 0.1 N NaOH Instantaneous | 30.31 | 0.42 |
| Oxidative degradation | 30 % H2O2 2h reflux at 80° | 98.16 | - |
| Thermal degradation | 80° for 8 h | 97.53 | - |
| Photostability (sunlight) | 20 h in sunlight | 95.32 | - |
| Cool white fluorescent light | 1.2 million lux h | 94.5 | - |
Table 2: Summary of Stress Degradation
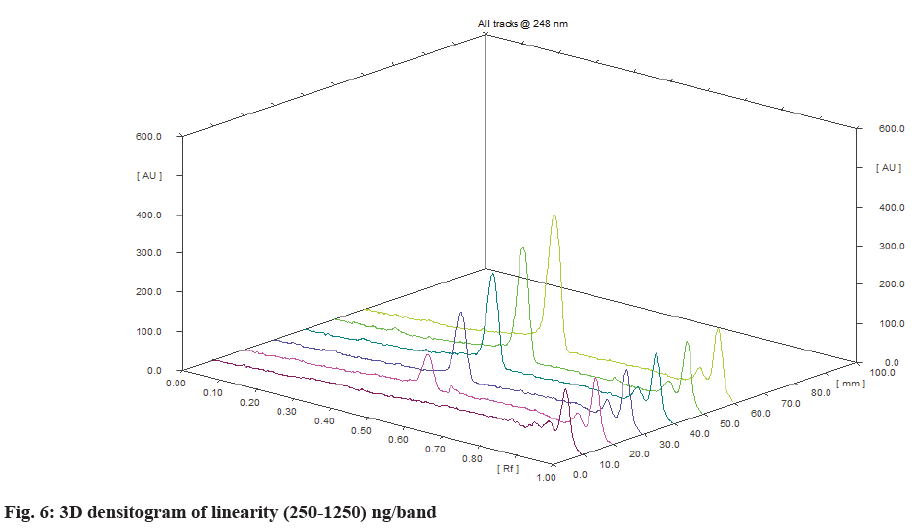
Deferasirox showed linearity in the concentration range 250-1250 ng/band. The correlation coefficient was found 0.9951 with the equation of y=8.0353x+689.38. Where, y is the peak area and x is the amount spotted (ng/band). The three Dimensional (3D) densitogram of linearityis shown in fig. 6. The residual plot of deferasirox is shown in fig. 7. The linear relationship between the amount spotted (ng/band) and the peak area is confirmed by the residual plot. This residual plot without any tendency proves the linearity of calibration[17]. Assay was found to be 98.93 % and the accuracy result was shown in Table 1 and fig. 8. Repeatability and intermediate precision were performed. The results are given in Table 3. % RSD was found to be 1.68 % and 1.88 % respectively.
| Parameters | Concentration (ng/band) | Peak area | % RSD |
|---|---|---|---|
| Intraday precision | 250 | 2520 | 1.68 |
| 250 | 2491 | ||
| 250 | 2463 | ||
| 250 | 2576 | ||
| 250 | 2489 | ||
| 250 | 2466 | ||
| Interday precision | 250 | 2524 | 1.88 |
| 250 | 2475 | ||
| 250 | 2496 | ||
| 250 | 2594 | ||
| 250 | 2500 | ||
| 250 | 2460 |
Table 3: Precision
LOD and LOQ were calculated by the SD method. The LOD and LOQ were found to be in the range of 15.57 ng/band and 47.18 ng/band respectively.
In robustness, one factor at a time was changed. It was observed that the % RSD for peak area was found less than 2 % which confirmed that the method developed was robust. The results of the robustness study are shown in Table 4.
| Parameters | Conditions | % RSD |
|---|---|---|
| Mobile phase ratio Chloroform:methanol:triethylamine (9:1:0.5 v/v/v) (±0.2 ml) | (9.2:0.8:0.5 v/v/v) | 1.83 |
| (8.8:1.2:0.5 v/v/v) | 1.78 | |
| Effect of time from spotting to development | Immediately after spotting | 1.6 |
| After 2 h | 1.52 | |
| Effect of time from development to scanning | Immediately after development | 1.49 |
| After 2 h | 1.56 | |
| Saturation time (±5 min) | 10 min | 1.84 |
| 20 min | 1.57 | |
| Wavelength (±2 nm) | 246 nm | 1.76 |
| 250 nm | 1.53 |
Table 4: Robustness Studies
As per the literature survey, some of the reported methods have no degradation product peak in alkali degradation but in our studies degradation product peak was observed under alkaline conditions. They have reported that deferasirox drug degrades in acid, alkali, oxidative and thermal degradation conditions and no degradation is seen under UV degradation. In one reported study, there were degradation products observed under all stress conditions when duration of stress was in 3-5 d. In our studies, we have optimized stress conditions to achieve 10 %-30 % degradation at acid and alkali conditions as per guidelines.
This developed HPTLC method is simple, rapid and stability indicating routine quantitative analysis of deferasirox as a bulk drug and in the dosage form. Method’s reproducibility has been indicated by % RSD <2 %, accuracy was proved by recovery studies. The method was validated as per the guidelines of ICH Q2(R1). Deferasirox was found to be sensitive to acidic hydrolysis and alkali hydrolysis and stable in oxidative, thermal, sunlight and fluorescent degradation conditions. The degradation product peak was found in only alkali hydrolytic conditions. We have not attempted to characterize the degradation product. But our method will be able to detect a product if formed under alkaline stress. This method can prove to be very rapid test to detect degradation of bulk drug deferasirox and can be added as in-house test for raw material tests by quality control laboratories. The developed HPTLC method has inherent advantages over reported HPLC methods in terms of high throughput, less solvent consumption and speed of analysis. The developed chromatographic method may be used for routine stability monitoring of deferasirox.
Acknowledgements:
The authors are also thankful to the principal and the management of the All India Shri Shivaji Memorial Society’s (AISSMS) College of Pharmacy for providing the necessary facilities to conduct the research.
Conflict of interest:
The authors declared no conflict of interests.
References
- Stumpf JL. Deferasirox. Am J Health Syst Pharm 2007;64(6):606-16.
[Crossref] [Google Scholar] [PubMed]
- O'Neil MJ, editor. The Merck index: An encyclopedia of chemicals, drugs and biologicals. RSC Publishing; 2013.
- India DM. Stability indicating RP-HPLC assay method development and validation for determination of Deferasirox in tablet dosage form. Int J Pharm Res Allied Sci 2012;1(4):40-5.
- Cappellini MD. Long-term efficacy and safety of deferasirox. Blood Rev 2008;22:S35-41.
[Crossref] [Google Scholar] [PubMed]
- Neufeld EJ. Oral chelators deferasirox and deferiprone for transfusional iron overload in thalassemia major: New data, new questions. Blood 2006;107(9):3436-41.
[Crossref] [Google Scholar] [PubMed]
- Choudhry VP, Naithani R. Current status of iron overload and chelation with deferasirox. Indian J Pediatr 2007;74:759-64.
[Crossref] [Google Scholar] [PubMed]
- Yang LP, Keam SJ, Keating GM. Deferasirox: A review of its use in the management of transfusional chronic iron overload. Drugs;67:2211-30.
[Crossref] [Google Scholar] [PubMed]
- What is a stability indicating method (SIM)? AmbioPharm Inc 2023.
- Bhatt NA, Sen DJ. Comparative stability indicating assay method of deferasirox by RP-HPLC and HPTLC. World J Pharm Res 2016;5(9):1252-79.
- Somisetty VS, Dhachinamoorthi D, Rahaman SA, Rao CM. Development and validation of newer analytical methods for the estimation of Deferasirox in bulk and in tablet dosage form by UV spectroscopy and RP–HPLC. Int J Chem Tech Res 2013;5:1861-8.
- Thomas S, Joshi SC, Vir D, Agarwal A, Rao RD, Sridhar I, et al. Identification, characterization and quantification of a new impurity in deferasirox active pharmaceutical ingredient by LC–ESI–QT/MS/MS. J Pharm Biomed Anal 2012;63:112-9.
[Crossref] [Google Scholar] [PubMed]
- Kaja RK, Surendranath KV, Radhakrishnanand P, Satish J, Satyanarayana PV. A stability indicating LC method for deferasirox in bulk drugs and pharmaceutical dosage forms. Chromatographia 2010;72:441-6.
- Department Rankings. University of Alberta; 2023.
- Guideline IH. Stability testing of new drug substances and products. Q1A (R2), current step 2003;4(1-24).
- Blessy MR, Patel RD, Prajapati PN, Agrawal YK. Development of forced degradation and stability indicating studies of drugs: A review. J Pharm Anal 2014;4(3):159-65.
[Crossref] [Google Scholar] [PubMed]
- Guideline IH. Validation of analytical procedures: text and methodology. Q2 (R1) 2005;1(20):05.
- Ferenczi-Fodor K, Renger B, Végh Z. The frustrated reviewer—recurrent failures in manuscripts describing validation of quantitative TLC/HPTLC procedures for analysis of pharmaceuticals. J Planar Chromatogr Modern TLC 2010;23(3):173-9.
 Standard and
  Degradation product