- *Corresponding Author:
- A. Singh
Department of Pharmacy,
School of Medical and Allied Sciences,
Galgotias University,
Greater Noida,
Uttar Pradesh 203201,
India
E-mail: amit21may@gmail.com
| Date of Received | 10 June 2020 |
| Date of Revision | 13 August 2021 |
| Date of Acceptance | 11 April 2022 |
| Indian J Pharm Sci 2022;84(2):465-476 |
This is an open access article distributed under the terms of the Creative Commons Attribution-NonCommercial-ShareAlike 3.0 License, which allows others to remix, tweak, and build upon the work non-commercially, as long as the author is credited and the new creations are licensed under the identical terms
Abstract
In the present work high performance liquid chromatography method was developed and validated for imatinib mesylate and its related substances. The analyzed active pharmaceutical ingredient and its impurities were separated by Atlantis T3 (150 mm×4.6 mm), 3 μm column with ultraviolet detection at 230 nm. The mobile phase has been used in specific composition (50:50, v/v, organic and inorganic) that was prepared using methanol and buffer (0.01 M of 1-Octane sulphonic acid with 0.2 % trifluoroacetic acid). The results of proposed method were analyzed and validated as per International council on harmonisation guidelines. The percentage relative standard deviation was observed as 1.15 % for system precision that was found within the limit. The method was found to be specific as there was no interference between blank, imatinib mesylate and impurities. The limit of detection and quantitation was found 0.383 and 1.15 ppm respectively. The regression coefficient (r2) of imatinib mesylate and its impurities was found to be 0.999. Recovery results of impurities imatinib-piperazine-n-oxide and n-desmethyl-imatinib were found 107.70 % and 99.30 % against standard which was within 80 %-120 % acceptance criteria. The molecule was stable in all the stress conditions such as acid, base, oxidation, thermal and also in analytical solution. Thus, proposed method was found to be sensitive, accurate, precise, reproducible and offered good column life and also beneficial for study of impurities.
Keywords
Imatinib mesylate, imatinib-piperazine-n-oxide, n-desmethyl-imatinib, high performance liquid chromatography method, validation, impurities
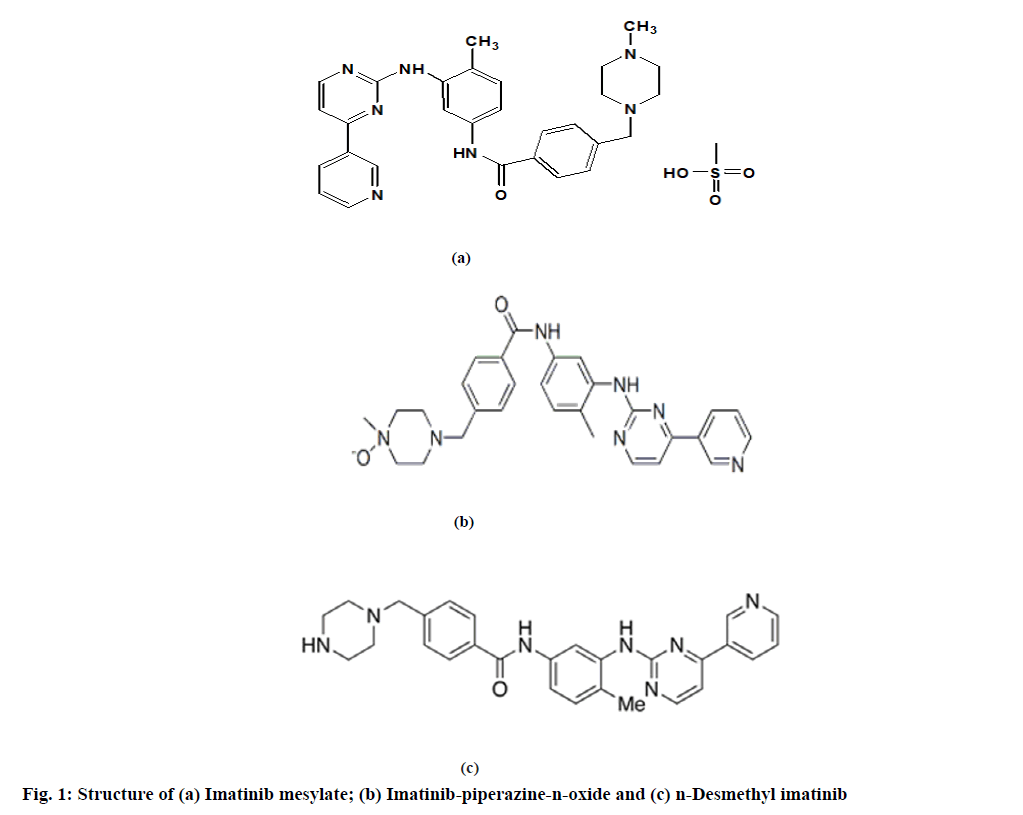
Imatinib mesylate is a 2-phenylamino pyrimidine derivative that works as a specific inhibitor for a number of tyrosine kinase enzymes. It is an antineoplastic agent that inhibits or prevents the proliferation of neoplasm by inhibiting protein kinase. Imatinib mesylate is used in the treatment of chronic myeloid leukemia[1-4]. Chemically, imatinib mesylate is known as 4-((4-methyl-1-piperazinyl)methyl)-N-(4-methyl- 3-((4-(3-pyridinyl)-2-pyrimidinyl)amino phenyl) benzamide methanesulfonate salt (fig. 1a). Imatinibpiperazine- n-oxide and n-Desmethyl-imatinib are the related substance of imatinib mesylate. Chemically, imatinib-piperazine-n-oxide is known as 4-((4-methyl- 1-oxidopiperazin-1-ium-1-yl)methyl)-n-(4-methyl- 3-((4-pyridin-3-ylpyrimidin-2-yl) amino) phenyl) benzamide (fig. 1b) and chemically n-Desmethylimatinib is known as n-(4-methyl-3-((4-(3-pyridinyl)- 2-pyrimidinyl)amino)phenyl)-4-(1-piperazi nylmethyl) benzamide (fig. 1c).
Literature survey revealed that several methods of analysis have been reported for the analysis of imatinib mesylate and related substance in formulation[5-12]. There was no High Performance Liquid Chromatography (HPLC) method available for the impurity identification and method validation of imatinib mesylate Active Pharmaceutical Ingredient (API). Some HPLC methods were available for stability indicating assay and for validation of formulation not for API. The objective of this research work was to develop and validate a highly specific, reliable and cost effective HPLC method for the impurity identification and method validation of imatinib mesylate.
Materials and Methods
Materials:
The working standard of imatinib mesylate (99 %) with impurities imatinib-piperazine-n-oxide (>98 %) and n-Desmethyl-imatinib (>98.5 %) were obtained from Sun Pharmaceutical Industries Limited, Gurugram, as a kind gift sample. Methanol, ortho-phosphoric acid and trifluoroacetic acid were purchased from Rankem, Mumbai. Sodium Hydroxide (NaOH), potassium dihydrogen phosphate was purchased from Emparta, Mumbai. Where, 1-octane sulphonic acid and HPLC water were procured from Fisher Scientific (Qualigens) Ltd. Mumbai, India. Membrane filters of 0.22 μm was procured from millipore.
Apparatus:
The HPLC determinations were performed with ‘Waters Alliance-2695’ with low pressure quaternary gradient pump consisting of vacuum in built degasser unit, Photo Diode Array (PDA) detector 2998, column oven and Empower version 2.0 software, with manual injector. Ultrasonic bath degasser and cleaner were used (Lansany, Chandīgarh, India). All weights were taken on electronic balance (Vibra, DJ-150S-S, Shinko Denshi, Japan) with 1 mg sensitivity.
Designing of system suitability criteria:
The system suitability was performed using different sensitivity solution, system suitability solution and standard solution of specified concentration were injected into the column and then chromatograms were recorded and analysed.
The system will be considered suitable for analysis if and only if; the Signal to Noise (S/N) ratio for drug peak must not less than 10 from sensitivity solution; the tailing factor for drug peak must not more than 2.0 from system suitability solution; the column efficiency determined for imatinib mesylate peak must not less than 6500 theoretical plates from system suitability solution; the resolution between imatinib-piperazinen- oxide with imatinib mesylate peak and imatinib mesylate with n-Desmethyl-imatinib must not less than 2.0 from system suitability solution; the percentage Relative Standard Deviation (% RSD) of six replicate injections of standard solution must not more than 2 %.
Procedure:
The blank diluents for sensitivity solution, system suitability solution and standard solution were injected into the column and the chromatograms were recorded. The blank chromatogram for any extraneous peaks were examined, any corresponding peaks observed in the chromatogram of the sample solution was not studied.
Preparation of standard stock solution: It was prepared by dissolving 10 mg of standard drug in 100 ml of mobile phase, which gives 100 μg/ml of concentration. The solution was filtered through 0.22 μm Polyvinylidene Difluoride (PVDF) membrane filter.
Preparation of standard stock solution with impurities: The working standard of imatinib mesylate of 10 mg with 0.25 mg of each of standard impurities (Imatinib-piperazine-n-oxide and n-Desmethylimatinib) were accurately weighed and transferred into a 100 ml volumetric flask in which mobile phase diluents was added to dissolve the drug and impurities. The solution was sonicated and filtered through 0.22 μm PVDF membrane filter. This gives standard stock solution of concentration 100 μg/ml of imatinib mesylate and 2.5 μg/ml of each standard impurity imatinib-piperazine-n-oxide and n-Desmethyl-imatinib respectively.
Preparation of spiked sample solution: The different spiked sample solutions were prepared by diluting standard stock solution with impurities.
Preparation of others solution: As per requirement of system suitability criteria three different solutions were prepared. Sensitivity solution of 10 μg/ml was prepared by diluting 1 ml of standard stock solution of imatinib mesylate; sample solution of 15 μg/ml was prepared by diluting 1.5 ml of standard stock solution; system suitability solution of 20 μg/ml was prepared by diluting 2 ml standard stock solution of imatinib mesylate.
Preparation of buffer: The buffer of pH 2.12 was prepared by dissolving 2.15 g of octane-sulphonic acid in 1000 ml of distilled water in presence of 2 ml trifluoroacetic acid. The dissolved buffer solution was filtered through 0.22 μm membrane filter prior to use.
Optimization of chromatographic conditions:
Method development for related substances of imatinib mesylate was initiated by keeping analytical target profile to achieve good resolution between the closely related substances and that should have more peak threshold and less peak purity angle. Imatinibpiperazine- n-oxide and n-Desmethyl-imatinib impurity standards were needed to be separated from the imatinib mesylate, set as a target profile. Under the different experimental condition, the method was also optimized for different pH of inorganic mobile phase and organicinorganic solvent ratio, column temperature and flow rate. The trials performed to finalize the method were as follows: The first trial was done with Kromasil C18 (150×4.6) mm, 5 μm column with varying parameters. Here, the tail peak was merged with main peak and front peak was slightly separated, as base to base separation was required (fig. 2). So, it was decided to change the gradient and column temperature. The column temperature was taken as 35° with gradient change by increasing buffer composition to obtain base to base separation. The peak shape was found poor and responses of all peaks were found less when compared to that of previous trials. So, it was required to change the column and gradient.
In the second trial the column chosen was Inertsil Octadecyl-Silica (ODS)-3 (150×4.6) mm, 5 μm with changed gradient and extended run time to 65 min. Here the tail peak was slightly separated compared to that of previous trial but front was merged. So, the pH of buffer was changed. Thus, the buffer pH was adjusted to 2.8 with orthophosphoric acid. The resulted tail peak was separated from base to base but front peak was completely merged. So, buffer salt concentration was required to be changed. Now the buffer salt concentration was increased. In this trial the separation was improved but last eluting impurity had more tailing. So, it was decided to change the column and increase the gradient run time.
In the third trial the column was taken Atlantis T3 (150×4.6) mm, 3 μm, with extended run time to 80 min. The separation was observed for all peaks but peaks were suppressed. So, it was decided to change the buffer. With the new buffer the resolution of tail peak was found about 2.2 and front peaks were well separated from each other but response of peaks slightly suppressed. Hence, it was decided to change gradient and injection volume. The gradient was kept to 80 min with increased injection volume to 20 μl. Here all the peaks were found well separated from each other. Hence, it was decided to proceed according to this trial for final loading.
All the final loading of drug and impurities for HPLC determinations were performed with ‘Waters’ technologies having gradient low pressure quaternary pump, consisting of vacuum in built degasser unit, with PDA detector, equipped with a manual injector of 20 μl loop. Detection accomplished with an Ultraviolet (UV) detector at 230 nm. Integration and system parameters were controlled by Empower 2.0 software. Finally, chromatographic analysis was carried out at temperature 25° on column Atlantis T3 C18 (150×4.6) mm, 3 μm. The separation was achieved by gradient elution with a flow rate 1.0 ml/min. The final mobile phase was made by inorganic buffer and organic methanol of ratio of 50:50 v/v.
Method validation:
The presented HPLC method was validated according to International Council on Harmonisation (ICH) guidelines[13-15].
System suitability parameters: The system suitability parameters were analysed by injecting 15 μg/ml of concentrated solution of standard stock solution and with impurities.
Precision: The precision of an analytical procedure expresses the closeness of agreement, degree of scatter, between a series of measurements obtained from multiple sampling of the same homogeneous sample under the prescribed conditions. Six replicates of known concentration (20 μg/ml) injections of standard drug solution were injected and % RSD was determined.
Specificity: The specificity is the ability to assess unequivocally the analyte in the presence of components which may be expected to be present. Typically, these might include impurities, degradants, matrix, etc. To analyze specificity, the blank solution, sample solution with individual impurities and spiked sample with all impurities were injected.
Linearity: A linear relationship was evaluated across the range of the analytical procedure. It was demonstrated directly on the drug substance by dilution of a standard stock solution. For the establishment of linearity, a minimum of 5 concentrations is recommended or by some other approach may be justified. The linearity of an analytical procedure is its ability, within a given range to obtain test results which are directly proportional to the concentration, amount of analyte in the sample. It was performed in the range of 50 %, 100 % and 200 % of specification limit.
The sample preparation of 200 % level i.e., 100 μg/ ml, was directly determined by standard stock solution with impurities. This solution was directly injected without any dilution. The 100 % level i.e., 50 μg/ ml test solution was prepared by transferring 5 ml of standard stock solution with impurities into 10 ml of volumetric flask. Then volume was maintained up to 10 ml by mobile phase. Where 50 % level i.e., 25 μg/ml was prepared by diluting 0.25 ml of standard stock solution with impurities in 10 ml of volumetric flask. The volume was maintained by mobile phase that gives test solution.
Accuracy: The accuracy of the method should be established across the specified range of the analytical procedure. It was determined by calculating the percentage recovery of spiked standard solution, referred as reference material and spiked sample solution with all impurities in the range.
Limit of Detection (LOD) and Limit of Quantitation (LOQ): The LOD and LOQ limit were determined by the analysis of samples with known concentrations of analyte. As approach is based on S/N ratio, the approach can only be applied to analytical procedures which exhibit baseline noise. Determination of the S/N ratio is performed by comparing measured signals from samples with known low concentrations of analyte with those of blank samples and establishing the minimum concentration at which the analyte can be reliably detected, for LOD and quantified, for LOQ. The S/N ratio between 3 or 2:1 is generally considered acceptable for estimating the detection limit. But determining the quantitation through a typical S/N ratio 10:1 is required.
The LOQ sample was prepared by diluting 0.1 ml of standard stock solution with impurities to a 10 ml of volumetric flask with mobile phase. It gives 1 μg/ml of test solution.
Forced degradation study: It is a physical and chemical stress testing study of new entity and drug products which helps to develop and demonstrate the specificity of such stability indicating methods. It can be used to determine the degradation pathway and degradation products that could form during storage and facilitate formulation development, manufacturing and packaging. The forced degradation was studied with the four different conditions i.e. Alkali degradation sample was prepared by dissolving 10 mg of drug in 5 ml of diluents followed by exposing the samples with 5 ml of 5 N NaOH. Now samples were kept in water bath for 2 h at 80°. It was neutralized by 5 ml of 5 N Hydrochloric Acid (HCl). Finally, this solution was diluted up to 50 ml by mobile phase. Before injecting into column, it was filtered through 0.22 μm PVDF filter. Acid degradation sample was prepared again by weighing and transferring 10 mg of drug sample into a 50 ml volumetric flask with 5 ml of diluents to dissolve the drug, after this further 5 ml of 5 N HCl was added to drug solution. The solution was kept at water bath temperature of 80° for 2 h. Then solution was removed from water bath, cooled at room temperature and neutralized with 5 ml of 5 N NaOH and the volume was made up with diluents and was filtered through 0.22 μm PVDF membrane filter. Preparation of peroxide degradation sample was prepared by accurately weighing and transferring 10 mg of drug sample into a 50 ml volumetric flask having 5 ml of diluents. Then dissolved drug sample was added with 5 ml of 30 % Hydrogen Peroxide (H2O2) solution. The solution was kept at water bath at temperature of 80° for 10 min. Then solution was removed from water bath, cooled at room temperature and volume make up with diluents up to 50 ml. The sample was filtered through 0.22 μm PVDF membrane filter before injection. The thermal degradation sample was obtained after keeping drug sample in oven at temperature 105° for 90 h. The sample was removed from oven and cooled at room temperature. Then 10 mg of drug sample was accurately weighed and transferred into a 50 ml of volumetric flask having 30 ml of diluents to dissolve the drug. The solution was sonicated and the volume was making up before filter through 0.22 μm PVDF membrane filter. Before injecting the forced degradation sample solutions, the blank of the same were also injected.
Robustness: The robustness of the proposed method was examined by changing chromatographic parameters such as mobile organic phase composition (±2 %), temperature of column (±5°) and flow rate (±10 %) of the optimized value. In this study, spiked sample was injected.
Stability in analytical solution:
The stability of drug and impurity in analytical solutions was identified by injecting the spiked sample solution at different time interval till 12 h.
Results and Discussion
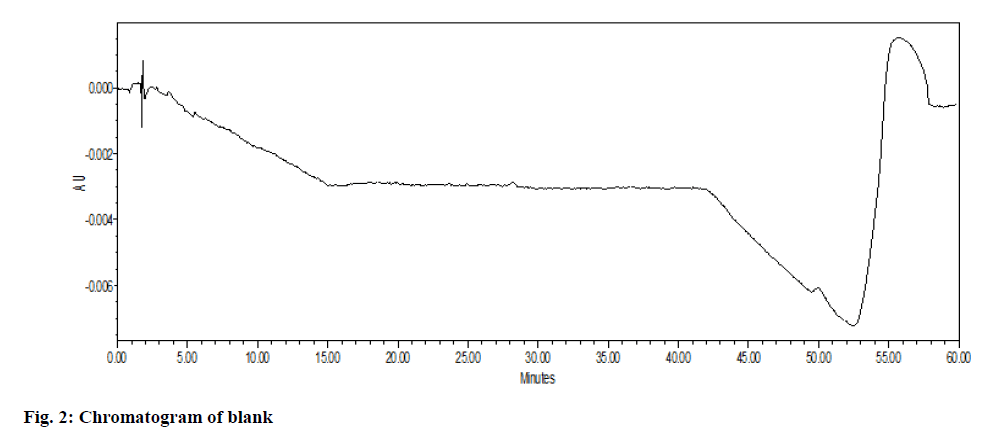
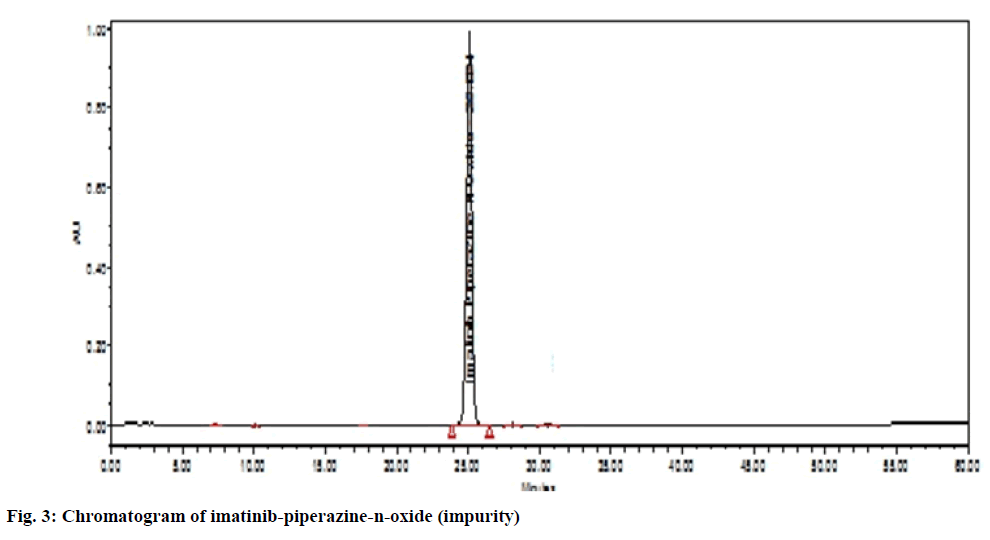
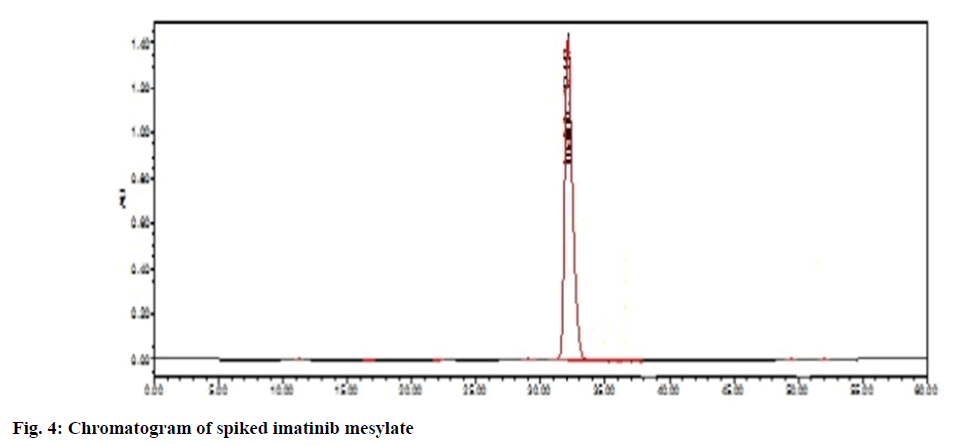
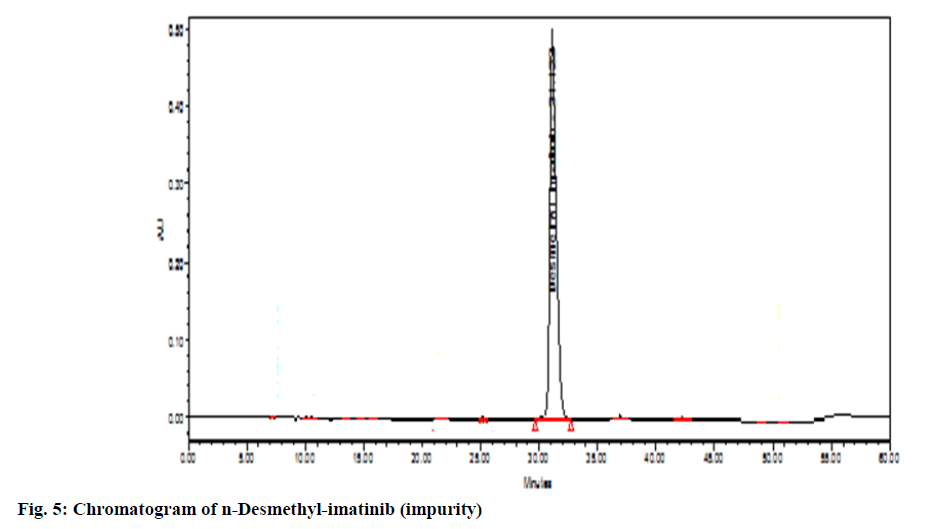
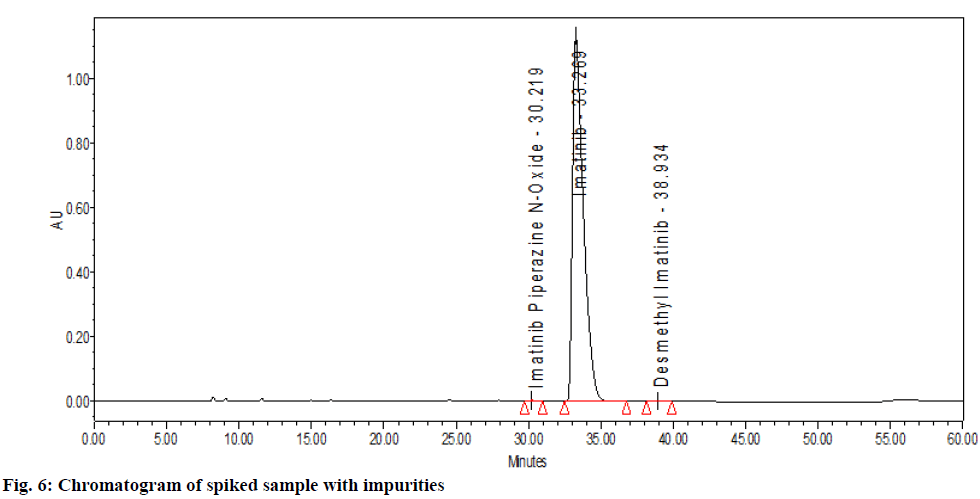
The chromatographic system suitability test was evaluated by observing the different sample test results. From observation in Table 1, the United States Pharmacopeia (USP) theoretical plate was found to be 8646 (>6500) with the tailing factor of drug peak that is 1.57 which was not more than 2 proves the suitability of the system. After observation of all chromatogram for system suitability, it passes the acceptance criteria. There was no peak observed in blank solution (fig. 3). The imatinib mesylate peak was observed at Retention Time (RT) of 33.269 min (fig. 2). Imatinib piperazine n-oxide peak was observed at RT of 30.219 min (fig. 4). N-Desmethyl imatinib peak was observed at RT of 38.934 min (fig. 5).
| Peaks | System* precision | RT (min) |
Purity angle | Purity threshold | Area (µV*s) | % Area | USP resolution | USP tailing | USP plate count |
|---|---|---|---|---|---|---|---|---|---|
| Imatinib-piperazine-n-oxide | - | 30.219 | 1.640 | 3.181 | 100 283 | 0.17 | 2.86 | 1.13 | 35 544 |
| Imatinib mesylate | 1.15 | 33.269 | 0.107 | 1.010 | 58 966 409 | 99.67 | - | 1.57 | 8646 |
| n-Desmethyl imatinib | - | 38.934 | 2.404 | 4.486 | 92 698 | 0.16 | 4.61 | 1.17 | 25 193 |
Note: *System precision in terms of percentage Relative Standard Deviation (% RSD), n=6
Table 1: Observation of System Suitability Parameters
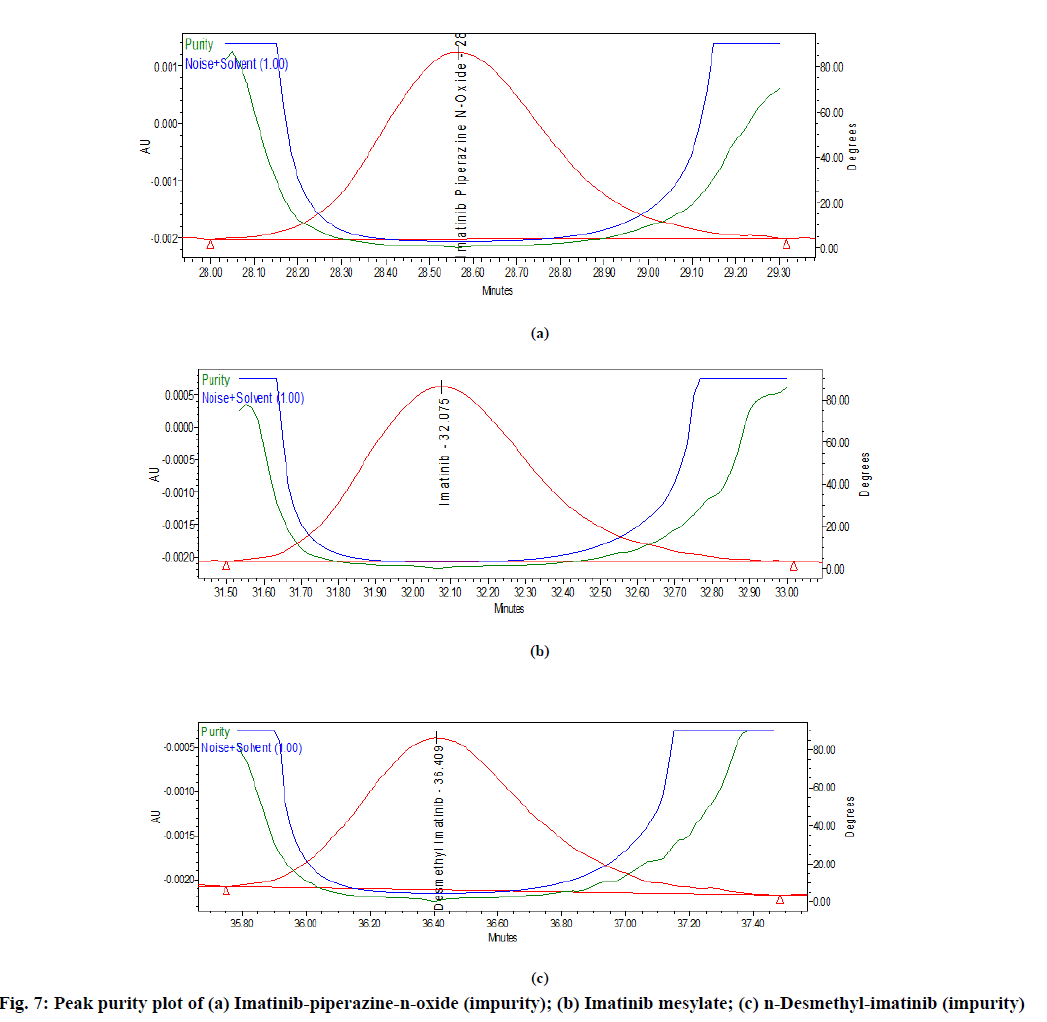
In spiked samples, impurities were well separated from imatinib mesylate with resolution more than 2 as shown in Table 1 and fig. 6. Peak purity of imatinibpiperazine- n-oxide in spiked sample was passed (fig. 7a). Peak purity of imatinib mesylate (fig. 7b) in sample was passed. Peak purity of n-Desmethylimatinib in spiked sample was passed (fig. 7c). Hence, there was no interference found between the imatinib mesylate, blank and its impurity in spike sample and sample peak purity was passed. Thus, proposed method was found to be specific and highly selective.
After the optimization of chromatographic conditions, the injected standard stock solution with impurity samples gives the chromatographic values in terms of USP tailing and USP plate etc., in Table 1. The values were under the limit as required that proves the system suitability. The precision of the analytical method should be evaluated in terms of repeatability. The precision of the method was proven high as % RSD was found 1.15 % that is less than 2 % that proves the high precision of the methods. The method was proved specific by higher percentage recovery, Table 1. In the specified range of linearity analysis, the test was performed for three specified dilutions of 50 % to 200 % of range. Linearity was determined by least square regression method, Table 2. The regression coefficient was found very high (>0.999) that proves its linearity, Table 3. The method was found accurate because the recovery results of imatinib maleate, imatinib-piperazine-n-oxide and n-Desmethyl-imatinib were found to be 101.23 %, 107.70 % and 99.30 %, Table 4.
| Name | Weight (mg) | Purity | Corrected (mg) | Area counts | Concentration (µg/ml) | Slope | Retention factor (Rf) (on slope basis) | RRF | Mean RRF |
|---|---|---|---|---|---|---|---|---|---|
| Response factor at 200 % | |||||||||
| Imatinib-piperazine-n-oxide | 1.171 | 98.498 | 1.153 | 176 453 | 4.614 | 38 243 | 1.11 | 0.9 | 0.92 |
| Imatinib mesylate | 1.146 | 99.83 | 1.144 | 194 263 | 4.567 | 42 453 | 1 | 1 | 1 |
| n-Desmethyl imatinib | 1.115 | 97.75 | 1.09 | 122 968 | 4.36 | 28 204 | 1.51 | 0.66 | 0.67 |
| Response factor at 100 % | |||||||||
| Imatinib-piperazine n-oxide | 1.171 | 98.498 | 1.153 | 87 999 | 2.307 | 38 144 | 1.06 | 0.94 | |
| Imatinib mesylate | 1.146 | 99.83 | 1.144 | 92 762 | 2.288 | 40 543 | 1 | 1 | |
| n-Desmethyl imatinib | 1.115 | 97.75 | 1.09 | 60 905 | 2.18 | 27 938 | 1.45 | 0.69 | |
| Response factor at 50 % | |||||||||
| Imatinib-piperazine-n- oxide | 1.171 | 98.498 | 1.153 | 44 673 | 1.153 | 38 745 | 1.08 | 0.93 | |
| Imatinib mesylate | 1.146 | 99.83 | 1.144 | 47 818 | 1.144 | 41 799 | 1 | 1 | |
| n-Desmethyl imatinib | 1.115 | 97.75 | 1.09 | 29 899 | 1.09 | 27 430 | 1.52 | 0.66 | |
Note: RRF: Relative Response Factor and Rf: Retention factor
Table 2: Results of Response Factor at 200 %, 100 % and 50 % Level
| Name | Correlation regression coefficient (r2) |
|---|---|
| Imatinib-piperazine-n-oxide | 0.9999 |
| Imatinib mesylate | 0.9995 |
| n-Desmethyl imatinib | 0.9999 |
Table 3: Correlation Regression Coefficient (r2)
| Sample spiked | Area observed (µV*s) |
Amount observed (% w/w) |
Amount added (% w/w) |
Amount present (% w/w) |
Amount recovered (% w/w) |
% Recovery |
|---|---|---|---|---|---|---|
| Imatinib mesylate (Control) | 13 633 | 0.026 | - | - | - | 101.23 |
| Imatinib-piperazine-n-oxide | 101 099 | 0.193 | 0.155 | 0.026 | 0.167 | 107.70 |
| n-Desmethyl imatinib | 67 361 | 0.176 | 0.148 | 0.029 | 0.147 | 99.30 |
Table 4: Recovery of Drug and Impurities
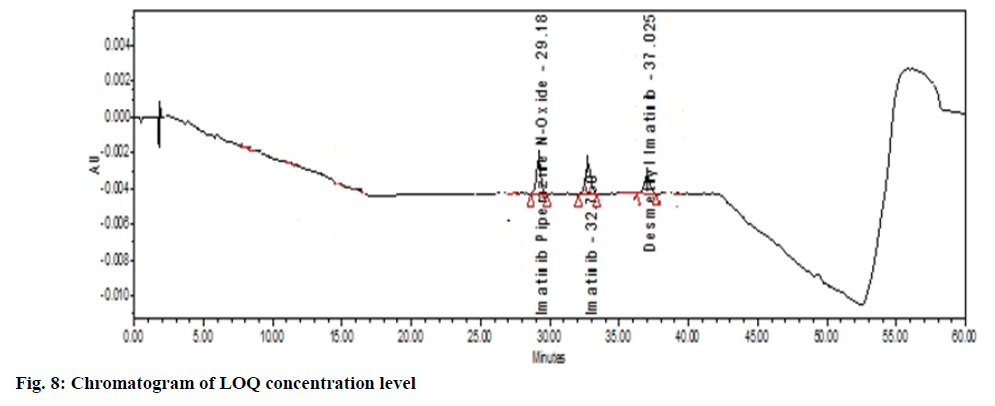
The LOD and LOQ of the method were analyzed and found to be 0.383 μg/ml and 1.15 μg/ml respectively and S/N ratio of imatinib mesylate and its impurities was found 24.075 (should be >10) which is high to increase the range and utility of method, Table 5 and fig. 8. The forced stability study of drug showed the different percentage of recovery. In alkali condition the samples had moderate degradation. In peroxide, more than 30 % of the samples were degraded if the time exceeds more than 10 min. So, the time was kept below 10 min for peroxide degradation, Table 6.
| Peaks | RT (min) |
Purity angle | Purity threshold | Area (µV*s) |
S/N ratio |
|
|---|---|---|---|---|---|---|
| Imatinib-piperazine-n-oxide | 29.185 | 2.140 | 3.427 | 44 673 | 24.26 | |
| Imatinib mesylate | 32.750 | 2.410 | 3.761 | 47 818 | 24.07 | |
| n-Desmethyl imatinib | 37.025 | 4.226 | 5.925 | 29 899 | 23.84 |
Note: RT: Retention Time
Table 5: Observation of LOQ Level
| Sample | Storage condition | Area (%) | Degradation (%) | Purity angle | Purity threshold |
|---|---|---|---|---|---|
| Control | Room temp | 99.838 | - | 0.158 | 1.008 |
| Acid degradation | 5 N HCl, 80°, 2 h | 93.773 | 6 | 0.137 | 1.010 |
| Alkali degradation | 5 N NaOH, 80°, 2 h | 85.227 | 15 | 0.083 | 1.007 |
| Peroxide degradation | 30 % H2O2, 80°, 10 min | 81.631 | 18 | 0.227 | 1.015 |
| Thermal degradation | 105°, 90 h | 99.855 | 0 | 0.201 | 1.011 |
Table 6: Summary of Forced Degradation
The developed method was found robust because when conditions were changed, the chromatographic conditions show no significant alteration. This proves the robustness of the developed method, Table 7. The stability of analytical solution was studied and found stable when analyzed for 12 h of duration. The percentage recovery of sample drug at different time interval proves stability in mobile phase, Table 8.
| Chromatographic changes | *Sample | Mean RT (min) | Area | % Area |
|---|---|---|---|---|
| Condition I | ||||
| Flow rate (ml/min): 1.0 Temperature (°): 25 | Drug | 27.476 | 39 115 729 | 98.59 |
| UV-Wavelength (nm): 230 | Impurity-1 | 26.234 | 51 625 | 0.13 |
| Mobile phase composition: 50:50 (Organic:Inorganic) | Impurity-2 | 28.816 | 60 047 | 0.15 |
| Condition II | ||||
| Flow rate: 0.9 ml/min | Drug | 34.109 | 65 045 541 | 98.5 |
| Impurity-1 | 30.777 | 117 507 | 0.18 | |
| Impurity-2 | 39.484 | 77 504 | 0.12 | |
| Flow rate: 1.1 ml/min | Drug | 30.752 | 54 725 639 | 98.59 |
| Impurity-1 | 27.905 | 94 927 | 0.17 | |
| Impurity-2 | 35.476 | 60 446 | 0.11 | |
| Condition III | ||||
| Temperature: 20° | Drug | 39.167 | 59 556 860 | 98.61 |
| Impurity-1 | 35.185 | 105 349 | 0.17 | |
| Impurity-2 | 45.365 | 65 297 | 0.11 | |
| Temperature: 30° | Drug | 27.345 | 59 523 720 | 98.59 |
| Impurity-1 | 24.853 | 100 333 | 0.17 | |
| Impurity-2 | 30.898 | 68 309 | 0.11 | |
| Condition IV | ||||
| Mobile phase composition: 48:52 (Methanol:Buffer) | Drug | 46.005 | 59 501 940 | 98.6 |
| Impurity-1 | 42.119 | 1 13 000 | 0.19 | |
| Impurity-2 | 49.036 | 64 841 | 0.11 |
Note: Drug: Imatinib mesylate; Impurity-1: Imatinib-piperazine-n-oxide; Impurity-2: n-Desmethyl-imatinib
Table 7: Robustness Study Data of Chromatographic Conditions
| Time (min) |
Imatinib-piperazine-n-oxide | Imatinib mesylate | Desmethyl imatinib | |||
|---|---|---|---|---|---|---|
| Area counts (µV*s) | % Difference | Area counts (µV*s) | % Difference | Area counts (µV*s) | % Difference | |
| Initial | 102 016 | 0 | 5 034 568 | 0 | 94 707 | 0 |
| 62 | 105 360 | 3.28 | 5 087 450 | 0.34 | 95 504 | 0.84 |
| 185 | 101 861 | 0.15 | 4 967 932 | 0.97 | 96 555 | 1.95 |
| 247 | 103 237 | 1.20 | 4 987 509 | 4.72 | 100 461 | 6.08 |
| 309 | 102 567 | 0.54 | 4 806 794 | 2.57 | 96 181 | 1.56 |
| 371 | 102 864 | 0.83 | 4 912 054 | 1.97 | 92 821 | 1.99 |
| 433 | 103 960 | 1.91 | 4 890 721 | 0.30 | 92 443 | 2.39 |
| 494 | 107 523 | 5.40 | 4 987 042 | 1.62 | 93 101 | 1.70 |
| 556 | 101 615 | 0.39 | 4 798 709 | 3.56 | 92 053 | 2.80 |
| 618 | 98 807 | 3.15 | 4 876 094 | 2.20 | 92 584 | 2.24 |
| 700 | 96 824 | 5.09 | 4 789 908 | 3.38 | 90 566 | 4.37 |
| 11.66 h | 95 826 | 6.06 | 4 718 732 | 4.14 | 89 456 | 5.54 |
Table 8: Summarry of Stability in Analytical Solution
In conclusion to development of method, it was found to be very simple, sensitive, accurate and economical. In this study an effective HPLC method was developed for separation and quantification of imatinib mesylate, imatinib-piperazine-n-oxide and n-Desmethyl imatinib with high accuracy and precision. Thus, it can be concluded that the proposed method was sufficiently sensitive, reproducible and specific for analysis of imatinib mesylate and its closely related substance in drug substance and drug product within a short analysis of time. The above method was validated by evaluating different parameter according to ICH guidelines like linearity, precision, accuracy, LOD and LOQ, robustness and stability. Robustness study concluded that developed method was highly robust and accurate. Stability study in forced condition imparts that the appropriate storage condition must be provided during storage and handling of drug and transportation of drug products. Thus, the developed method was accurate and precise and robust for drug substance quality measurement realization; maintain a state of quality control that accomplishes quality control of drug substance. So, these approach also disseminating the continuous control and improvement of analytical procedure. Hence, the developed and validated method was suitable and fit for the life cycle management of drug substance.
Acknowledgements:
The authors would like to be grateful to the authorities of Babu Banarasi Das National Institute of Technology and Management (BBDNITM), Lucknow, India for fund and providing required facilities to carry out the proposed work and also thankful to the Sun Pharma Laboratories, Gurugram, India for providing the standard drug imatinib mesylate and impurities imatinib-piperazine-n-oxide and n-Desmethyl imatinib.
Conflict of interests:
The authors have no conflict of interest to report.
References
- Druker BJ, Lydon NB. Lessons learned from the development of an abl tyrosine kinase inhibitor for chronic myelogenous leukemia. J Clin Invest 2000;105(1):3-7.
[Crossref] [Google Scholar] [Pub Med]
- Gambacorti-Passerini CB, Gunby RH, Piazza R, Galietta A, Rostagno R, Scapozza L. Molecular mechanisms of resistance to imatinib in Philadelphia-chromosome-positive leukaemias. Lancet Oncol 2003;4(2):75-85.
[Crossref] [Google Scholar] [Pub Med]
- Kerkelä R, Grazette L, Yacobi R, Iliescu C, Patten R, Beahm C, et al. Cardiotoxicity of the cancer therapeutic agent imatinib mesylate. Nat Med 2006;12(8):908-16.
[Crossref] [Google Scholar] [Pub Med]
- D’Avolio A, Simiele M, De Francia S, Ariaudo A, Baietto L, Cusato J, et al. HPLC-MS method for the simultaneous quantification of the antileukemia drugs imatinib, dasatinib and nilotinib in human peripheral blood mononuclear cell (PBMC). J Pharm Biomed Anal 2012;59:109-16.
[Crossref] [Google Scholar] [Pub Med]
- Bende G, Kollipara S, Movva S, Moorthy G, Saha R. Validation of an HPLC method for determination of imatinib mesylate in rat serum and its application in a pharmacokinetic study. J Chromatogr Sci 2010;48(5):334-41.
[Crossref] [Google Scholar] [Pub Med]
- Mlejnek P, Novak O, Dolezel P. A non-radioactive assay for precise determination of intracellular levels of imatinib and its main metabolite in Bcr-Abl positive cells. Talanta 2011;83(5):1466-71.
[Crossref] [Google Scholar] [Pub Med]
- Aleti P, Venisetty RK, Kamarapu SK. Development of RP HPLC method for the analysis of imatinib mesylate using PDA detector and its application in the evaluation of marketed preparation. Int J Pharm Biol Sci 2011;1(2):14-8.
- Ramakrishna K, Raman NV, Rao KN, Prasad AV, Reddy KS. Development and validation of GC–MS method for the determination of methyl methanesulfonate and ethyl methanesulfonate in imatinib mesylate. J Pharm Biomed Anal 2008;46(4):780-3.
[Crossref] [Google Scholar] [Pub Med]
- Vivekanand VV, Rao DS, Vaidyanathan G, Sekhar NM, Kelkar SA, Puranik PR. A validated LC method for imatinib mesylate. J Pharm Biomed Anal 2003;33(5):879-89.
[Crossref] [Google Scholar] [Pub Med]
- Mičová K, Friedecký D, Faber E, Polýnková A, Adam T. Flow injection analysis vs. ultra high performance liquid chromatography coupled with tandem mass spectrometry for determination of imatinib in human plasma. Clin Chim Acta 2010;411(23-24):1957-62.
[Crossref] [Google Scholar] [Pub Med]
- Satyanarayana G, Ramesh E, Kumar PJ, Rao K H, Sridhar B, Nagaraju P. Development and validation of new reversed phase high performance liquid chromatography method for the estimation of imatinib in bulk and pharmaceutical dosage forms. Int J Res Pharm Biomed Sci 2010;1:683-86.
- Teoh M, Narayanan P, Moo KS, Radhakrisman S, Pillappan R, Bukhari NI, et al. HPLC determination of imatinib in plasma and tissues after multiple oral dose administration to mice. Pak J Pharm Sci 2010;23(1):35-41.
- ICH Harmonized Tripartite Guidelines. ICH (Q2A), Test on Validation of Analytical Procedures, IFPMA. In: Proceedings of the International Conference on Harmonization, Geneva; 1994.
- ICH Harmonized Tripartite Guidelines. ICH (Q2B), Test on Validation of Analytical Procedures: Methodology, IFPMA. In: Proceedings of the International Conference on Harmonization, Geneva; 1996.
- ICH Harmonized Tripartite Guidelines. ICH (Q2R1) Validation of Analytical Procedures: Text and Methodology. International Conference on Harmonization, Geneva; 2005.
