- *Corresponding Author:
- R. B. Kakde
Department of Pharmaceutical Sciences, Rashtrasant Tukadoji Maharaj Nagpur University, Nagpur, Maharashtra, 440033,India
E-mail: drkakde@yahoo.com
| Date of Received | 03 May 2020 |
| Date of Revision | 09 August 2021 |
| Date of Acceptance | 01 February 2022 |
| Indian J Pharm Sci 2022;84(1):130-136 |
This is an open access article distributed under the terms of the Creative Commons Attribution-NonCommercial-ShareAlike 3.0 License, which allows others to remix, tweak, and build upon the work non-commercially, as long as the author is credited and the new creations are licensed under the identical terms
Abstract
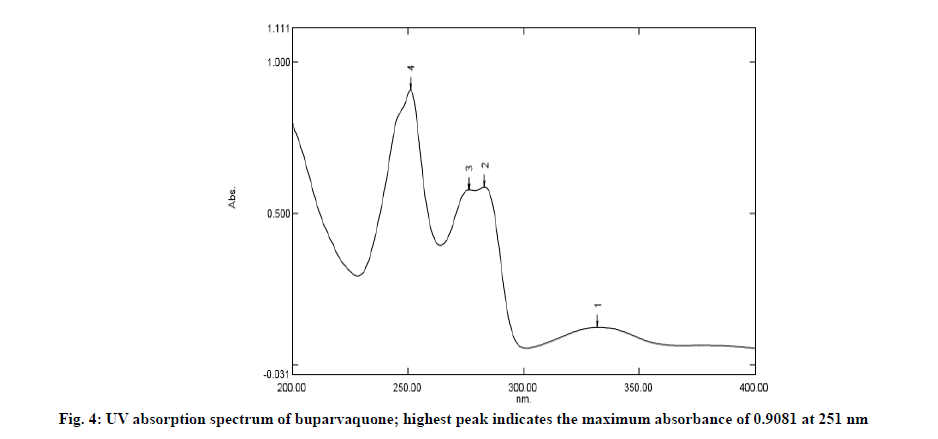
A novel, simple, accurate, precise, economical and reliable ultraviolet spectrophotometric method has been developed for the estimation of buparvaquone in bulk and in pharmaceutical dosage form. The drug shows maximum absorption at 251 nm by using acetonitrile as solvent. The method was validated as stated in International Council for Harmonisation Q2 (R1) guidelines. It obeys Beer’s law in the concentration range of 2-20 μg/ml with correlation coefficient of 0.998. The drug shows great accuracy close to 100 %. The method was found to be robust and precise as the relative standard deviation are less than 2 %. Limit of detection and limit of quantitation were found to be 0.60 μg/ml and 1.83 μg/ml respectively. From the results of specificity, the drug was found to be more degraded under alkaline, oxidative and photolytic conditions. The proposed method can be employed for the reliable quantification of buparvaquone in bulk and routine analysis of pharmaceutical formulations.
Keywords
Buparvaquone, ultraviolet method, validation, spectrophotometry
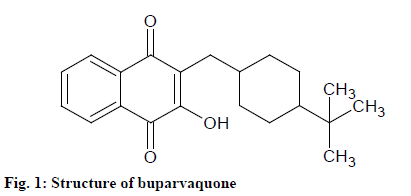
Leishmaniasis is a very complex disease which is caused by an intracellular protozoan parasite of genus Leishmania. Humans areinfected secondarily while most forms of leishmaniasis are zoonotic. It can be Cutaneous Leishmaniasis (CL) or Visceral Leishmaniasis (VL) which in turn is highly fatal if left untreated [1-3]. For the treatment of both forms of leishmaniasis, buparvaquone is used [4]. Buparvaquone, 2- [(4-tert-butylcyclohexyl) methyl]-3-hydroxynaphthalene-1,4-dione (fig. 1), is a second-generation hydroxynaphthoquinone drug which resembles structurally with antiprotozoan drug, parvaquone and atovaquone [5].
Initially it was developed as an antimalarial drug [6] and is currently the most promising compound for the treatment of theileriosis [7,8]. It was found to be 20 times more active than parvaquone in case of Theileria parva infection also known as East coast fever [9]. Buparvaquone is poorly soluble in water having solubility less than 1 mg/l making drug highly lipophilic. Therefore, it is also poorly soluble in various biological media like gastric fluids. Thus, buparvaquone have less oral bioavailability [10]. These problems have led the way to the synthesis of water-soluble phosphate prodrugs of buparvaquone having water solubility higher than 3.5 μg/ml within the pH range of 3.0-7.4 [11-13].
Literature survey discloses that there are specific techniques available for the estimation of buparvaquone like Reverse Phase High Performance Liquid Chromatography (RP-HPLC) method, bioanalytical method and spectrofluorimetric method [14-16]. The current study was designed to develop a cheap, novel accurate and precise Ultraviolet (UV) method [17] for the estimation of buparvaquone in bulk and in pharmaceutical preparation.
Materials and Methods
Buparvaquone active pharmaceutical ingredient has been obtained as a gift sample from Dr. Lalatsa lab, University of Portsmouth, United Kingdom. Pharmaceutical formulation in the form of tablets (buparvaquone 100 mg) was purchased from the local market manufactured by Vet Biochem India Pvt. Ltd, Pune, Maharashtra, India. All the solvents used were of HPLC grade and reagents were of Analytical Reagent (AR) grade.
Preparation of standard solution:
10 mg of buparvaquone was weighed accurately and dissolved in a small quantity of acetonitrile and the final volume was made up to 10 ml with the same. It was sonicated for 15 min to get a clear solution (concentration 1000 μg/ml). 1 ml from the above solution was taken out and diluted up to 100 ml to achieve the final concentration of 10 μg/ml.
Preparation of sample solution:
For sample preparation, acetonitrile was used as a solvent for extraction and dilution. 20 tablets of buparvaquone were weighed and finely pulverized. An accurately weighed powder of tablet equivalent to 10 mg of buparvaquone (40.58 mg) was transferred into a 10 ml volumetric flask. About 5 ml of acetonitrile was added and the mixture was sonicated for 15 min. The solution was allowed to cool at room temperature and then diluted with acetonitrile until it reaches the mark (stock solution 1000 μg/ml). The above solution is then filtered through Whatman filter paper having grade I. 1 ml of the filtrate was moved to a 100 ml volumetric flask and the volume was made up to the mark using acetonitrile to obtain a concentration of 10 μg/ml.
Preparation of forced degradation samples for specificity:
Acid degradation: 1 ml of the standard stock solution was diluted up to 10 ml with 2 N Hydrochloric Acid (HCl). This solution is heated under reflux for 18 h. 1 ml from the above-heated solution was neutralized with 2 N Sodium Hydroxide (NaOH) and again diluted with acetonitrile to achieve a concentration of 10 μg/ml. Then the absorbance of the resulted sample was taken at 251 nm and Percentage Drug Estimation (% DE) was calculated.
Alkaline degradation: From the prepared standard stock solution 1 ml was diluted up to 10 ml with 1 N NaOH. This solution is heated under reflux for 8 h. 1 ml from the above-heated solution was neutralized with 1 N HCl and then again diluted with acetonitrile to achieve the final concentration, which is 10 μg/ml. The absorbance of final concentration was taken at 251 nm and % DE was calculated.
Oxidative degradation: 1 ml from the previously prepared standard stock solution was diluted up to 10 ml with 30 % Hydrogen Peroxide (H2O2). The mixture was placed at room temperature for 24 h. And to achieve the concentration of 10 μg/ml, 1 ml from the resultant solution was diluted using acetonitrile. Then the absorbance was taken using acetonitrile as blank at 251 nm and % DE was calculated.
Neutral hydrolysis: 1 ml from the standard stock solution of 1000 μg/ml was diluted up to 10 ml with water. The mixture was refluxed on a water bath for 24 h. 1 ml from the resultant solution was diluted by using acetonitrile to achieve the final concentration. Then the absorbance was taken at 251 nm and % DE was calculated.
Thermal degradation: An accurately weighed 10 mg of buparvaquone was kept in an oven at 80 for 4 h. After 4 h, the resultant sample was solubilized in 10 ml acetonitrile to obtain a concentration of 1000 μg/ ml. 1 ml from it was again diluted up to 100 ml with acetonitrile in order to gain required concentration of 10 μg/ml. The absorbance of final concentration was taken at 251 nm using acetonitrile as blank and % DE was calculated.
Photolytic degradation: 10 mg of buparvaquone was weighed accurately and kept in sunlight for 15 d. After 15 d, the resultant sample was diluted by using 10 ml acetonitrile to obtain a concentration of 1000 μg/ml. 1 ml from it was then again diluted using acetonitrile up to 100 ml to achieve the final concentration of 10 μg/ ml. Then the absorbance was taken at 251 nm and % DE was calculated.
Characterization of buparvaquone:
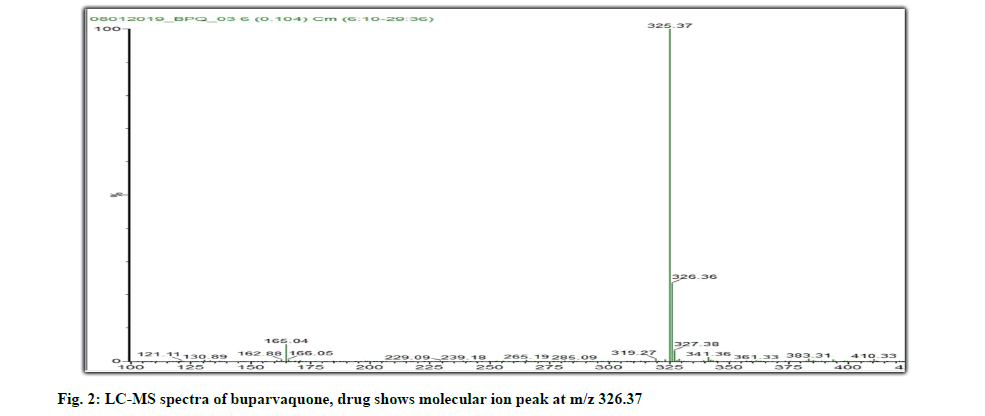
Liquid Chromatography-Mass Spectroscopy (LCMS) data: Sample solution of buparvaquone when subjected to LC-MS gives a molecular ion peak at massto- charge (m/z) of 326.37 as shown in fig. 2. It gives us idea regarding the molecular mass of buparvaquone. The theoretical mass is 326 g/mol which is close to the m/z value.
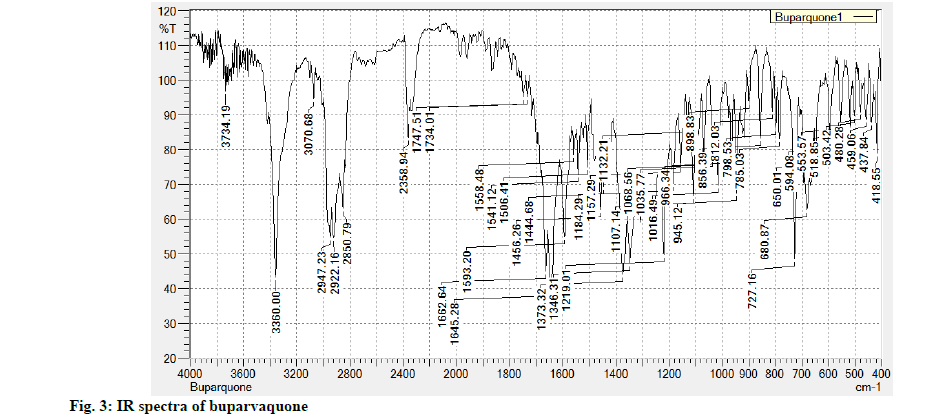
Infrared Spectroscopy (IR) data: Powder of buparvaquone when mixed with Potassium Bromide (KBr) and subjected to IR spectrometer gives various absorption bands in cm-1 like 3360 (OH stretch), 1662 (C=O stretch), 1373 (Ar C=C stretch), 3070 (Ar C-H stretch), 1734 (cyclic 6 membered stretch) as shown in fig. 3.
Determination of working wavelength:
Standard solution was scanned in UV range (400-200 nm) in 1.0 cm quartz cell against solvent blank. The wavelength of maximum absorbance (λmax) was found to be at 251 nm which was used in further study. The UV absorption spectrum of the drug is depicted in fig. 4.
Results and Discussion
Estimation of buparvaquone in marketed formulation was shown below. The absorbance of final concentration of sample solution was measured in 1.0 cm matched pair quartz cell at 251 nm against solvent blank. Also the absorbance of standard solution is taken. 6 such replicate estimations were performed. The content of buparvaquone was calculated using direct comparison method by the following formula.
% Estimation=Asample×Concentrationstandard×DF×Avg. wt./Astandard×Weight taken×LC
Where, Asample is absorbance of sample; Concentrationstandard is concentration of standard; DF is dilution factor; Avg. wt. is average weight of tablets;Astandard is absorbance of standard; Weight taken is weight of tablet powder taken; LC is Labelled Claim.
Drug content in marketed formulation was found to be 100.03 % and the results are shown in Table 1.
| Buparvaquone tablet (Average weight, 405.83 mg for 100 mg of buparvaquone) | |||||
|---|---|---|---|---|---|
| S. No. | Weight taken (mg) | Standard concentration (µg/ml) | Absorbance at 251 nm | % DE | |
| Standard | Sample | ||||
| 1 2 3 4 5 6 |
40.5 40.5 40.6 40.5 40.6 40.6 |
10.00 10.00 10.00 10.00 10.00 10.00 |
0.9081 0.9081 0.9083 0.9081 0.9082 0.9082 |
0.9076 0.9078 0.9075 0.9078 0.9079 0.9078 |
100.14 100.17 99.87 100.17 99.92 99.91 |
| Mean ±SD % RSD |
100.03 0.1445 0.1444 |
||||
Note: Average weight was calculated as 405.83 mg for 100 mg of buparvaquone drug
Table 1: Results For Estimation of Buparvaquone in Marketed Formulation
Validation of the method was carried out as stated in International Council for Harmonisation (ICH) guidelines. The parameters which were evaluated are linearity, precision, robustness, accuracy, specificity, Limit of Detection (LOD) and Limit of Quantitation (LOQ).
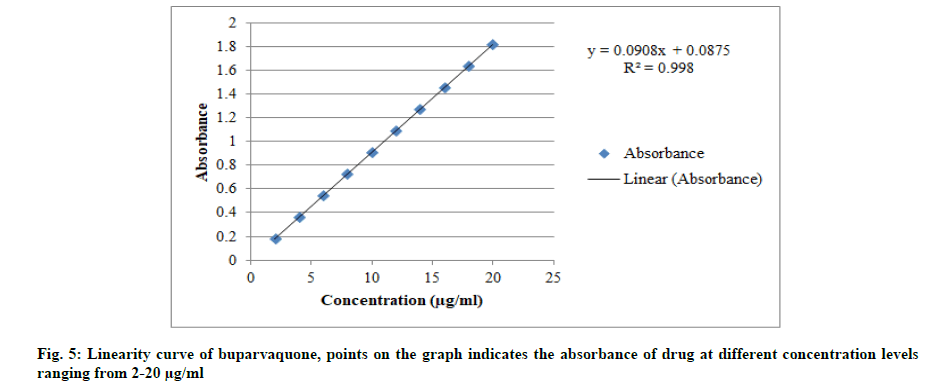
An accurately measured standard stock solution B was diluted with acetonitrile to get the concentration range 2 μg/ml to 20 μg/ml. The absorbance of each of the solution was measured at 251 nm against blank which was prepared in same way as the final dilution. The graph of concentration versus absorbance was plotted and slope, Y-intercept and correlation coefficient (R2) was calculated. From the calibration curve (shown in fig. 5), it was found that the method is linear within the concentration ranging from 2-20 μg/ml having a correlation coefficient of 0.998. The results are summarized in Table 2.
| Parameters | Result |
|---|---|
| Linear dynamic range (µg/ml) | 2-20 |
| Slope | 0.0908 |
| Intercept | 0.0875 |
| Correlation coefficient (R2) | 0.998 |
Note: Linearity is checked for the concentration range of 2-20 μg/ml
Table 2: Results For Linearity of Method
Accuracy of the method was confirmed on the basis of recovery studies carried out by using the standard addition method at three different levels of the labeled claim (80 %, 100 % and 120 % w/w). In the solution of accurately weighed pre analyzed powder, standard drug was added and absorbance of final solutions was measured in 1 cm cell at 251 nm against solvent blank. Then percent (%) recovery was calculated. % recovery near 100 % represents the accuracy of the method. Results are shown in Table 3.
| Buparvaquone tablets (Average weight, 405.83 mg for 100 mg of buparvaquone) | |||||
|---|---|---|---|---|---|
| S. No. | Weight of tablet powder taken (mg)+Amount of pure drug added (mg) | Standard concentration (µg/ml) | Total drug present (mg) | Total drug found (mg) | % Recovery |
| 1. 2. 3. |
41.6+8 41.5+10 41.7+12 |
10 10 10 |
18 20 22 |
17.93 19.58 21.82 |
99.64* 97.94* 99.18* |
| Mean ±SD % RSD |
98.93 0.8817 0.8901 |
||||
Note: *Each value is mean of three observations
Table 3: Results For Accuracy Studies of Buparvaquone
Precision of any analytical method is expressed as Standard Deviation (SD) and Relative Standard Deviation (% RSD) of series of measurements. Intraday was done by taking the absorbance of six samples three times in a single day while interday was done by taking the absorbance of six samples on three different days. Precision by different analyst or ruggedness was done by taking absorbance of six samples using three different analysts. Table 4 represents the result of precision done on interday, intraday and using different analyst. All the values are under permissible limits.
| S. No. | % DE | ||
|---|---|---|---|
| Interday* | Intraday* | Different analyst* | |
| 1 2 3 |
99.73 98.69 98.87 |
99.33 98.51 99.53 |
99.51 99.46 99.62 |
| Mean ±SD % RSD |
99.09 0.5558 0.5608 |
99.12 0.5404 0.5452 |
99.53 0.0818 0.0822 |
Note: *Results are mean of six observations
Table 4: Results For Precision Studies Of Buparvaquone
The robustness of the proposed method was studied by making small alterations in wavelength (±2 nm) and taking absorbance of six such replicates. The values were recorded as SD and % RSD and the proposed method was found to be robust by changing its wavelength and the results are shown in Table 5.
| S. No. | Wavelength (±2 nm) | % DE |
|---|---|---|
| 1. 2. 3. |
249 251 253 |
100.13* 99.47* 99.73* |
| Mean ±SD % RSD |
99.77 0.3322 0.3333 |
|
Note: *Results are mean of six observations
Table 5: Results For Robustness of Method
LOD and LOQ determination were done with method based on SD of the response and the slope of calibration curve. LOD was found to be 0.60 μg/ml by using the formula, 3.3 σ/S and LOQ was found to be 1.83 μg/ml by employing the formula 10 σ/S where σ is the SD and S is the slope.
Specificity of the method was done by using forced degradation studies. Buparvaquone was subjected to various stress conditions and then the absorbance was taken. From the results of specificity shown in Table 6, it was clearly seen that the drug gets more degraded under alkaline, oxidative and photolytic conditions.
| Acid | Base | Neutral | Oxidative | Thermal | Photolytic | |
|---|---|---|---|---|---|---|
| Stressor concentration | 2 N HCl | 1 N NaOH | H2O | 30 % H2O2 | Hot air oven | Sunlight |
| Duration | Reflux, 18 h | Reflux, 8 h | Reflux, 24 h | RT, 24 h | 80°, 4 h | 15 d |
| % of active buparvaquone | 97.60 | 82.64 | 95.72 | 88.49 | 97.07 | 91.21 |
Note: N stands for Normality and RT is Room Temperature
Table 6: Results For Specificity of Method
In the current investigation, novel analytical method was developed by using UV spectrophotometer and it was found to be simple, accurate, precise and inexpensive. Characterization of buparvaquone was done by using IR and LC-MS. The proposed method was validated according to ICH Q2 (R1) guidelines and satisfactory results are obtained. The method was found suitable for the routine analysis of buparvaquone in bulk and in pharmaceutical preparation. Low cost of reagents, high accuracy and precision, speed and easy sample treatment are the advantages of this method.
Acknowledgements:
The authors are thankful to Department of Pharmaceutical Sciences, Rashtrasant Tukadoji Maharaj Nagpur University, Nagpur for providing the facilities to carry out the research work and also thankful to School of Pharmacy and Biomedical Sciences, University of Portsmouth for providing Active Pharmaceutical Ingredient (API) of buparvaquone required for estimation.
Conflict of interests:
The authors declared no conflict of interest.
References
- Desjeux P. Leishmaniasis: Current situation and new perspectives. Comp Immunol Microbiol Infect Dis 2004;27(5):305-18.
[Crossref] [Google Scholar] [PubMed]
- Liew FY. O’ Donnell CA. Immunology of leishmaniasis. Adv Parasitol 1993;32:161-259.
[Crossref] [Google Scholar] [PubMed]
- Murray HW, Berman JD, Davies CR, Saravia NG. Advances in leishmaniasis. Lancet 2005;366(9496):1561-77.
[Crossref] [Google Scholar] [PubMed]
- Mäntylä A, Garnier T, Rautio J, Nevalainen T, Vepsälainen J, Koskinen A, et al. Synthesis, in vitro evaluation and antileishmanial activity of water-soluble prodrugs of buparvaquone. J Med Chem 2004;47(1):188-95.
[Crossref] [Google Scholar] [PubMed]
- Garnier T, Mäntylä A, Järvinen T, Lawrence MJ, Brown MB, Croft SL. Topical buparvaquone formulations for the treatment of cutaneous leishmaniasis. J Pharm Pharmacol 2007;59(1):41-9.
[Crossref] [Google Scholar] [PubMed]
- Hudson AT, Randall AW, Fry M, Ginger CD, Hill B, Latter VS, et al. Novel anti-malarial hydroxynaphthoquinones with potent broad spectrum anti-protozoal activity. Parasitology 1985;90(1):45-55.
[Crossref] [Google Scholar] [PubMed]
- Brown CG. Control of tropical theileriosis (Theileria annulata infection) of cattle. Parassitologia 1990;32(1):23-31.
[Google Scholar] [PubMed]
- Shkap V, Leibovich B, Krigel Y, Fish L, Orgad U. Evaluation of the combined formulation of parvaquone and frusemide (Fruvexon) in the treatment of experimental tropical theileriosis. Intern J Appl Res Vet Med 2010;8(1):73-7.
- McHardy N, Wekbsa LS, Hudson AT, Randall AW. Antitheilerial activity of BW720C (buparvaquone): A comparison with parvaquone. Res Vet Sci 1985;39(1):29-33.
[Google Scholar] [PubMed]
- Müller RH, Jacobs C. Buparvaquone mucoadhesive nanosuspension: Preparation, optimisation and long-term stability. Int J Pharm 2002;237(1-2):151-61.
- Venkatesh G, Ramanathan S, Mansor SM, Nair NK, Sattar MA, Croft SL, et al. Development and validation of RP-HPLC-UV method for simultaneous determination of buparvaquone, atenolol, propranolol, quinidine and verapamil: A tool for the standardization of rat in situ intestinal permeability studies. J Pharm Biomed Anal 2007;43(4):1546-51.
[Crossref] [Google Scholar] [PubMed]
- Venkatesh G, Majid MI, Ramanathan S, Mansor SM, Nair NK, Croft SL, et al. Optimization and validation of RP‐HPLC‐UV method with solid‐phase extraction for determination of buparvaquone in human and rabbit plasma: Application to pharmacokinetic study. Biomed Chromatogr 2008;22(5):535-41.
[Crossref] [Google Scholar] [PubMed]
- Venkatesh G, Majid MI, Mansor SM, Nair NK, Croft SL, Navaratnam V. In vitro and in vivo evaluation of self-microemulsifying drug delivery system of buparvaquone. Drug Dev Ind Pharm 2010;36(6):735-45.
[Crossref] [Google Scholar] [PubMed]
- Manzoori JL, Jouyban A, Amjadi M, Panahi-Azar V, Karami-Bonari AR, Tamizi E. Spectrofluorimetric determination of buparvaquone in biological fluids, food samples and a pharmaceutical formulation by using terbium-deferasirox probe. Food Chem 2011;126(4):1845-9.
[Crossref] [Google Scholar] [PubMed]
- Muraguri GR, Ngumi PN, Wesonga D, Ndungu SG, Wanjohi JM, Bang K, et al. Clinical efficacy and plasma concentrations of two formulations of buparvaquone in cattle infected with East Coast fever (Theileria parva infection). Res Vet Sci 2006;81(1):119-26.
[Crossref] [Google Scholar] [PubMed]
- Kutubuddin ST, Suresh SS, Baliram KR, Aikaterini L. Development and validation of stability indicating method for estimation of buparvaquone by forced degradation studies. Indian J Pharm Educ Res 2020;54(3):790-7.
- Guideline IH. Validation of analytical procedures: Text and methodology Q2 (R1). Geneva: International Conference on Harmonization; 2005. p. 1-13.
