- *Corresponding Author:
- L. Mehta
Amity Institute of Pharmacy, Amity University, Noida, Uttar Pradesh 201301, India
E-mail: mehta.lovekesh@gmail.com
| Date of Received | 09 June 2022 |
| Date of Revision | 14 February 2023 |
| Date of Acceptance | 12 June 2023 |
| Indian J Pharm Sci 2023;85(3):740-752 |
This is an open access article distributed under the terms of the Creative Commons Attribution-NonCommercial-ShareAlike 3.0 License, which allows others to remix, tweak, and build upon the work non-commercially, as long as the author is credited and the new creations are licensed under the identical terms
Abstract
According to Food and Drug Administration requirements, a simple, sensitive and specific liquid chromatography-tandem mass spectrophotometry method for quantifying diclofenac in human plasma was developed and fully validated. Electrospray ionisation in the positive mode produced protonated ions, which were utilised to detect analyte and fluconazole (internal standard). Protein precipitation generated by acetonitrile was used to extract the analytes, followed by liquid-liquid extraction with ethyl acetate. The reversed phase separation was performed on a Chr omolith speed ROD RP-18e (4.6 mm×50 mm) column with a simple isocratic mobile phase of 10 mM ammonium acetate in water, pH adjusted to 4.5 using acetic acid:acetonitrile in the ratio of (20:80, v/v) at a flow rate of 0.5 ml min-1. On a triple quadrupole mass spectrometer, fragmentation of Diclofenac m/z 296.10- (parent) and 250 (product) and Fluconazole m/z 307.20- (parent) and 220 (product) for internal standard was monitored. The devised method was verified in human plasma spanning a concentration range of 18.75 to 2000.25 ng ml-1, with a correlation coefficient (r2) of 0.9948. The detection was carried out using an electrospray ionisation approach on a triple quadrupole mass spectrometer that was used for multiple reaction monitoring. The intraday precision and accuracy values obtained from six different sets of quality control samples evaluated on different occasions ranged from 96.22-113.46 % and 2.66-9.95 %, respectively. For the analyte and internal standard, the overall recoveries were 61.98 3.97 and 55.01 1.18, respectively. The described approach was used to analyse diclofenac in human plasma samples with great performance.
Diclofenac, validation; liquid chromatography-tandem mass spectrophotometry; human plasma; multiple reaction monitoring; pharmacokinetics
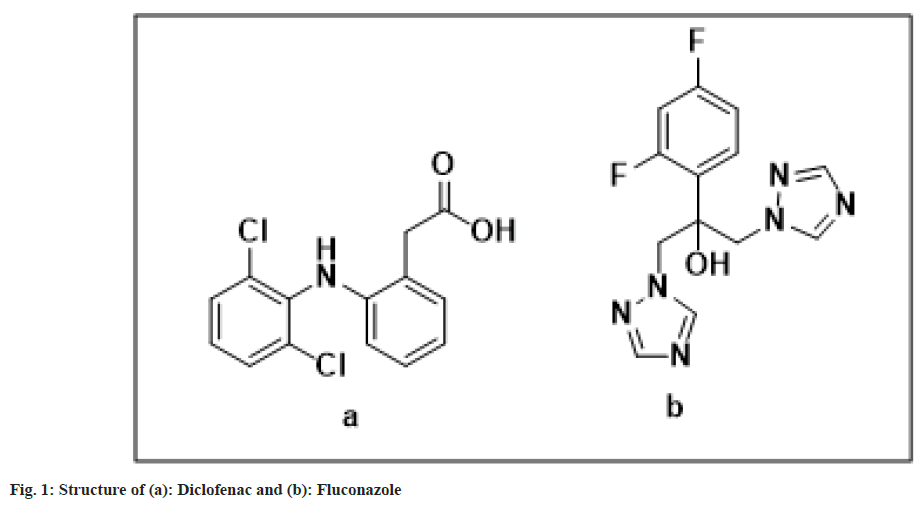
Diclofenac sodium, also known as 2-[(2,6-dichlorophenyl)amino]benzeneacetic acid, monosodium salt, is a non-steroidal anti-inflammatory medication. It is used to treat mild to moderate pain, osteoarthritis and rheumatoid arthritis. Diclofenac sodium is rapidly and completely absorbed when taken orally. Diclofenac binds to plasma albumin in large amounts[1-3]. Diclofenac has a molecular weight of 296.18. Fig. 1 shows the chemical structures of diclofenac sodium and fluconazole[4-7].
Diclofenac has been quantified using a variety of analytical methods. High-Performance Liquid Chromatography (HPLC) methods for the determination of diclofenac in human plasma were developed by Nasir et al., Yilmaz et al. and Dahivelkar et al.[8-10] described a very sensitive HPLC technique with a lengthy retention duration. Many published procedures are less sensitive, have long retention duration and need multiple sample preparation processing stages, according to the findings [4-8].
Nasir et al.[8] devised an HPLC approach that included column swapping. A fully automated method based on liquid-solid extraction and column liquid chromatography was disclosed. An automated robotics system that aliquots biological samples, inserts the internal standard, extracts the drug from an acidified biological matrix into an organic phase, and concentrates extracts for analysis using a directly interfaced HPLC system was also built.
An extremely sensitive (1 ng ml-1) HPLC approach based on electrochemical detection for the measurement of diclofenac in biological fluid was described. Another HPLC approach with electrochemical detection for the quantitative measurement of diclofenac potassium in plasma was also reported. Another electrochemical detectionbased HPLC approach that requires twofold drug extraction utilising an organic solvent has been created. a rat plasma Ultra Performance Liquid Chromatography-tandem Mass Spectrometry (UPLC-MS/MS) technique based on Liquid-Liquid Extraction (LLE) was developed. Another Liquid Chromatography- tandem Mass Spectrometry (LCMS- MS) approach for the determination of diclofenac in mouse plasma has also been disclosed[9,10].
To the best of our knowledge, there is no method for analysing diclofenac sodium in rabbit plasma. The current study presents a high-throughput, easy, accurate and precise UPLC-MS/MS approach for diclofenac detection in rabbit plasma samples. The accuracy, precision, specificity, recovery, linearity and stability properties of the method were all validated. The benefits of the current method include a rapid and simple extraction operation employing only one solvent, a short run-time, low noise and good sensitivity and selectivity. Various LC-MS/MS methods are available[11-16].
The purpose of this current research was to explore the high selectivity and sensitivity of triple quadrupole MS system with an electrospray interface for development and validation of LC-MS/MS method for quantification of Diclofenac in human plasma using its structural analogue, Fluconazole as internal standard. The target Lower Limit Of Quantitation (LLOQ) for the method was ~20 ng ml-1.
Materials and Methods
Chemicals and reagents:
Diclofenac (Potency (w/w 99.7 %) and Fluoxetine (99.9 %) reference standards were obtained from MSN laboratory (Hyderabad, India). J.T. Baker provided the HPLC grade acetonitrile and methanol (Philipsburg, USA). Ammonium acetate (analytical grade) was acquired from Sigma Aldrich (Mumbai, India), sodium carbonate (HPLC grade) was purchased from Merck Specialties (Mumbai, India), and acetic acid (AR grade) was purchased from Merck Specialties (Mumbai, India) (RFCL Chemicals New Delhi, India). Vials from Eppendorf (Torsens products Pvt Ltd Kolkata, India) Millipore's Milli Q water purifying equipment was utilised to prepare the water for the LC-MS/MS analysis (Bangalore, India). Human plasma was obtained from Cauvery Diagnostics and the Hyderabad Blood Bank and kept at -20° until use.
Instrumentation and chromatographic conditions
HPLC Perkin-Elmer 200 Series (Perkin-Elmer Instruments LLC, Shelton, CT, USA) was used to perform chromatographic separation. It included a quaternary pump, a degasser, and an auto sampler with a thermostatted column compartment. The chemicals were evaluated on a reversed phase chromatographic column (50 mm×4.6 mm internal diameter) made by Chromolith Speed RODRP-18e (Merck KGaA, Germany). The temperature of the column was maintained at 352 degrees Celsius. A pre-mixed mixture of 10 mM ammonium acetate buffer and acetonitrile (20:80, v/v) was pumped at a flow rate of 0.5 mL min-1 as the mobile phase.
Mass Spectrometric analytical conditions
Multiple reaction monitoring (MRM) mode was used to detect mass using an API 4000 Q-Trap triple quadrupole apparatus (Applied Biosystems MDS SCIEX, Toronto, Canada). In positive ionisation mode, a turbo electrospray interface was used. Table 1 summarises the mass spectrometer's key operating parameters. The software package Analyst 1.4 was used to process the data (Applied Biosystems MDS SCIEX).
| Parameter | Value |
|---|---|
| Ion spray voltage (V) | 4200 |
| Temperature (°) | 420° |
| CUR (Curtain gas) | 20 |
| Collision gas (psi) | 5 |
| GS1 (psi) | 25 |
| GS2 (psi) | 45 |
| Declustering potential (V) | Diclofenac: 32.0 |
| Fluconazole: 50.0 | |
| Entrance potential (V) | 10 |
| Collision energy (V) | Diclofenac: 20.0 |
| Fluconazole: 25.0 | |
| Collision cell exit potential (V) | Diclofenac: 14.0 |
| Fluconazole: 15.0 | |
| CEM (Channel electron multiplier) | 2400 |
| Sample cooler temperature | 6° |
| Mode of Ionization | Positive |
Table 1: Tandem Mass Spectrometer Working Parameters
Standards and Quality Control (QC) sample preparation:
Diclofenac primary stock solution for calibration standard and QC samples were produced separately. Diclofenac primary stock solution and fluconazole (Internal Standard (IS)) primary stock solution were produced in methanol to a final concentration of 1.0 mg/ml each. Methanol was used to prepare further dilutions for calibration curve standards and QC samples. Spiking of aqueous dilutions made from original stock solution in plasma resulted in an eight-point calibration curve of diclofenac (18.75-2025 ng ml-1).
QC samples were generated in bulk at four concentration levels; 18.45 ng ml-1 for the LLOQ, 35.49 ng ml-1 for the Low QC (LQC), 422.50 ng ml-1 for the Medium QC (MQC), and 1689.99 ng ml-1 for the High QC (HQC). When not in use, primary stock solutions were maintained at 2-8°. Spiked calibration standards and QC samples were kept at a temperature of less than -50°.
Extraction of plasma samples:
In a 5 ml polypropylene tube, an aliquot of 200 ml plasma sample and 50 ml IS solutions (1000 ng/ ml fluconazole) were combined. Add 50 ml of 0.1 % formic acid and vortex, then add 2.5 ml of ethyl acetate. The sample was shaken for 10 min at 2000 rpm on a platform shaker, then centrifuged for 10 min at 4000 rpm. The organic layer was separated from the aqueous layer and evaporated to dryness under a nitrogen stream at 50°. The residue was reconstituted in 400 l of mobile phase, and 10 l were injected for analysis using LC-MS/MS.
Sample preparation:
A simple protein precipitation with methanol was used to prepare the samples. One set of plasma calibration curve standards, one or more sets of QC samples, and plasma samples to be analysed were thawed at room temperature or in a water bath kept at room temperature. The contents of the thawed samples were vortexed to achieve full mixing. About 100 ml of material was pipetted into a stoppered test tube, followed by 50 ml of 1000 ng ml-1 internal standard dilution (except in the blank) and vortexed. The extraction solution was added in 4 ml increments and vortexed for 60 sec. The test tubes were placed on a reciprocating shaker for 5 min at 175 rpm with the stoppers fastened. The test tubes were then centrifuged at 4000 rpm for 5 min (Eppendorf 5810 R, Eppendorf AG, Germany). About 3.0 ml of the supernatant organic layer was collected and evaporated to dryness for 15 min at 50° with a nitrogen flow of 15 psi. The residue was reconstituted in 400 l of reconstitution solution, transferred to HPLC vials, and a 10 l aliquot injected into the chromatographic apparatus.
Data processing and regression:
Analyst software version 1.4 was used to collect and process the data. Diclofenac to fluconazole peak area ratios were plotted vs. diclofenac concentration. Weighted least-squares linear regression was used to create the calibration charts.
Method validation:
The bioanalytical method validation followed the requirements of the European Medicines Agency (EMEA)[17] and the Food and Drug Administration (FDA)[18]. Selectivity/specificity, LLOQ, standard calibration curve, residual effect, precision and accuracy, extended precision and accuracy, recovery, matrix effect, dilution integrity test, reinjection reproducibility, and stability tests were used to validate the method. During the method validation runs, system appropriateness was employed to evaluate the system's performance.
System suitability test:
The System suitability test was performed at the start of each method validation run by injecting six replicates of an aqueous mixture of MQC and a working concentration of IS. The first five high system suitability samples were utilised to assess the system's consistency, with an allowed coefficient of variation of less than 6.0 % for the analyte/IS peak area ratio[19-23].
Selectivity/specificity and LLOQ:
Six different sources of blank human plasma samples were used to test selectivity and specificity. Using prescribed chromatographic conditions, an aqueous mixture of analyte(s) and IS was produced and injected to examine the retention time and mass transition of all peak of interest. The proposed extraction process was used to generate a blank matrix from at least six different batches and LLOQ spiked singly in each batch. By comparing the response in the blank matrix to the mean response of the extracted LLOQ, the inference at the RT of an analyte was evaluated. By comparing the response in the blank matrix to the mean response of the extracted internal standard, the interference at the RT of the internal standard was determined.
The selectivity was determined by examining blank plasma samples from six separate batches for interference at the diclofenac and fluconazole retention times. Five replicates of control human plasma and plasma spiked with the analyte at the lowest level of the calibration curve (18 ng ml-1) were analysed to determine sensitivity .
Standard calibration curve and residual effect:
Linearity was determined by examining a minimum of three analytical batches and using weighted least-square linear regression to calculate the concentrations of injected calibration curve standards. A calibration curve was made out of a blank sample (a plasma sample processed without the IS), a zero sample (a plasma sample processed with the IS), and eight non-zero samples ranging from 18.75 ng ml-1 to 2000.25 ng ml-1, including LLOQ. A correlation coefficient (r2) of 0.99 or greater was required for a calibration curve, and each back-calculated standard concentration had to be within 15 % deviation of the nominal value, except at the LLOQ, when the maximum allowed variation was set at 20 %.
Precision and accuracy:
Calculating the percent Coefficient of Variation (percent CV) for each level determined the method's precision. On the same day, repeat analysis of Diclofenac plasma samples was undertaken to determine intra-day accuracy and precision. A calibration curve was included in the run, as well as six replicates of LLOQ, LQC, MQC and HQC samples. Three precision and accuracy batches were analysed on three consecutive validation days to determine inter-day accuracy and precision. The deviation from the nominal concentration at each concentration level was supposed to be within 15.0 %, except for LLOQ, when it should be within 20.0.
Recovery:
For replicate spiked QC samples, the absolute recovery of Diclofenac and the internal standard was determined (LQC, MQC and HQC). 100 l of diluted aqueous QC samples (LQC, MQC, and HQC) containing equivalent concentration to spiked QCs, 50 l of IS dilution (1000 ng ml-1), and 250 l of reconstitution solution were used to make five sets of recovery comparison samples. As a result, the same amount of Diclofenac and internal standard is transferred in comparison samples as it is in the extracted QC samples.
Stability:
Stock solution, freeze-thaw, bench-top, Ininjector, refrigerated, room temperature, and longterm stability of diclofenac were studied as part of method validation. The stock solution stability was assessed by comparing it to freshly made stock solution at room temperature and at 2-8°. During freeze-thaw cycles, the stability of the spiked human plasma samples was assessed. For one and three freeze-thaw cycles, a replicate number of low and high QC samples were analysed. The fresh spiked calibration curve standards of concentration range equivalent to that utilised for the calculation of precision and accuracy were employed to quantify the freeze-thaw QC samples.
At 0, 3 and 5 h the bench top stability of five sets of low and high QC samples was assessed. The precision and accuracy of the QC samples were calculated using newly spiked calibration curve standards of concentration ranges identical to those used in the precision and accuracy calculations. The processed replicate low and high QC samples were placed in the auto injector three times and data was obtained for a period of 24 h to measure the in-injector stability. The QC samples were quantified against newly spiked calibration curve standards of concentration ranges equal to those used to calculate precision and accuracy for the computation of diclofenac stability. The response ratio of internal standard over analyte of each QC sample at 0, 6 and 24 h was compared to the respective response ratio of the 0 h samples for calculating internal standard stability.
After 9 d, the stability of the refrigerated stock solution was tested by injecting 5 duplicates of two dilution mixtures containing diclofenac equivalent to the middle QC sample concentration and IS equivalent to the working concentration. One dilution mixture contained diclofenac dilution from stored stock, whereas the other contained diclofenac dilution from fresh stock. For diclofenac stability calculations, the mean reaction ratio of diclofenac stored stock to IS was compared to the fresh stock value.
At 0 and 6 h, the stability of room temperature stock solutions was tested by injecting 5 replicates of a prepared stock dilution mixture comprising diclofenac equivalent to the middle QC sample concentration and IS equivalent to the working concentration. For diclofenac stability calculations, the mean response ratio of diclofenac upon IS at 6 h was compared to the 0 h value. Similarly, for IS stability estimates, the mean response ratio of IS after diclofenac at 6 h was compared to the 0 h value.
After 9 d of storage at/or below 50°, long-term stability was evaluated. Five replicates of QC samples with low and high concentrations were taken out of the freezer and allowed to thaw. These samples were extracted and injected into an auto injector. The QC samples were quantified against newly spiked calibration curve standards of concentration ranges equal to those used to calculate precision and accuracy for the computation of diclofenac stability.
Matrix effect:
The matrix effect was investigated to show that there is no significant endogenous input from human blank plasma that impacts analyte measurement. The matrix impact was assessed by comparing freshly spiked calibration standards to low and high QC samples from six separate batches of human plasma in duplicate. If the variation of the mean test responses was less than 15 % of the nominal concentration, no significant matrix impact was evaluated.
Dilution integrity:
Five sets of MQC and HQC samples were dilute two times with human plasma, while another five sets of MQC and HQC samples were dilute five times with human plasma. These QC samples were examined in conjunction with calibration curve standards, and the concentration of the QC samples was estimated using an appropriate dilution factor.
Carryover effect:
The carryover test was used to ensure that contamination was not carried over from one run to the next. The test began with the injection of a blank plasma sample, followed by the injection of a sample at the concentration of the calibration curve's highest level. The carryover impact was tested by injecting replicates of processed blank matrix samples after spiked human plasma samples from the processed ULOQ standard (STD-H). The average area of LLOQ standards was compared to the area in the blank sample (STD A). At the same retention durations for the analytes and IS, no substantial interference peaks (20 % of the LLOQ area and 5 % of the IS area) should be visible in the chromatograms of the blank plasma.
Results and Discussion
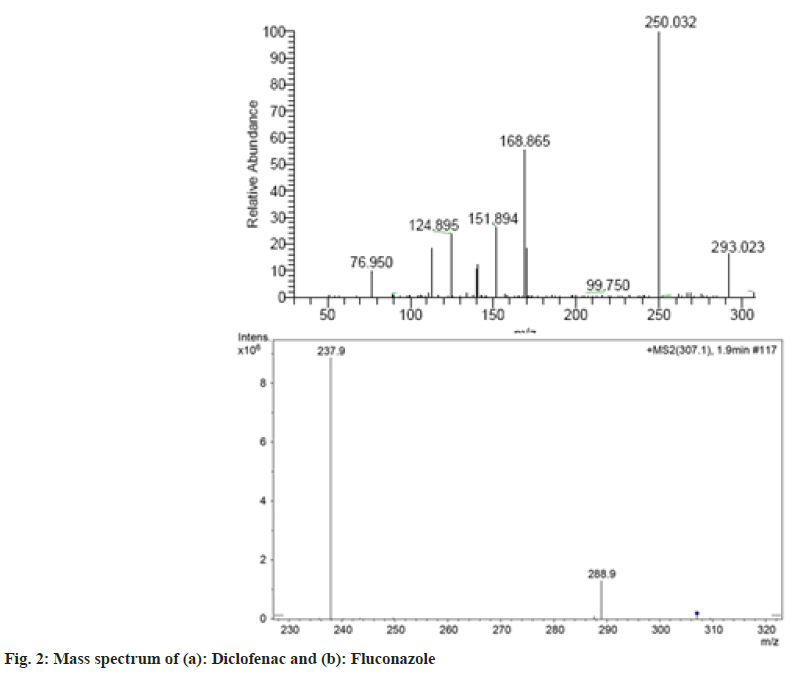
It was important to use tandem mass spectrophotometric (MS-MS) detection to design a method with the requisite LLOQ (18.75 ng ml- 1), as this provides a better limit of detection. MS-MS detection's inherent selectivity was thought to be useful in constructing a selective and sensitive technique. In positive ionisation mode, the product ion mass spectra of diclofenac and the IS are presented in fig. 2. To acquire the product ion spectra, the major [M]+ and [M+H]+ ions for diclofenac and IS respectively, were employed as the precursor ions.
For diclofenac, the most sensitive mass transition was from m/z 535.3 to m/z 288.2, while for the IS, it was from m/z 409.1 to m/z 205.2. The MRM state file parameters were optimized to maximise the analytes response. The parameters in Table 1 are the outcome of this optimization. Several trials were conducted to optimise the chromatographic parameters, particularly the mobile phase composition, in order to produce good resolution and symmetric peak shape, as well as a reduced run time for the analyte and the IS.
Various combinations of ammonium acetate buffer and methanol/acetonitrile were explored based on the literature. Acetonitrile was chosen over methanol because it lowers the baseline more effectively. The buffer was held at a molarity of 10 mM and blended with acetonitrile in a 2:8 ratios for better peak shape. The flow rate was tested between 0.2 and 0.8 ml min-1. The chromatographic system was designed with the goal of providing a shorter run time to ensure maximum throughput while also taking into account matrix effects and acceptable peak shapes. The analyte and the IS were eluted at 1.5 and 1.6 min, respectively, due to the high proportion of organic solvent in the mobile phase [10 mM ammonium acetate/acetonitrile (20/80, v/v)]. To achieve short run duration with good peak shape within 2.0 min, a flow rate of 0.5 ml min-1 was chosen. Fluconazole, a structural counterpart of diclofenac, was utilised as an internal standard.
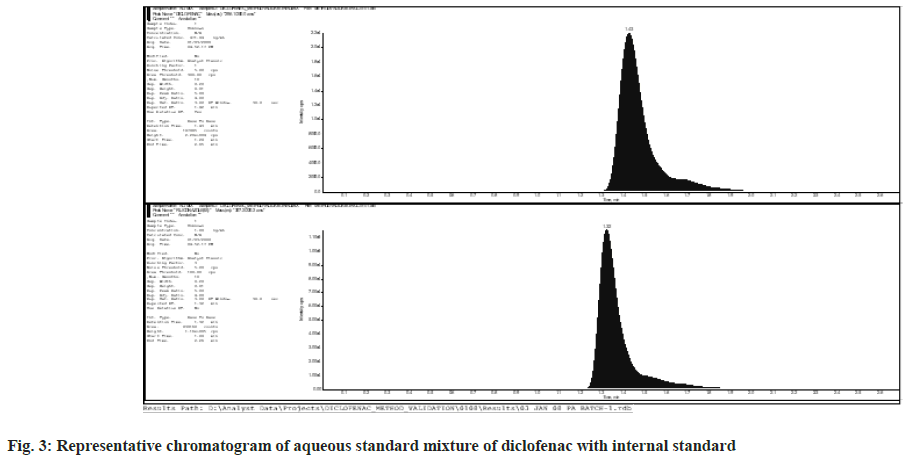
Six replicates of MQC dilution and working concentration of internal standard were used to test the system's repeatability. Every day, before beginning any method validation exercise, a system appropriateness test was done. Table 2 shows the coefficient of variation that was achieved. Fig. 3 shows a chromatogram of Diclofenac aqueous standard mixture with internal standard.
| S. No. | Diclofenac | Fluconazole | Area ratio | ||
|---|---|---|---|---|---|
| Drug area | RT | IS area | RT | Drug/IS | |
| 1 | 2899236 | 1.41 | 1735900 | 1.31 | 1.67 |
| 2 | 3145459 | 1.38 | 1876795 | 1.3 | 1.676 |
| 3 | 3048985 | 1.39 | 1945969 | 1.3 | 1.567 |
| 4 | 3014647 | 1.39 | 1919477 | 1.3 | 1.571 |
| 5 | 2914410 | 1.39 | 1904844 | 1.31 | 1.53 |
| 6 | 3183973 | 1.41 | 1979570 | 1.31 | 1.608 |
| Mean | 1.395 | 1.305 | 1.603 | ||
| SD | 0.012 | 0.005 | 0.059 | ||
| % CV | 0.877 | 0.419 | 3.687 | ||
Table 2: System Suitability
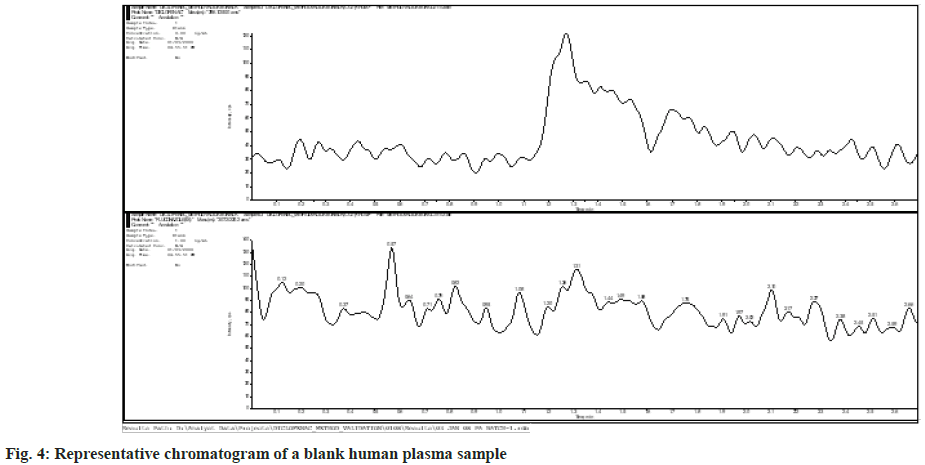
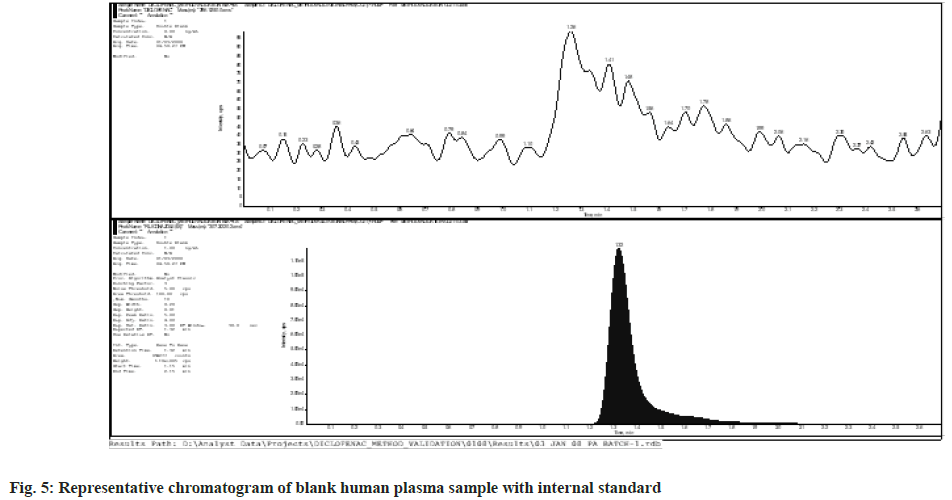
The plasma samples that did not show any interfering mass peak at the retention periods of Diclofenac and IS were chosen from six blank human plasma batches that were examined for selectivity. Fig. 4 and fig. 5 show representative chromatograms of blank human plasma sample and blank human plasma with internal standard, respectively.
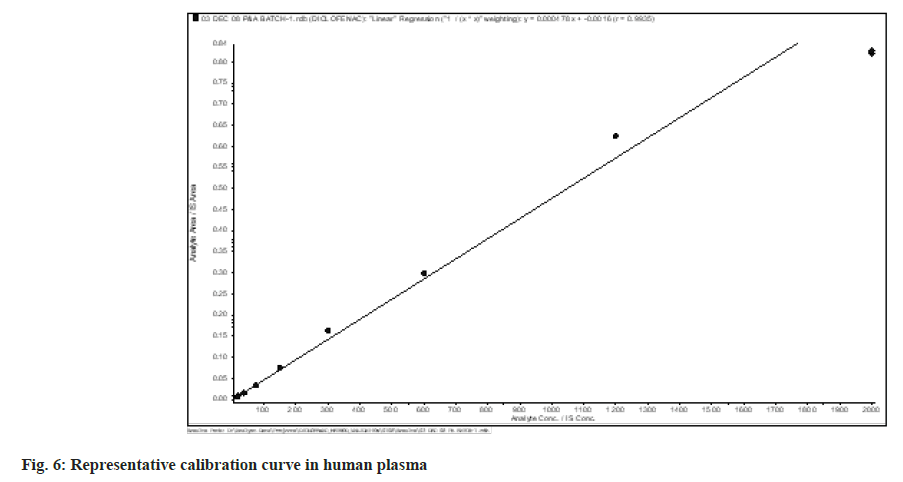
A weighted least square regression analysis of an eight-point standard curve was used to determine the method's linearity. From 18.75 ng/ml to 2000.25 ng/ml, the calibration lines were found to be linear (fig. 6). Least square regression analysis with weighting factors of 1/x2 was used to determine the best suited calibration lines of ratio of Diclofenac to IS peak area versus concentration of calibration standards. Throughout the validation process, the r2 was continuously more than 0.990.
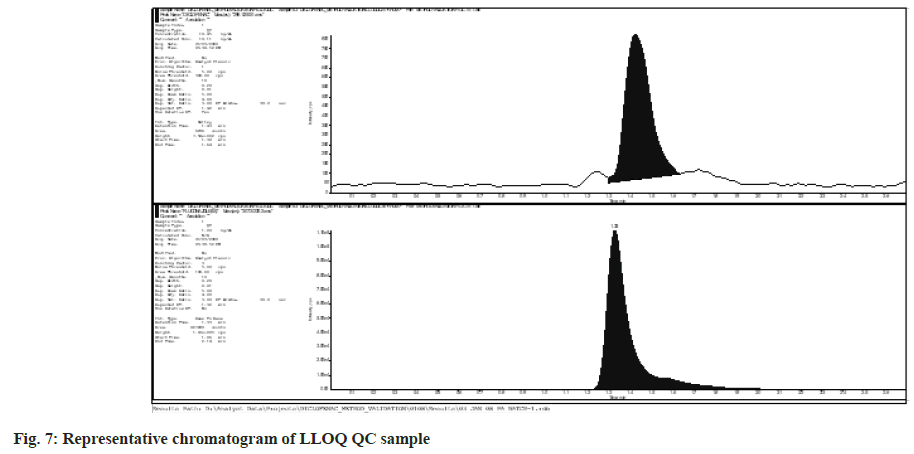
Diclofenac has a quantitation limit of 18.75 ng ml-1. Fig. 7 depicts representative LLOQ chromatograms. For Diclofenac at 18.75 ng ml-1, the difference between run precision and accuracy was 9.40 % and 95.22 % respectively .
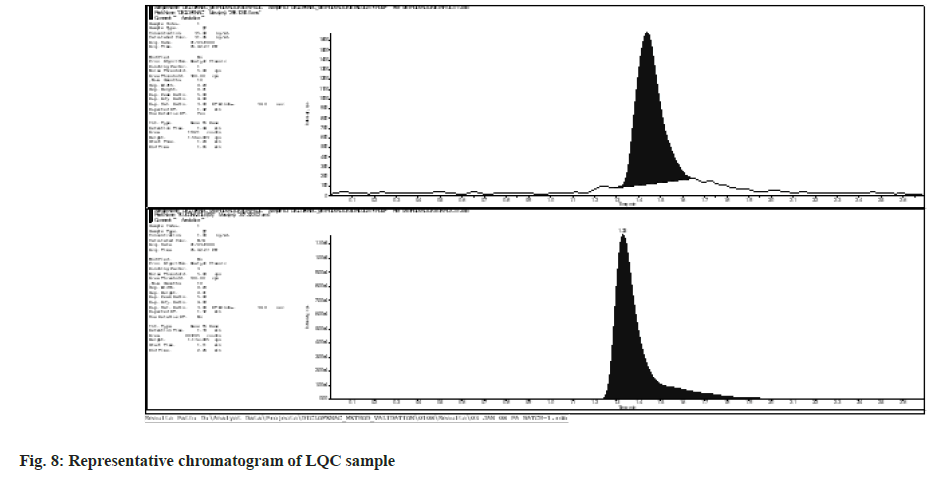
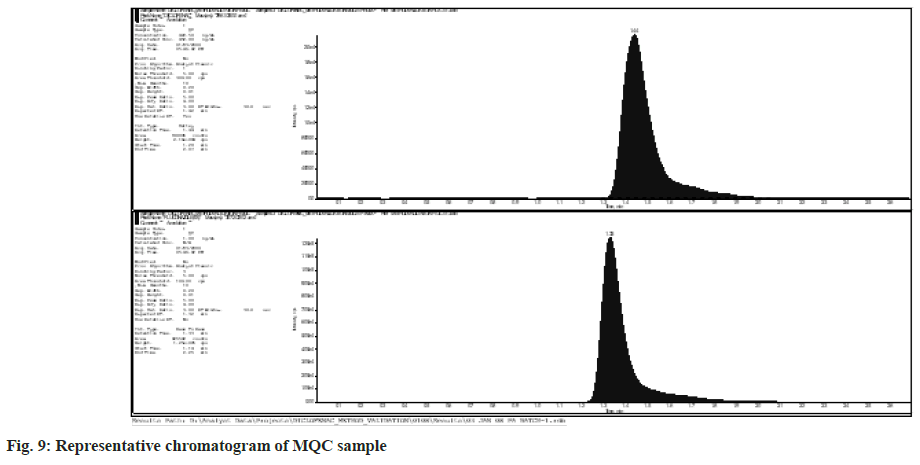
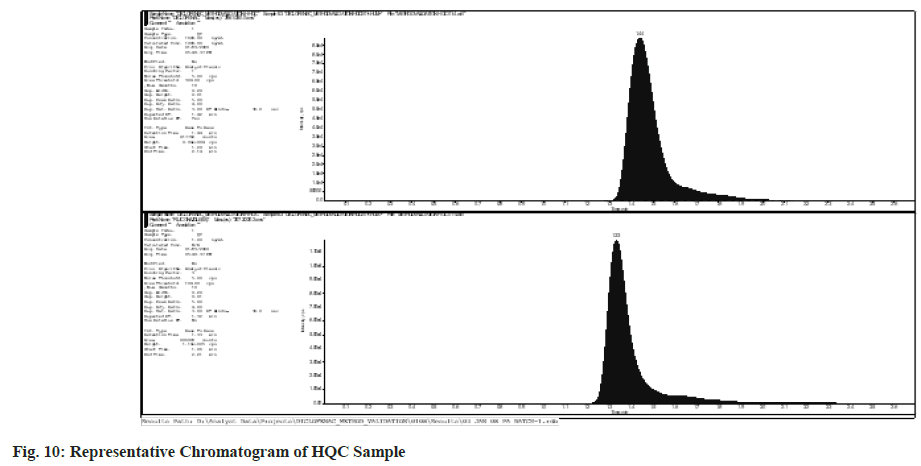
Within-batch precision ranged from 2.6 % to 9.95 %, and within-batch accuracy from 93.05 % to 113.46 %. The intra-day precision and accuracy ranged from 2.66 % to 9.95 % and 96.22 % to 113.46 %, respectively. Between-batch precision ranged from 5.93 % to 11.20 %, and betweenbatch accuracy from 99.23 % to 103.01 %. Within-batch precision and accuracy data, intraday precision and accuracy data, and inter-day precision and accuracy data are represented. Fig. 8-fig. 10 shows representative chromatograms of LQC, MQC, and HQC, respectively .
The mean stability of Diclofenac in human plasma ranged from 104.85 % to 111.76 % for one and 108.50 % to 110.73 % for three freeze-thaw cycles. Diclofenac was found to be stable (bench top stability) up to 5 h as per the acceptance criteria and the mean stability ranged from 99.61 % to 111.76 % for diclofenac. In-injector stability results demonstrate that Diclofenac and internal standard are stable for 24 h. The mean stability ranged from 98.03 % to 111.76 % for Diclofenac and 99.60 % to 113.91 % for the internal standard. The refrigerated stock solution stability on 9th d was 106.50 % for diclofenac and 98.10 % for IS.
Diclofenac's mean stability in human plasma ranged from 104.85 % to 111.76 % after one freeze-thaw cycle and from 108.50 % to 110.73 % after three. According to the acceptance criteria, diclofenac was determined to be stable (bench top stability) for up to 5 h, with mean stability ranging from 99.61 % to 111.76 %. The findings of the in-injector stability test show that Diclofenac and the internal standard are stable for 24 h. Diclofenac's mean stability ranged from 98.03 % to 111.76 %, whereas the internal standard's ranged from 99.60 % to 113.91 %. On the 9th d, diclofenac's refrigerated stock solution stability was 106.50 % and IS's was 98.10 %.
For diclofenac and internal standard, the Room Temperature Stock Solution stability at 6 h was 103.94 % and 96.11 %, respectively. Diclofenac was found to be stable in the long term after 9 d, with stability ranging from 96.83 % to 99.83 %. Freeze-thaw, bench top, in-injector (diclofenac), in-injector (IS), refrigerated, room temperature, and long term stability data. Results indicate the overall recovery of 61.98 %±6.40 for Diclofenac and 55.01 %±2.15 for internal standard. Results are tabulate in Table 3.
| QC ID | Absolute % Recovery of Diclofenac | Absolute % Recovery of Internal standard | Overall Recovery of Diclofenac | Overall Recovery of Internal standard | ||||
|---|---|---|---|---|---|---|---|---|
| LQC | M QC | HQC | LQC | M QC | HQC | |||
| Mean | 67 | 58.85 | 60.07 | 53.79 | 55.64 | 55.6 | 61.98 | 55.01 |
| S.D (±) | 1.88 | 0.86 | 1.58 | 0.57 | 0.91 | 0.98 | 3.97 | 1.18 |
| C.V. (%) | 2.8 | 1.47 | 2.63 | 1.05 | 1.64 | 1.77 | 6.4 | 2.15 |
| N | 5 | 5 | 5 | 5 | 5 | 5 | 15 | 15 |
Table 3: Recovery of Diclofenac and Internal Standard from Human Plasma
Spiking poor and high QC samples in duplicate from each of the six different batches of human plasma was used to determine the matrix effect. Within-batch precision and accuracy ranged from 1.09 % to 3.50 % and 91.00 % to 101.53 %, respectively, with no matrix impact. Data is tabulated in Table 4.
| QC ID | LQC | HQC |
|---|---|---|
| Nominal concentration (ng ml-1) | ||
| 35.49 | 1689.99 | |
| Mean | 36.03 | 1537.86 |
| S.D (±) | 1.26 | 16.8 |
| C.V. (%) | 3.5 | 1.09 |
| Nominal (%) | 101.53 | 91 |
| N | 12 | 12 |
Table 4: Matrix Effect Data
For two and five times, the results show adequate dilution integrity. Within-batch precision and accuracy for two times dilution for MQC and HQC, respectively, ranged from 1.75 % to 2.87 % and 90.42 % to 95.58 %. Within batch precision and accuracy for five times dilution for MQC and HQC, respectively, ranged from 1.78 % to 2.94 % and 92.95 % to 94.46 %. Dilution integrity data of Diclofenac is given in Table 5. After the first and second injections of blank samples, there was no carryover effect for Diclofenac or the internal standard. Table 6 summarises the findings.
| QC-ID | Two Times | Five Times | ||
|---|---|---|---|---|
| MQC | HQC | MQC | HQC | |
| Nominal Concentration (ng ml-1) | Nominal Concentration (ng ml-1) | |||
| 422.5 | 1689.99 | 422.5 | 1689.99 | |
| Mean | 382.02 | 1615.32 | 399.08 | 1570.9 |
| S.D (±) | 10.96 | 28.27 | 7.12 | 46.13 |
| C.V. (%) | 2.87 | 1.75 | 1.78 | 2.94 |
| % Nominal | 90.42 | 95.58 | 94.46 | 92.95 |
| N | 5 | 5 | 5 | 5 |
Table 5: Dilution Integrity Data of Diclofenac
| Sample ID | Area | Mean | Blank 1 (Area) | % Carry over | Blank 2 (Area) | % Carry over |
|---|---|---|---|---|---|---|
| Diclofenac-STD H | 650991 | 652602 | 0 | 0 | 0 | 0 |
| 654213 | ||||||
| Diclofenac-STD A | 6771 | 6968.5 | ||||
| 7166 | ||||||
| Internal standard (Average area of IS in Calibration curve) | 531833.9 | 0 | 0 | 0 | 0 |
Table 6: Carryover Effect Data of Diclofenac
For the determination of Diclofenac from human plasma using LC-MS/MS with multiple reaction monitoring, the approach presented is very sensitive and selective. For the quantification of Diclofenac in human plasma samples acquired for pharmacokinetic and toxicokinetic research, this approach provides acceptable precision and sensitivity. According to FDA criteria, the approach provided is simple, quick, sensitive, specific, and thoroughly validated.
It is an appealing approach for high throughput bioanalysis of Diclofenac because of its cost effectiveness, simplicity, speed of extraction procedure, and sample turnover rate of 2.0 min per sample. The added benefit of a simple and economical protein precipitation extraction technique that does not require drying or reconstitution, as well as a shorter analytical run time, provides high throughput and makes it suited for routine volunteer sample analysis. The validated method can detect Diclofenac in concentrations ranging from 18.75 ng ml-1 to 2000.25 ng ml-1. The results indicate the method to be sensitive, selective, accurate and reproducible.
Author Contributions:
Parul Grover and Monika Bhardwaj contributed equally to this work.
Acknowledgments:
We are highly grateful to the Director Dr. (Col.) A. Garg and Joint Director, Dr. Manoj Goel, KIET Group of Institutions and Dr. K. Nagarajan, Principal, KIET School of Pharmacy, Ghaziabad for their motivation, all-round support and arranging research facilities. We are also very much thankful to MSN Laboratory, Hyderabad for proving us pure drug as a gift sample to carry out the research.
Conflict of interests:
The authors declare that there are no conflicts of interest.
References
- Davies NM, Anderson KE. Clinical pharmacokinetics of diclofenac: Therapeutic insights and pitfalls. Clin Pharmacokinet 1997;33(3):184-213.
[Crossref] [Google Scholar] [PubMed]
- Blagbrough IS, Daykin MM, Doherty M, Pattrick M, Shaw PN. High-performance liquid chromatographic determination of naproxen, ibuprofen and diclofenac in plasma and synovial fluid in man. J Chromatogr 1992;578(2):251-7.
[Crossref] [Google Scholar] [PubMed]
- Miller RB. High-performance liquid chromatographic determination of diclofenac in human plasma using automated column switching. J Chromatogr 1993;616(2):283-90.
[Crossref] [Google Scholar] [PubMed]
- Davies NM, Saleh JY, Skjodt NM. Detection and prevention of NSAID-induced enteropathy. J Pharm Pharm Sci 2000;3(1):137-55.
[Google Scholar] [PubMed]
- Fortun PJ, Hawkey CJ. Nonsteroidal antiinflammatory drugs and the small intestine. Curr Opin Gastroenterol 2005;21(2):169-78.
[Crossref] [Google Scholar] [PubMed]
- El-Bagary RI, Azzazy HM, ElKady EF, Farouk F. UPLC-MS/MS determination of aceclofenac and diclofenac in bulk, dosage forms and in at-line monitoring of aceclofenac synthesis. Br J Pharm Res 2014;4(11):1311-31.
- Emara LH, Taha NF, El-Ashmawy AA, Raslan HM, Mursi NM. A rapid and sensitive bioanalytical hplc method for determining diclofenac sodium in human plasma for bioequivalence studies. J Liquid Chromatogr Related Technol 2012;35(15):2203-16.
- Nasir F, Iqbal Z, Khan A, Ahmad L, Shah Y, Khan AZ, et al. Simultaneous determination of timolol maleate, rosuvastatin calcium and diclofenac sodium in pharmaceuticals and physiological fluids using HPLC-UV. J Chromatogr 2011;879(30):3434-43.
[Crossref] [Google Scholar] [PubMed]
- Yilmaz B, Asci A, Palabiyik SS. HPLC method for determination of diclofenac in human plasma and its application to a pharmacokinetic study in Turkey. J Chromatogr Sci 2011;49(6):422-7.
[Crossref] [Google Scholar] [PubMed]
- Dahivelkar PP, Bhoir SI, Bari SB, Surana SJ, Bhagwat AM. Simultaneous determination of diclofenac potassium and drotaverine hydrochloride in human plasma using reversed-phase high-performance liquid chromatography. J Chromatogr Sci 2012;50(8):694-701.
[Crossref] [Google Scholar] [PubMed]
- Mehta L, Naved T, Grover P, Bhardwaj M, Mukherjee D. Development and validation of novel and highly sensitive stability-indicating reverse phase ultra performance liquid chromatography method for quantification of ibrutinib and its ten degradation products. Indian J Pharm Sci 2020;82(6):958-66.
- Mehta L, Naved T, Grover P, Bhardwaj M, Mukherjee D. LC and LC–MS/MS studies for identification and characterization of new degradation products of ibrutinib and elucidation of their degradation pathway. J Pharm Biomed Anal 2021;194:113768.
[Crossref] [Google Scholar] [PubMed]
- Mehta L, Naved T, Grover P, Bhardwaj M, Mukherjee D, Vennapu DR. Identification and characterization of new degradation products of belinostat using UHPLC-Q-TOF-MS/MS and in silico toxicity prediction. J Liquid Chromatogr Related Technol 2021;44(5-6):285-97.
- Mehta L, Grover P, Naved T, Mukherjee D. Metabolite detection and profiling using analytical methods. Curr Pharm Anal 2021;17(1):2-9.
- Grover P, Bhardwaj M, Mehta L. LC-MS/MS studies for identification and characterization of new forced degradation products of dabrafenib and establishment of their degradation pathway. J Pharm Biomed Anal 20210;206:114351.
[Crossref] [Google Scholar] [PubMed]
- Grover P, Mehta L, Naved T, Kumar S, Monga G. Identification and characterization of in vitro metabolites of belinostat by rat liver microsomes using ultra performance liquid chromatography coupled with tandem mass spectrometry. Indian J Pharm Educ Res 2022;56:S58-60.
- European Medicines Agency (EMA). Guideline on bioanalytical method validation. Committee for Medicinal Products for Human Use. 2012.
- US Department of Health and Human Services. Guidance for industry, bioanalytical method validation. FDA 2018.
- Briscoe CJ, Stiles MR, Hage DS. System suitability in bioanalytical LC/MS/MS. J Pharm Biomed Anal 2007;44(2):484-91.
[Crossref] [Google Scholar] [PubMed]
- Loh GO, Wong EY, Tan YT, Lee YL, Pang LH, Chin MC, et al. Simple and rapid LC-MS/MS method for determination of sitagliptin in human plasma and application to bioequivalence study. J Chromatogr 2020;1159:122337.
[Crossref] [Google Scholar] [PubMed]
- Loh GO, Wong EY, Tan YT, Wee HC, Ng RS, Lee CY, et al. Simple and rapid LC–MS/MS method for simultaneous determination of flavoxate and 3-methyl-flavone-8-carboxylic acid in human plasma: Application to a bioequivalence study. J Pharm Biomed Anal 2021;194:113758.
[Crossref] [Google Scholar] [PubMed]
- Sharma KS, Sahoo J. Development and validation by statistical treatment of stability indicating RP-HPLC method for quantification of Orlistat in Orlistat-loaded solid dispersion. Fut J Pharm Sci 2021;7(1):1-3.
- Sharma KS. Formulation development and validation of a method for direct, underivatized analysis of orlistat in orlistat-loaded solid dispersion in simulated conditions. Asian J Pharm 2022;16(2):139-147.
