- *Corresponding Author:
- Archana Karnik
Department of Pharmaceutical Chemistry,
SCES’s Indira College of Pharmacy,
Pune 411033,
India
E-mail: archanacontact@yahoo.co.in
| Date of Received | 01 April 2021 |
| Date of Revision | 07 August 2021 |
| Date of Acceptance | 04 March 2022 |
| Indian J Pharm Sci 2022;84(2):268-280 |
This is an open access article distributed under the terms of the Creative
Commons Attribution-NonCommercial-ShareAlike 3.0 License, which
allows others to remix, tweak, and build upon the work non-commercially,
as long as the author is credited and the new creations are licensed under
the identical terms
Abstract
A reverse phase high performance liquid chromatography method was developed to estimate Miconazole nitrate and Clobetasol propionate simultaneously from a cream formulation. The developed method was validated as per International Council for Harmonisation guidelines. The proposed method was effectively applied for the characterization of degradation products formed under hydrolytic stressed conditions. The major degradants formed by hydrolysis of both the analytes were separated, identified and characterized. Both drugs were found susceptible to acid and base hydrolytic conditions while were stable under neutral hydrolysis. The liquid chromatography with tandem mass spectrometry studies were further carried out on stressed samples that provided the accurate masses of drug and their degradation products. The mass spectral data and fragmentation patterns were further explored to characterize the degradants and assign structures to them. Total nine degradants were characterized and the degradation pathways for both the drugs were proposed.
Keywords
Miconazole nitrate, clobetasol propionate, degradation products, high performance liquid chromatography, liquid chromatography with tandem mass spectrometry, validation
The antifungal agent, Miconazole nitrate (MIC) is used to treat topical fungal infection because of its effective action against dermatophytes and Candida Alibicans. Clobetasol propionate (CLO), a super potent class I corticosteroid with anti-inflammatory, vaso-constrictive and anti-pruritic activity is a drug of choice to treat skin disorders like dermatoses, psoriasis and seborrhoea. The combination of CLO and MIC is used in various skin diseases like inflammatory skin conditions, itching, yeast infection of vagina and vulva and other conditions due to their synergistic effect [1].
An extensive literature indicates, High Performance Liquid Chromatography (HPLC) is widely used for estimation of MIC and CLO either alone [2-6] or in combination with another drugs [7-11] from formulation or biological fluid [12]. CLO is estimated using certain Ultra-violet (UV) spectrometry methods [13,14]. Few chromatographic methods based research articles on stability studies for the estimation of MIC alone [15,16] and in combination of MIC or CLO with another drug [17-20] have been reported. There also exist reports on simultaneous estimation of titled analytes in bulk sample and formulation by HPLC [21,22], High PerformanceThin Layer Chromatography (HPTLC) [23] and UV spectrophotometry [24]. Thus, numerous methods have been published in the literature to estimate MIC and CLO in bulk, drug product as well as in bio samples. But, so far, there exists no report on the development and validation of suitable chromatographic method along with systematic identification of hydrolytic Degradation Products (DPs) of MIC and CLO produced under various pH conditions, as per International Council for Harmonisation (ICH) Q1A (R2) guidelines [25] which recommend these investigations to be carried on drug molecules. Hence, there was a need to develop HPLC method which is suitable for mass spectrometric studies for further characterization of major DPs.
Materials and Methods
Reagents and chemicals:
Pure MIC and CLO were provided as gratis samples by Leben laboratories Pvt. Ltd., Akola. HPLC grade solvents namely methanol, ammonium acetate and acetonitrile were procured from E. Merck (India) Ltd, Mumbai. Double distilled water, filtered through 0.2 μm filter was used throughout the experiment. HCl and NaOH (Analytical Reagent (AR) grade) were acquired from Research Lab Fine Chem. Ind., Mumbai. Tenovate-M cream (Glaxo SmithKline Pharmaceuticals Ltd.) containing MIC 2.0 %, CLO 0.05 % and chlorocresol 0.1 % (preservative) was obtained from the market and used for analysis.
Instruments:
Waters HPLC system consisting of autosampler (717 plus), column oven, a binary pump (515) and PDA detector were used for method development and validation. Data was integrated using Empower version 2 software. The peak purity was assessed by PDA detector. Quadrupole-Time Of Flight-Mass Spectrometry (Q-TOF-MS) experiment was performed on Agilent 6540 QTOF and Agilent Binary LC 1260 to acquire fragmentation pattern of drugs and their DPs. Masshunter workstation software VB.05.01 was used for data processing and acquisition. Other instruments used during method development were Varian Cary-100 UV spectrophotometer, Shimadzu balance (AUW220D), pH Meter (Equip-Tronics-EQ-621), ultrasonicator (5.5L-150H), hot air oven and micropipette.
Optimization of chromatographic conditions:
The standard stock solutions of both the analytes were scanned from 200-400 nm and the overlain spectra was gained to select the appropriate analytical wavelength. The present method was intended to resolve degradants generated through hydrolytic forced degradation from MIC and CLO using mobile phase that would be suitable for further identification of degradants by LC- MS/MS.
Consequently, the mobile phase composition, its pH and flow rate were worked out along with suitable organic modifiers. Further, the column temperature was optimised. Numerous mobile phase modifications were tried to get optimally resolved analytes and DPs peaks. The separation was achieved using Cosmocil C18 column (4.6 mm×150 mm, 5.0 µ) with a mobile phase comprising of ammonium acetate buffer (10 mm, pH 4.2 adjusted with acetic acid) and acetonitrile (43:57 v/v). The flow rate was 0.75 ml/min. while the column temperature was maintained at 40°. The detection wavelength 240 nm was selected.
This research work was further extended to characterize the DPs and to predict the degradation pathway. The optimization of Electrospray Ionization (ESI) source conditions was also performed to achieve optimum intensity signal and greater sensitivity to depict the DPs. The various ESI source parameters were improved like its temperature, drying gas flow, nebulizing gas flow and collision ionization dissociation voltage. The ionization of both drugs and their DPs was carried out on positive mode due to the presence of basic amino group and electronegative chloride to form positive ions rapidly.
The fragmentation pattern of both the drugs as well as their DPs was established using LC-Q-TOF-MS by positive electrospray ionization. The structures were assigned based on MS/MS data.
Standard stock solution:
Precisely about 100 mg of each of MIC and CLO was weighed and 100 ml standard stock solutions were prepared in methanol separately containing 1000 µg/ml of each analyte (Solution A). Further, dilution of 5 ml of solution A of each analyte up to 100 ml resulted in 50 µg/ml of standard stock solution (Solution B). Further series standard solutions in the concentration range of 100-600 µg/ml and 5-30 µg/ml of MIC and CLO respectively were prepared by transferring aliquots of standard stock solution A and B respectively and diluting to volume with methanol.
Formulation assay and System Suitability Test (SST):
An aliquot of 2 g of cream containing 40 mg MIC (1 mg CLO) was sonicated for 30 min at 40° with 50 ml methanol in a volumetric flask (100 ml) until all cream components were melted. The resultant solution was diluted up to 100 ml, stirred vigorously for 10 min at 100 rpm with magnetic stirrer and was kept in refrigerator until the matrix component were solidified. The subsequent mixture was filtered through Whatmann filter paper no. 42 to give final solution of 400 μg/ml of MIC and 10 μg/ml of CLO concentration. The resulting solution was passed through syringe filter (0.45 μm Pall Life Sciences) and introduced into HPLC system. The chromatogram was noted and concentration of drugs in the cream was calculated by means of a standard curve. The estimation of formulation containing 400 μg/ml of MIC and 10 μg/ml of CLO under the optimized chromatographic conditions was executed six times. Five replicate analysis of standard solution under the optimized chromatographic conditions was considered to establish system suitability of the proposed method. The parameters measured were number of theoretical plates, area under curve, retention time, retention factor and resolution and peak purity.
Method validation:
Specificity: Specificity is the capability of the method to quantify the analyte response in presence of additional analytes and DPs. Peak purity profile was used to prove the chromatographic peak is formed by only single component. Empower software displays peak purity by comparison of peak spectra at the start at maxima and at the end of sample and standard peak.
Hydrolytic degradation of the analytes was executed to degrade drug substances preferably up to 10 %-20 %. For acid/base/neutral stress, solutions comprising of 1000 µg/ml of each drug were made in 1N HCl/1N NaOH/distilled water respectively. The hydrolysis was carried out in dark, to exclude interference by light. Further the 1000 μg/ml of analyte solutions were subjected to hydrolysis at two different temperature conditions; i.e. at room temperature for 4 h and at 80° for 1 h reflux. The solutions were neutralised suitably. Each sample hydrolysis was repeated thrice along with blank solutions. The nomi [unt of 400 μg/ml of MIC and 20 μg/ml of CLO in degradation sample was achieved by suitable dilution with mobile phase. An aliquot of 10 μl of this sample was analysed using proposed method. To find out the origin of DPs, the individual degraded analyte after hydrolysis was introduced into the column. The stress degradation studies were then performed in combination.
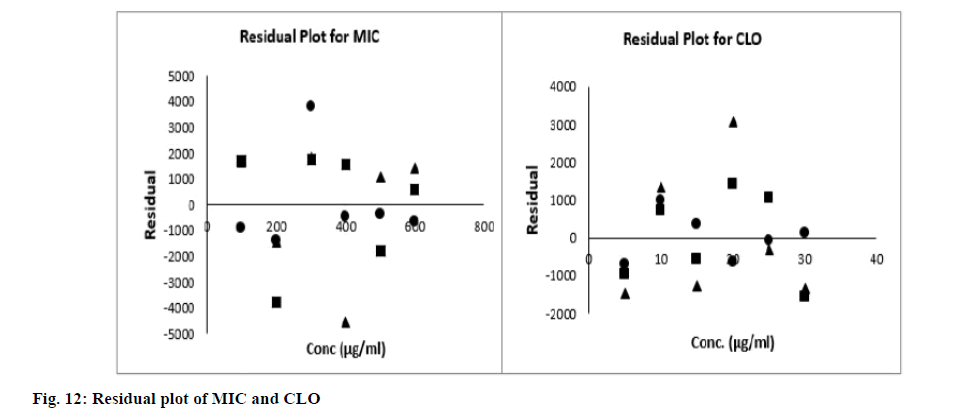
Linearity and range: A series of standard solutions in the concentration range of 100-600 µg/ml and 5-30 µg/ ml of MIC and CLO respectively were prepared. The analytes were resolved and the standard curve of peak area vs. concentration was obtained. The linearity was assessed by linear regression, the slope and intercept were considered. The F test was executed where experimental and tabulated Fisher variance ratios were compared. The pattern of the residual plot was also evaluated to further validate the linearity.
Method sensitivity:
The subsequent equations were used to assess LOD and LOQ of the proposed method.
LOD=3.3×σ/S
LOQ=10×σ/S
Where, σ is the standard deviation of the response
S is the slope of the calibration curve.
Accuracy (Recovery studies):
The accuracy of the method was demonstrated by the standard addition method at the concentration level of 80 %, 100 % and 120 %. For this, the amount of 160 mg, 200 mg and 240 mg of standard MIC and 4 mg, [5 mg and 6 mg of standard CLO was spiked to cream blend containing 200 mg and 5 mg of MIC and CLO respectively. The extraction was executed and assay was performed. The mean percentage recovery and percentage Relative Standard Deviation (%RSD) were calculated.
Precision:
The repeatability and intermediate precision studies were carried out by analysing sample solutions containing 400 μg/ml of MIC and 10 μg/ml of CLO. Repeatability studies done on sample by carrying out assay six times. For intermediate precision studies, the analysis was executed thrice within a day and on consecutive days by various analysts. The mean recovery and % RSD obtained was considered to demonstrate precision.
Robustness and solution stability studies:
The deliberate varied chromatographic conditions include small changes in wavelength of detection, [ flow rate, column temperature and column make; to demonstrate robustness. Sample solution with 400 μg/ ml of MIC and 10 μg/ml of CLO was stored in tightly closed amber colour volumetric flask till 8 h. The effect on percentage average assay and % RSD was observed.
Results and Discussion
From the overlain spectra, 240 nm was selected as wavelength of detection. This is λmax of CLO at which MIC showed optimum absorbance. This leads to better sensitivity for CLO which is present in minute quantity in the combined formulation. To begin with, methanol and water in several proportions were tried as mobile phase. The considerable increase in column back pressure and baseline drift were observed. The appearance of multiple peaks for analytes might be due to the poor buffering capacity of water. Also, tR was observed to increase as the water proportion in mobile phase was enhanced. This may be owing to nonpolar steroidal ring present in the CLO which intensified its affinity for the nonpolar stationary phase. The mixture of methanol and water in different pH also resulted in poor peak shape and prolonged retention time therefore methanol was replaced with acetonitrile. The composition of ammonium acetate and acetonitrile provided sharp peaks; hence it was decided to optimize this composition for further experimentations. Acetonitrile and 10 mm ammonium acetate were tried on HPLC system in several proportions along with acetic acid at different column temperature. Finally, the resolution between drug and degradation products and between degradants was achieved using the ammonium acetate buffer (10 mm, pH 4.2 adjusted with acetic acid) and acetonitrile in the 43:57 v/v proportion. It also showed sharp peaks at the retention time of 5.59 min and 9.44 min for MIC and CLO respectively.
The LC-MS analysis was performed using ESI in positive mode. Nitrogen was the sheath/nebulising gas with a flow rate of 8 l/min. The source temperature was 350° with capillary voltage of 3500 V. Mass range selected was 40-600 amu. Masshunter workstation software VB.05.01 was used for data processing and acquisition. Collision Induced Dissociation (CID) was carried out to generate daughter ions and the fragmentations were observed to deduce DPs.
The output of the MS was confirmed by injecting standard solution of MIC and CLO. The exact mass of MIC; as a nitrate salt is 476.98 while [M+H]+ value observed in positive ionization mode was 414.99 as the nitrate group was knocked out during ionization. The observed [M]+ value for CLO; 467.19 was matched with exact mass of clobetasol propionate (467.19). The MS/MS fragmentation pattern of miconazole showed major fragments at m/z values of 158.97 and 69.04, while major fragments produced by CLO were with m/z of 279.10, 263.14, 147.07.
Table 1 represents the average results of SST parameters and assay values. Resolution as well as other SST parameters was found acceptable. Assay value was 99.86 % w/w with % RSD 0.87 for MIC while it was 100.36 % w/w with 1.21 % RSD for CLO.
| Parameter↓ / Analytes → | MIC | CLO |
|---|---|---|
| System Suitability Test (n=5) | ||
| Peak Area (±SD) | 450330 (4040) | 87240 (813) |
| No. of theoretical plates (±SD) | 2969 (89.45) | 3395 (72.23) |
| Tailing Factor (±SD) | 1.31 (0.077) | 1.24 (0.075) |
| Retention time (tR) (±SD) | 5.49 (0.068) | 9.48 (0.081) |
| Resolution(R) (±SD) | -- | 6.39 (0.21) |
| Capacity Factor (k) (±SD) | 5.68 (0.611) | 10.42 (0.116) |
| Typical Peak Purity data | ||
| Peak Angle | 0.134 | 0.169 |
| Peak threshold | 0.171 | 0.205 |
| Formulation Assay (n=6) | ||
| Assay (% w/w) | 99.86 | 100.36 |
| % RSD | 0.87 | 1.21 |
Note: SD is average of three independent procedures
Table 1: SST Parameter and Formulation Assay Data
| Analyte→ Stress condition ↓ |
MIC | CLO | ||||
|---|---|---|---|---|---|---|
| tR of Degraded Product | % Assay | Peak angle, Threshold | tR of Degraded Product | % Assay | Peak angle, Threshold | |
| Acid (1 N HCL, 1 h, 80°) | 1.51 | 87.10 | 0.183, 0.221 | 8.01 | 87.22 | 0.138, 0.185 |
| 2.22 | 0.154,0.189 | 10.25 | 0.241,0.289 | |||
| Base (1 N NaOH, 1 h, 80°) | 1.49 | 83.97 | 0.161, 0.184 | 7.49 | 77.03 | 0.221, 0.245 |
| 2.18 | 0.207,0.248 | 7.98 | 0.175,0.216 | |||
| 8.70 | 0.193,0.252 | |||||
Table 2: Summary of Hydrolytic Degradation Study of MIC and CLO
Characterization of forced DPs:
The chromatograms acquired under hydrolytic stress conditions showed well resolved peaks. The DPs of MIC and CLO were separately monitored under positive ionization mode LC–MS and were further fragmented and identified by CID in Q–TOF–MS.
Acid assisted degradation studies:
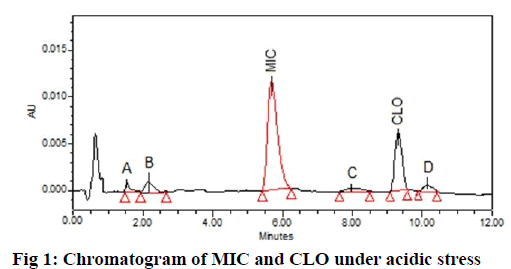
The comparative assessment of acid degraded chromatogram with pure samples revealed the presence of additional peaks in the degraded samples. MIC showed two degradation peaks with tR 1.51 and tR
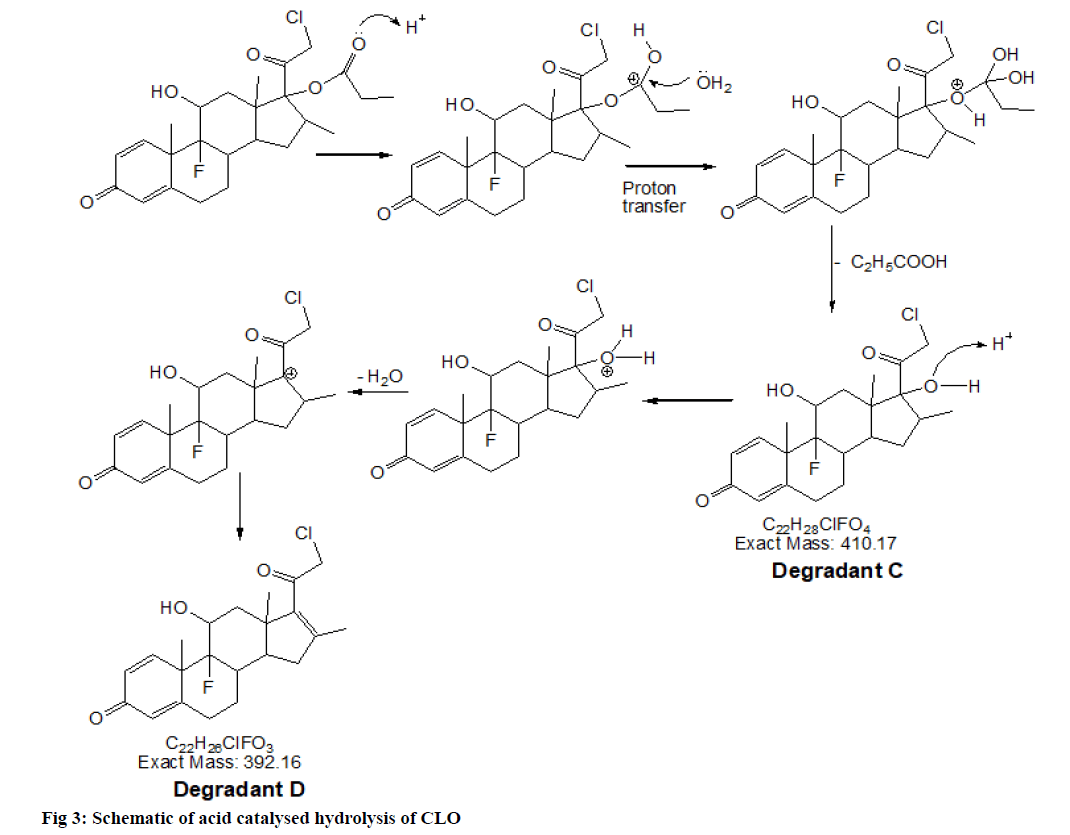
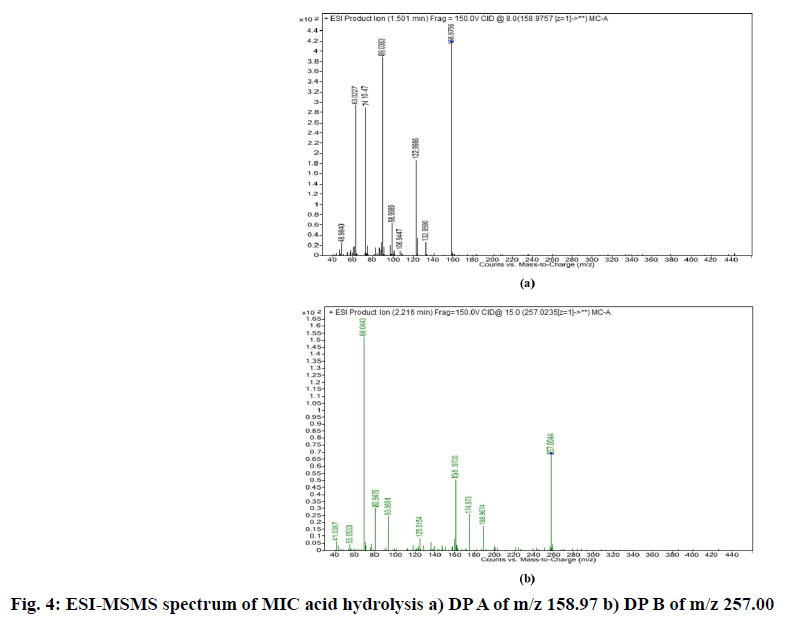
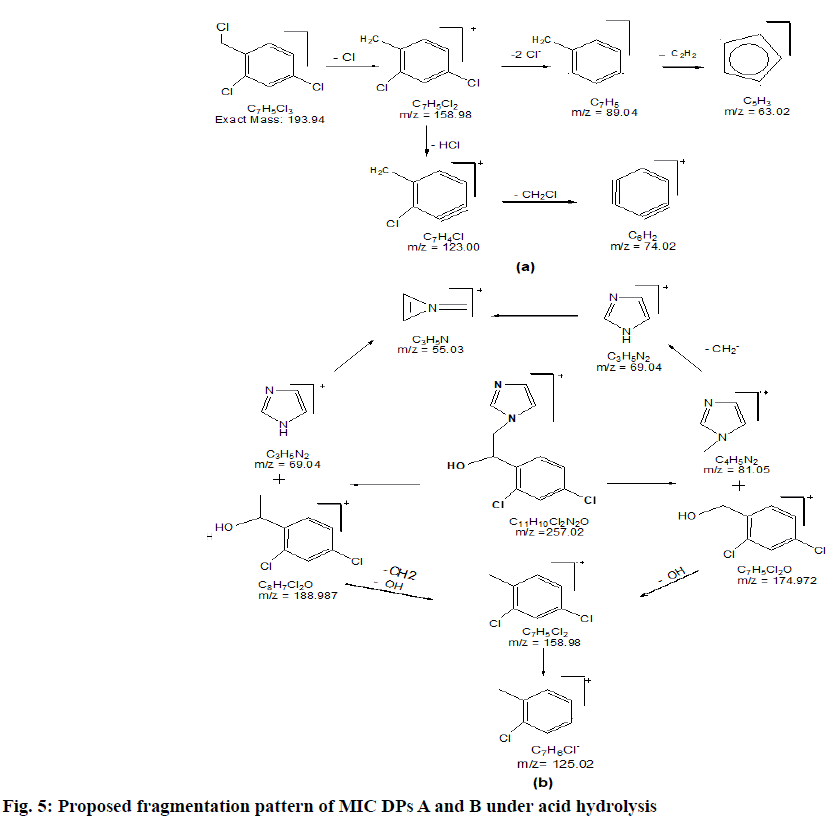
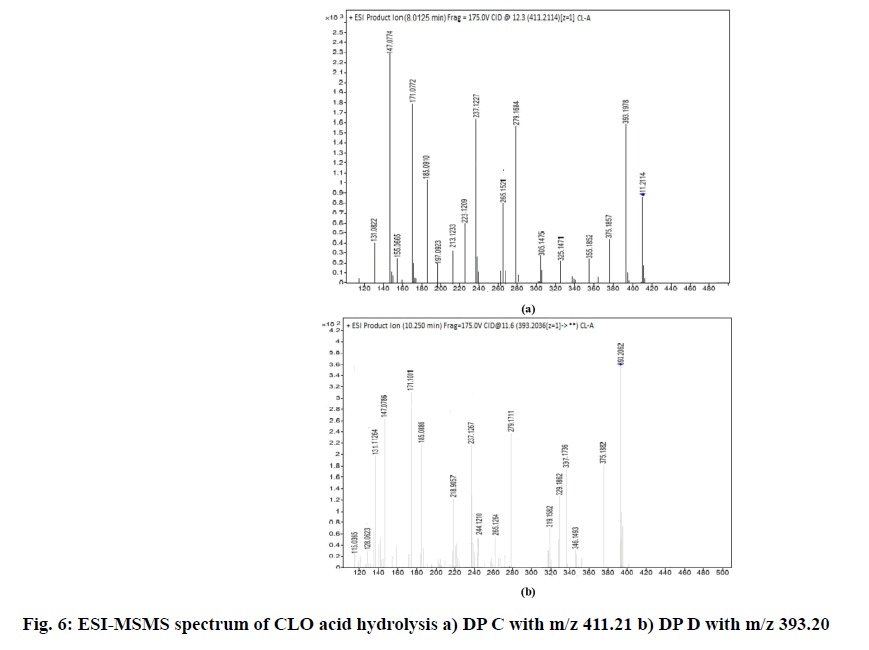
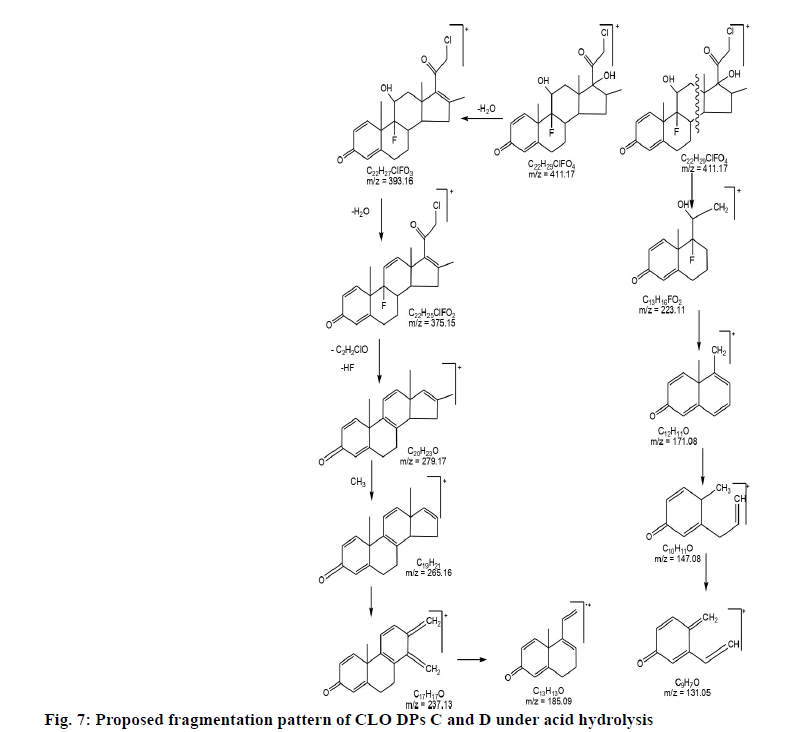
2.22 depicted as A and B respectively while, CLO showed additional peaks of DPs at tR 8.01 and tR 10.25 represented as C and D respectively in fig. 1. The probable reaction mechanism is suggested in fig. 2 and fig. 3 for MIC and CLO respectively. All four DPs were found and identified by Q-TOF-MS. The degradant A with mass 193.97 was obtained as [M+H]+ molecular ion with m/z 158.97 in MS studies as the -Cl group was knocked out during ionization and hence [M-Cl] + (m/ z=158.97) molecular ion peak was produced (fig. 4a). Protonated molecular ion of DP B was found at m/z value of 257.02 (fig. 4b). The fragmentation patterns of the MIC DPs were established for their characterisation (fig. 5). CLO was found to produce two DPs with m/z value; 411.21 (C) and 393.20 (D). The Q-TOF-MS spectra is represented in fig. 6. The loss of mass 18 is owing to the removal of water to produce degradant with m/z 393.20 (D). The fragmentation pattern of CLO DPs C and D is depicted in fig. 7. Thus, LC- MS/MS was used to characterize DPs from MIC and CLO acid hydrolysis and the most likely degradation and fragmentation pathways for analytes and their DPs were proposed.
Base assisted degradation studies:
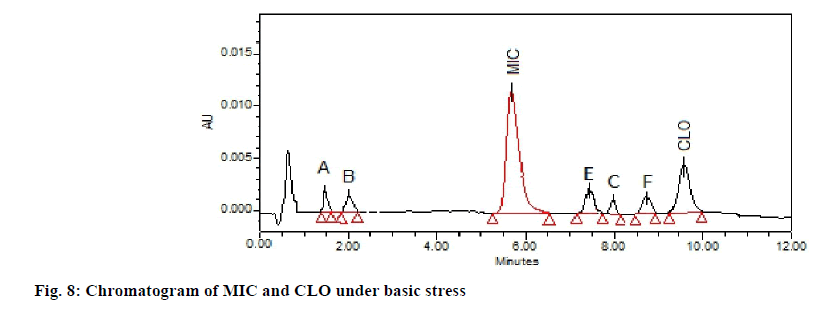
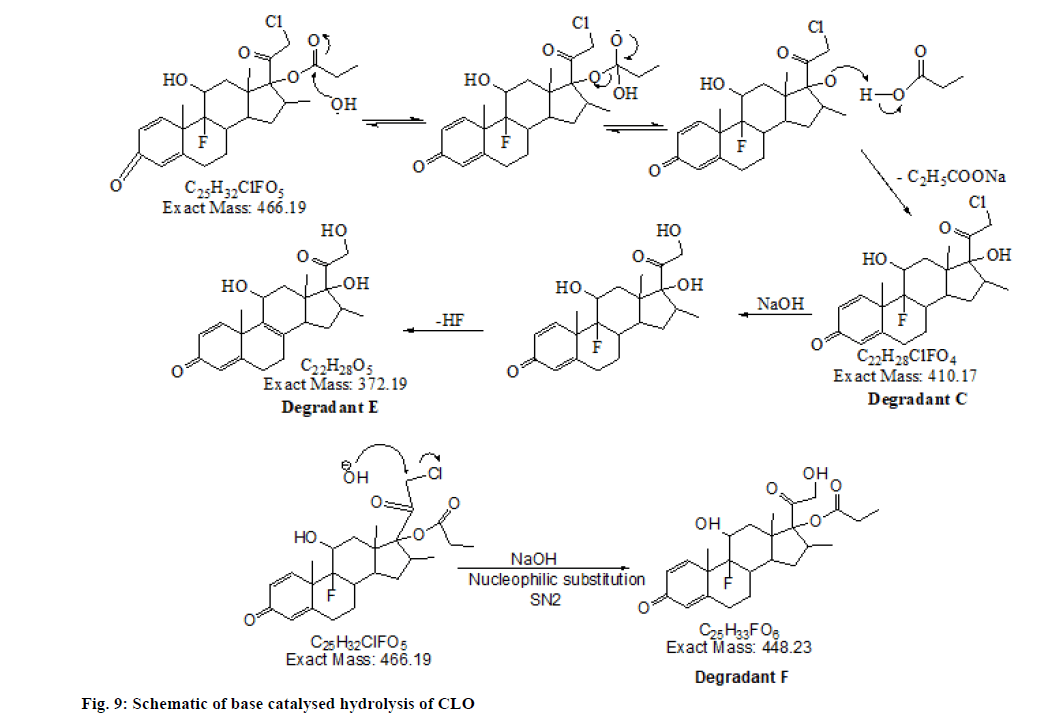
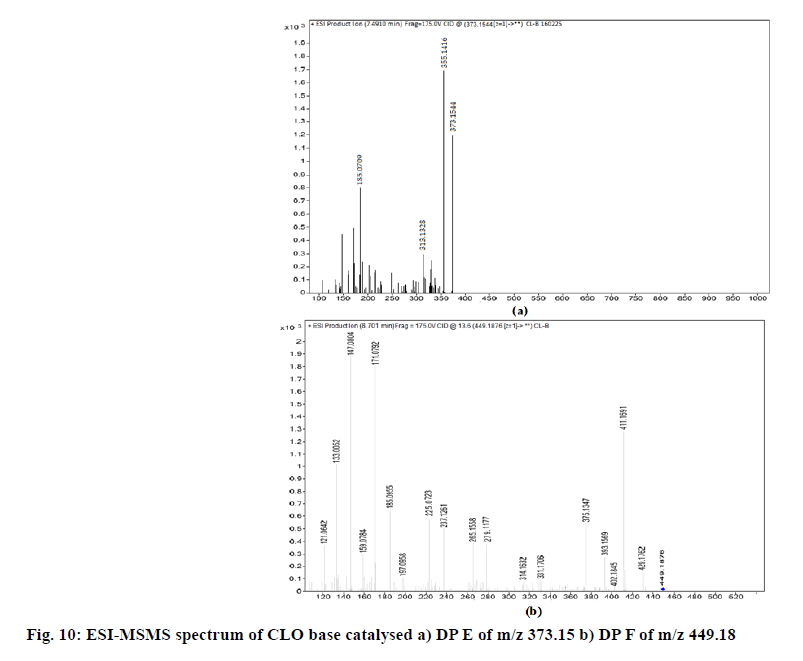
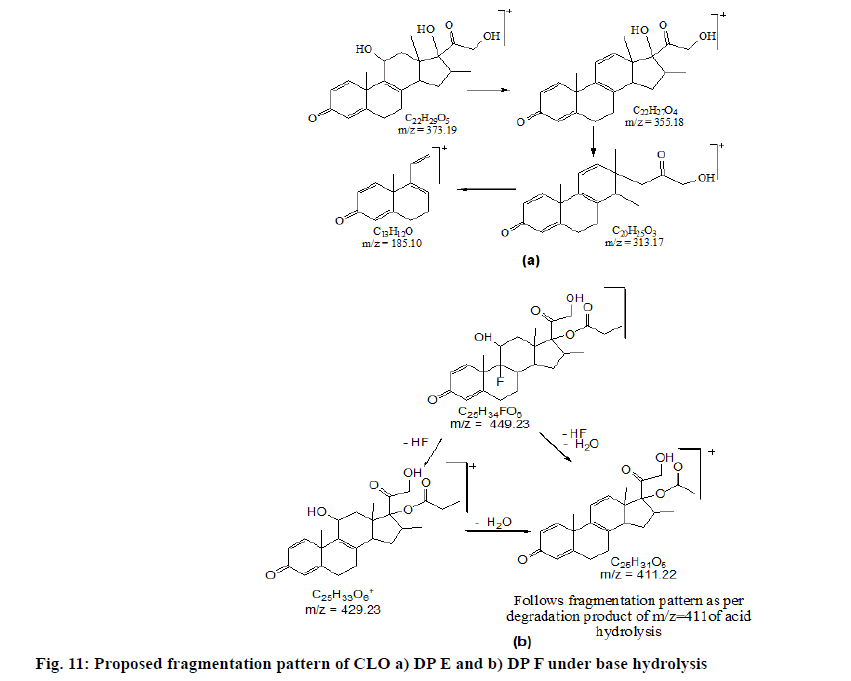
The chromatogram of the base degraded sample of MIC exhibited degraded peaks at same tR values as that seen in acid degradation while CLO showed degradant C of acid hydrolysis along with two additional degradation peaks; E and F (fig. 8). The probable reaction pathway is depicted in fig. 9. The retention time of DPs formed under alkaline condition were similar to the DPs generated under acid hydrolysis i.e. degradant depicted as A, B of MIC and degradant C of CLO. The fragmentation pattern of these DPs gained with LC-MS/MS studies; were comparable with that of acid hydrolysis products and hence it was concluded that these generated DPs were identical to that of degradants formed under acid hydrolysis. The additional CLO DPs with m/z 373.15(tR 7.491) and 449.18 (tR 8.701) depicted as E and F in chromatogram have been characterised and the MS/ MS spectrum is shown in fig. 10. Their fragmentation pattern has been predicted in fig. 11. The degradant F with m/z 449.18 undergo fragmentation and produce 411.16 fragment which follows fragmentation pattern as per degradation product of m/z 411 of acid hydrolysis.
The summary of results of stress degradation studies are given in Table 2. The DPs along with the probable structures is summarised in Table 3.
| Molecular Formula | TM (EM) | Stress condition | IUPAC name |
|---|---|---|---|
| C7H5Cl3. + DP A | 193.97 (193.94) | Acid, Base Hydrolysis: MIC | 2,4-dichloro-1-(chloromethyl) benzene |
| C11H10Cl2N2O+DP B | 257.00 (257.00: Acid and 257.02: Base) | Acid, Base Hydrolysis: MIC | 1-[2-(3,5-Dichloro-phenyl)-ethyl]-1 H-imidazole |
| C22H29ClF2O4+ DP C | 411.17 (411.21) | Acid, Base Hydrolysis: CLO | 17-(2-Chloro-acetyl)-9-fluoro-11,17 -dihydroxy-10,13.16-trimethyl-6,7,8 9,10,11,12,13,14,15,16,17-dodecahy dro cyclopenta[a]phenanthren-3-one |
| C22H27ClFO3+DP D | 393.16 (393.20) | Acid, Base Hydrolysis: CLO | 17-(2-Chloro-acetyl)-9-fluoro-11-hy droxy-10,13.16-trimethyl-6,7,8.9.10 11,12,13,14,15-decahydro-cyclopent a[a]phenanthren-3-one |
| C22H29O5+ DP E | 373.19 (373.15) | Base Hydrolysis: CLO | 11,17-dihydroxy-17-(2-hydroxyacetyl)-10,13,16-trimethyl-6,7,10,11,12,13,14,15,16,17-decahydro-3H-cyclopenta[a]phenanthren-3-one |
| C25H34FO6+ DP F | 448.23 (449.18) | Base Hydrolysis: CLO | 9-Fluoro-11.17-dihvdroxv-17-(2-hydroxy-acetyl)-10.13.16-trimethyl-6.7,8,9.10.11.12.13.14,15.16.17-dodecahydro-cyclopenta [a]phenant- hren-3-one;compound with butan-2-one |
Note: TM is theoretical mass, EM is experimental mass
Table 3: Summary Of DPs of MIC and CLO
Method validation:
The ICH guidelines were followed for validation studies [26].
Specificity:
Chromatograms acquired with mobile phase, mixed standard and sample solution do not show any interference at retention time of both the analyte peaks. The resolution was greater than 2. In peak purity analysis with PDA detector, peak angle values were lesser than peak threshold for both the analytes; indicative of a homogeneous peak during formulation analysis and stress studies.
Linearity and range:
The regression analysis, residual plots and F-test demonstrated the linearity and range. The correlation coefficient was found greater than 0.99 revealed optimal correlation between AUC and drug concentration within range. The regression characteristics of proposed method are summarized in Table 4. At 95 % confidence level, the calculated experimental F value (Fisher variance ratio) was smaller than critical tabulated F value. The residuals plot showed no pattern/trend for both the analytes as shown in fig. 12. All these results, demonstrate the linearity of both analytes in the chosen range.
| Parameter↓ / Analytes → | MIC | CLO |
|---|---|---|
| Concentration range (μg/ml) | 100 – 600 | 5 - 30 |
| Retention time (tR) (min) (± SD) | 5.448 (0.072) | 9.43 (0.090) |
| Regression equation ( Y= b×Concentration±a) | ||
| Intercept, a (± SD) | 1189 (±181) | 811.4 (±102) |
| Slope, b (± SD) | 1121 (±2.44) | 8551 (±38) |
| Correlation coefficient (r2) | 0.999 | 0.999 |
| F Test (12 and 4 degrees of freedom) | ||
| Experimental F ratio | 2.5244 | 1.5643 |
| Tabulated F ratio | 3.259 | 3.259 |
| Method sensitivity (μg/ml) | ||
| Limit of Detection | 3.85 | 0.29 |
| Limit of Quantitation | 11.68 | 0.88 |
Table 4: Regression Characteristics of Proposed RP-HPLC Method
Method sensitivity:
The low value of LOD and LOQ confirms sensitivity of the developed method to analyse diluted sample solutions (Table 4). Thus, establishes suitability of the method to be used as stability indicating assay method.
Accuracy (Recovery studies):
Results of recovery studies are summarized in Table 5. During independent analysis; the % mean recovery values were found in the acceptable range (100±2.0 % and % RSD less than 2.0) which demonstrate the proposed method is accurate.
Precision:
In repeatability studies, the percentage average recovery was 99.86 % for MIC and 100.36 % for CLO with % RSD below 2.0. Results of intermediate precision showed percentage mean recovery within the acceptable limit (100±2.0 % with % RSD less than 2.0). The results are summarised in Table 5 which proves precision of the proposed method.
| Sample spiked | Recovery Level (MIC) | Recovery Level (CLO) | ||||
|---|---|---|---|---|---|---|
| 80 % | 100 % | 120 % | 80 % | 100 % | 120 % | |
| Mean % Recovery | 100.28 | 99.43 | 100.47 | 99.95 | 100.36 | 99.89 |
| % RSD | 0.78 | 0.48 | 0.43 | 1.07 | 0.68 | 0.76 |
| Intermediate Precision | ||||||
| Intra-day: % Assay (±SD) | 100.22 (0.79) | 99.67 (0.85) | ||||
| Inter-day: % Assay (±SD) | 101.15 (1.32) | 100.04 (1.34) | ||||
Table 5: Result of Accuracy and Precision Studies
Robustness:
The developed HPLC-UV method parameters were deliberately altered and results are represented in Table 6. There was no significant impact of these alterations on the percentage assay and resolution. There was no significant variation in the tailing factor, retention time and theoretical plates. There was insignificant difference in the area of peaks of standard solutions of analytes for 8 h which reflects their stability.
| Parameter (Limit) | Level | Resolution, (±SD) | MIC % Assay, % RSD | CLO % Assay, % RSD |
|---|---|---|---|---|
| Wavelength of detection (±2 nm) | (–) 238 | 6.30 ± 0.17 | 100.12, 0.98 | 99.26,0.1.12 |
| (+) 242 | 6.32 ± 0.14 | 99.51, 0.81 | 98.71, 1.09 | |
| Flow Rate (±0.02 ml/min) | (–) 0.73 | 6.32 ± 0.15 | 98.89, 0.76 | 100.17, 0.91 |
| (+) 0.77 | 6.29 ± 0.11 | 99.23,0.81 | 98.92,1.06 | |
| Column (C18) | Cosmocil | 6.32 ±0.12 | 98.74,1.05 | 100.02.0.92 |
| Symmetry | 6.41 ±0.11 | 99.17,0.79 | 100.85,1.09 | |
| Column Temp. (±2°) | (–) 38 | 6.32 ±0.15 | 100.26,0.49 | 100.84,0.36 |
| (+) 42 | 6.37 ±0.16 | 99.85,0.57 | 100.05,0.81 |
Table 6: Result of Robustness Studies
Thus, in the proposed research, Reverse Phase HPLC (RP-HPLC) method for simultaneous estimation of MIC and CLO was developed and validated as per ICH guideline. The developed method was successfully applied for characterization of DPs formed under hydrolytic stress condition. The method was validated for linearity, accuracy, precision, robustness and specificity. Both drugs were found to degrade under acid and base stress conditions while showed resistant towards neutral hydrolysis. Total nine DPs; (four of MIC and five of CLO) were characterized and their degradation pathways were proposed. Satisfactory mean percentage recovery in the range of 100±2 % with % RSD not greater than 2 was observed. The developed method showed no interference from the formulation excipients and was employed successfully for simultaneous determination of MIC and CLO in pharmaceutical cream formulation.
Acknowledgments
We are thankful to Sophisticated Analytical Instrument Facility (SAIF), IIT, Powai, Mumbai and Venture Cen- ter, NCL, Pune for providing lab facility for carrying out LC-MS/MS work
References
- Handa S. Newer trends in the management of psoriasis at difficult to treat locations: Scalp, palmoplantar disease and nails. Indian Journal of Dermatol Venereol Leprol 2010;76(6):634-44.
[Crossref] [Google Scholar] [PubMed]
- Indian Pharmacopoeia Volume 2; 2018:1658-61.
- United States Pharmacopoeia-National Formulary (USP 30 NF 25). Vol. 2. Asian ed. United States Pharmacopeial Convention, Rockville; 2009:1787-8.
- Yu YC, Li ZD, Wang B, Wang Y, Zhong MK. Determination of content of miconazole nitrate in urea and miconazole cream by HPLC method. Pharm Care Res 2008;8:367-9.
- Fontana MC, Bastos MO, Beck RC. Development and validation of a fast RP-HPLC method for the determination of clobetasol propionate in topical nanocapsule suspensions. J Chromatogr Sci 2010;48(8):637-40.
[Crossref] [Google Scholar] [PubMed]
- Gagliardi L, Orsi D, Manna F, Tonelli D. HPLC determination of clobetasol propionate in cosmetic products. J Liq Chromatogr R T 2000;23(3):355-62.
- O'Connor N, Geary M, Wharton M, Sweetman P. The determination of miconazole and its related production impurities together with basic solution stability studies using a sub 2 µm chromatographic column. J Chromatogr Sci 2012;50(3):199-205.
[Crossref] [Google Scholar] [PubMed]
- Akay C, Özkan SA, Şentürk Z, Cevheroğlu Ş. Simultaneous determination of metronidazole and miconazole in pharmaceutical dosage forms by RP-HPLC. Farmaco 2002;57(11):953-7.
[Crossref] [Google Scholar] [PubMed]
- Prava VRK, Seru G. RP-HPLC method development and validation for the simultaneous determination of clindamycin and miconazole in pharmaceutical dosage forms. Pharm Methods 2014;5(2):56-60.
- Patel B, Raj H, Jain V, Sutariya, Bhatt M. Development and validation of reversed phase high performance liquid chromatography method for clobetasol Propionate and salicylic acid in its pharmaceutical dosage forms. Pharma sci monit 2014;5(2): 374-85.
- Turabi ZM, Khatatbeh OA. Simultaneous determination of clobetasol (as propionate) and chlorocresol in cream by stability indicating RP-HPLC method. Int J Pharm Sci Drug Res 2014;6(2):140-4.
- Sparidans RW, Van Velsen SG, De Roos MP, Schellens JH, Bruijnzeel-Koomen CA, Beijnen JH. Liquid chromatography–tandem mass spectrometric assay for clobetasol propionate in human serum from patients with atopic dermatitis. J Chromatogr B Analyt Technol Biomed Life Sci 2010;878(23):2150-4.
[Crossref] [Google Scholar] [PubMed]
- Kamalakannan D, Jambulingam M, Ananda Thangadurai S, Dhanam S, Jeyanthi R, Parvin Banu M, et al. New simple spectrophotometric estimation of clobetasol propionate in bulk and pharmaceutical dosage form. Der Pharm Lett 2014;6(4):52-7.
- Devi N, Kumar S, Rajan S, Gegoria J, Mahant S, Rao R. Development and validation of UV spectrophotometric method for quantitative estimation of clobetasol 17-propionate. Asian J Chem Pharm Sci 2016;1(1):36-40.
- De Zan MM, Cámara MS, Robles JC, Kergaravat SV, Goicoechea HC. Development and validation of a simple stability-indicating high performance liquid chromatographic method for the determination of miconazole nitrate in bulk and cream formulations. Talanta 2009;79(3):762-7.
[Crossref] [Google Scholar] [PubMed]
- Pagare P, Satpute C, Jadhav V, Kadam V. Forced degradation studies and validated stability indicating HPTLC method for determination of miconazole nitrate in soft lozenges. Der Pharm Lett 2012;4(6):1793-1804.
- Belal TS, Haggag RS. Gradient HPLC-DAD stability indicating determination of miconazole nitrate and lidocaine hydrochloride in their combined oral gel dosage form. J Chromatogr Sci 2012;50(5):401-9.
[Crossref] [Google Scholar] [PubMed]
- Fauzee AF, Walker RB. Forced degradation studies of clobetasol 17‐propionate in methanol, propylene glycol, as bulk drug and cream formulations by RP‐HPLC. J Sep Sci 2013;36(5):849-56.
[Crossref] [Google Scholar] [PubMed]
- Bassuoni YF, Elzanfaly ES, Essam HM, Zaazaa HE. Development and validation of stability indicating TLC densitometric and spectrophotometric methods for determination of clobetasol propionate. Bull Fac Pharm Cairo Univ 2016;54(2):165-74.
- Damle MC, Polawar AR. Stability indicating HPTLC method for the estimation of clobetasol propionate in presence of alkali induced degradation product. Int J Pharm Tech Res 2014;6:1914-25.
- Xiao-ping YU. HPLC Determination of the Content of Two Components in Compound Miconazole Nitrate Cream. Chin J Pharm Anal 2005;25(7):871-3.
- Li XZ, Gu WU. Determination of miconazole nitrate and clobetasol propionate in compound miconazole nitrate ointment by HPLC. Anhui Med Pharm J 2001;1-7.
- Malani PS, Raj HA, Jain VC. Development and validation of analytical method for simultaneous estimation of Miconazole Nitrate and Clobetasol propionate in cream by HPTLC method. Pharm Sci Monit 2014;5(2):386-99.
- Patel HB, Patel BA, Parmar SJ. Development and validation of second order derivative spectrophotometric method for simultaneous estimation of Atenolol and Nifedipine in combined dosage form. Int J Pharm Sci Res 2013;4(10):3884-65.
- ICH Q1A Stability Testing of New Drug Substances and Products. In: Proceedings of the International Conference on Harmonisation, Geneva 1993;19.
- ICH Q2 (R1) Validation of analytical procedures: text and methodology. In: proceedings of the International Conference on Harmonization 2005.
