- *Corresponding Author:
- Parul Parmar
K. B. Raval College of Pharmacy, Shertha, Gandhinagar-382 423, India
E-mail: parul1383@gmail.com
| Date of Submission | 04 July 2008 |
| Date of Revision | 09 April 2009 |
| Date of Acceptance | 08 August 2009 |
| Indian J Pharm Sci, 2009, 71 (4): 451-454 |
Abstract
A simple, precise, accurate and rapid high performance thin layer chromatographic method has been developed and validated for the determination of clotrimazole in bulk drug and tablet dosage form. The stationary phase used was precoated silica gel 60F 254 . The mobile phase used was a mixture of cyclohexane:toluene:methanol:triethyleamine (8:2:0.5:0.2 v/v/v/v). The detection of spot was carried out at 262 nm. The method was validated in terms of linearity, accuracy, precision and specificity. The calibration curve was found to be linear between 200 to 1000 ng/spot for clotrimazole. The limit of detection and the limit of quantification for clotrimazole were found to be 50 ng/spot and 200 ng/spot, respectively. The proposed method can be successfully used to determine the drug content of bulk drug and marketed formulation of tablet.
Keywords
HPTLC method of estimation, Clotrimazole, Tablets
Clotrimazole is a broad spectrum antimycotic agent. Clotrimazole is chemically 1H-imidazole-1- [(2-chlorophenyl)diphenylmethyl] [1]. Various analytical methods have been reported for the estimation of clotrimazole that include HPLC [2-8], UV/Vis spectrophotometric [9-13], colorimetric [14], differential pulse polarographic [15]. A few HPTLC methods [16-19] were also reported for the estimation of clotrimazole in creams and ointment formulation. However no method was reported for estimation of clotrimazole in tablet dosage form. The present study describes a simple, sensitive and precise HPTLC method for the estimation of clotrimazole in bulk drug and tablet dosage form.
Clotrimazole working standard was obtained as a gift sample from Relish Pharmaceuticals Limited, Ahmedabad, India. Silica gel 60F254 TLC plates (20×20 cm, layer thickness 0.2 mm E. Merck, Germany) were used as the stationary phase. All chemicals and reagents used were of analytical grade. Cyclohexane:toluene:methanol:triethyleami ne (8:2:0.5:0.2 v/v/v/v) was used as mobile phase. Methanol was used as solvent. Tablets containing clotrimazole (equivalent to 100 mg clotrimazole) were purchased from a local pharmacy (Candid, Glenmark Pharmaceutical Ltd and Canesten, Bayer Pharmaceutical Ltd). A Camag HPTLC system comprising of Camag linomat IV semiautomatic sample applicator, Hamilton syringe (100 μl), Camag TLC scanner-3, Camag CATS4 software, Camag Twin trough chamber (10×10 cm) and ultrasonicator were used during study.
Working standard of clotrimazole (10 mg) was weighed accurately and diluted with methanol to obtain the final concentration of 40 μg/ml. The contents of twenty tablets were grounded to a fine powder. Weight equivalent to 100 mg of clotrimazole was transferred to conical flask and dissolved in 10 ml methanol. The solution was sonicated for 15 min and filtered using Whatman filter paper No 41 and residue was washed with methanol. The extracts and washings were pooled and transferred to a 25 ml volumetric flask and volume was made with methanol. Required dilutions were made to get 40 μg/ ml of clotrimazole. TLC plates were prewashed with methanol. Activation of plates was done in an oven at 50˚ for 5 min. The chromatographic conditions maintained were precoated silica gel 60F254 aluminum sheets (10×10 cm) as stationary phase, cyclohexane: toluene:methanol:triethyleamine (8:2:0.5:0.2 v/v/v/v) as mobile phase, chamber and plate saturation time of 30 min, migration distance allowed was 50 mm, wavelength scanning was done at 262 nm keeping the slit dimension at 2×0.2 mm. A mercury lamp provided the source of radiation.
To prepare calibration curve, from standard solution of 40 μg/ml clotrimazole aliquots of 5, 10, 15, 20 and 25 μl were applied on the TLC plate. The TLC plate was dried, developed and analyzed photometrically as described earlier. The developed method was validated in terms of linearity, accuracy, specificity, limit of detection and limit of quantification, intra-day and inter-day precision and repeatability of measurement as well as repeatability of sample application (Table 1). For analysis of the formulation, 10 μl of the filtered solution of the formulation was spotted on to the same plate followed by development scanning. The analysis was repeated in two marketed tablet formulations. The content of the drug was calculated from the peak areas recorded.
| Parameters | Results |
|---|---|
| Linearity range (ng/spot) | 200-1000 |
| Correlation coefficient | 0.9998 |
| Regression equation (y=mx+c) | |
| Slope (m) | 1.5007 |
| Intercept (c) | 370.08 |
| Limit of detection (LOD) | 50 ng/spot |
| Limit of quantitation (LOQ) | 200 ng/spot |
| Precision (%RSD) | |
| Repeatability of application (n=5) | 1.79 |
| Repeatability of measurement (n=5) | 0.69 |
Table 1: Method Validation Parameters
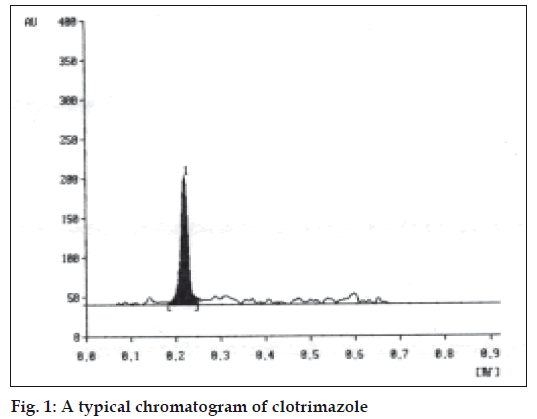
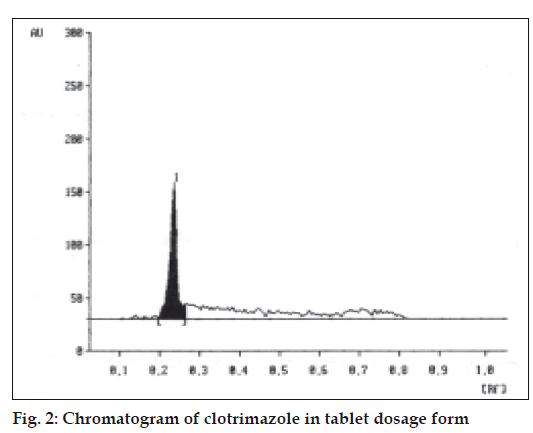
A solvent system that would give dense and compact spot with appropriate Rf values was desired for quantification of clotrimazole in pharmaceutical formulations. The mobile phase consisting of cyclohexane: toluene:methanol:triethyleamine (8:2:0.5:0.2 v/v/v/v) gave Rf values of 0.22 (±0.05) for clotrimazole in bulk drug (fig. 1), and for clotrimazole in tablet formulation (fig. 2). The linear regression data (n=5) showed a good relationship over a concentration range of 200-1000 ng/spot for clotrimazole.
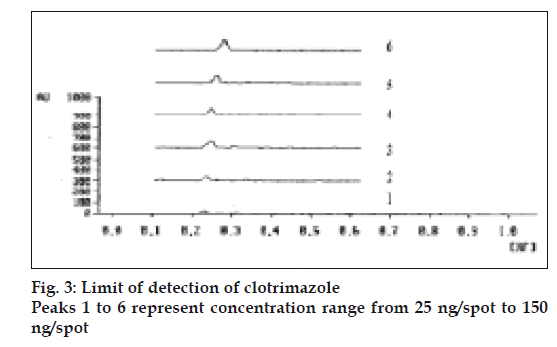
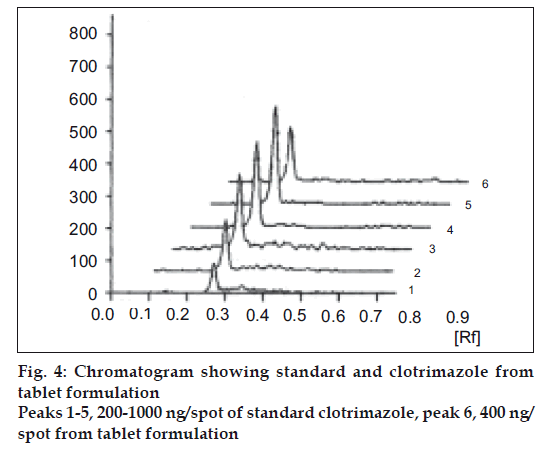
The limit of detection is the lowest amount of analyte in a sample that can be detected but not necessarily quantitated under the stated experimental conditions. Clotrimazole standard solutions (5 μg/ml) in the quantities of 5, 10, 15, 20, 25 and 30 μl were spotted on TLC plate, developed, dried in hot air and photometrically analyzed as described. The limit of detection was found 50 ng/spot (fig. 3). The limit of quantification (LOQ) is the lowest concentration of analyte in a sample that can be determined with the acceptable precision and accuracy under stated experimental conditions. Lowest concentration of calibration curve for standard clotrimazole was considered as LOQ. The LOQ was found 200 ng/spot (fig. 4).
The intra-day precision was determined by analyzing standard solutions in the concentration range of 200 to 1000 ng/spot of clotrimazole for 3 times on the same day, while inter-day precision was determined by analyzing corresponding standards daily for 3 days over a period of one-week. The intra-day and inter-day coefficients of variation are in range of 0.61 to 3.36 and 1.17 to 4.44, respectively.
Repeatability of sample application was assessed by spotting 15 μl of drug solution 7 times on a TLC plate followed by development of plate and recording a peak area for 7 spots. The % RSD for peak area values of clotrimazole was found to be 1.79. Repeatability of measurement of peak area was determined by spotting 15 μl of clotrimazole solution on a TLC plate and developing the plate. The separated spot was scanned five times without changing the position of the plate and the % RSD for measurement of peak area of clotrimazole was 0.69. To confirm the specificity of the proposed method, the solution of the formulation was spotted on the TLC plate, developed and scanned. It was observed that the excipients present in the formulation did not interfere with the peaks of clotrimazole.
Recovery studies were carried out to assess accuracy parameters. These studies were carried out at three levels. Sample stock solution from tablet formulation of 40 μg/ml was prepared. Dilutions were made and recovery studies were performed. % Recovery was found to be within the limits as listed in Table 2. The low % RSD value indicated the suitability of the method for routine analysis of clotrimazole in pharmaceutical tablet dosage forms. The developed HPTLC technique is simple, precise, specific and accurate and the statistical analysis proved that the method is reproducible and selective for the analysis of clotrimazole in bulk drug and tablet formulations.
| Excess drug added to the formulation (%) | Theoretical content (ng) | Recovery (%) | % RSD |
|---|---|---|---|
| 00 | 400 | 99.21 | 0.35 |
| 50 | 600 | 100.86 | 0.14 |
| 100 | 800 | 99.30 | 0.12 |
| 150 | 1000 | 100.21 | 0.076 |
Table 2: Recovery Studies Of Clotrimazole
Acknowledgements
The authors thank Mr. I. S. Rathod, Dr. S. A. Shah and Dr. B. N. Suhagia, Department of Quality Assurance, L. M. College of Pharmacy, Ahmedabad, for providing all facilities during research work.
References
- Florey K. Analytical profiles of drug substances and excipients. Vol. 11. New York: Academic Press; 1990. p. 226.
- The Indian Pharmacopoeia, 4th ed. Vol. 1. New Delhi: Controller of Publication; 1996. p. 196-8.
- The United States Pharmacopoeia, Asian ed. XXIV, National Formulary, IXX, vol. I, Rockville MD: The US Pharmaceutical Covention; 2003. P. 451-5.
- Ouyang X, Shuling R. Determination of metronidazole, clotrimazole and chlorhexidine acetate in shuangzo effervescent tablets by HPLC. Yaowu Fenxi Zazhi 2002;22:78-80.
- 5. Abdel-Moety EM, Kelani KO, Abou Al-Alamein AM. Simultaneous determination of Clotrimazole and Betamethasone dipropionate by coupled TLC-Densitometry, HPLC, and Derivative UV Spectrophotometry. Saudi Pharm J 2002;10:44-53.
- Huang DL, Wang L. RP-HPLC determination of metronidazole, clotrimazole and chlorhexidine acetate in shuangzuaotai suppository compound. Yaowu Fenxi Zazhi 2002;22:129-31.
- Quing Z. HPLC determination of Metronidazole, Clotrimazole and Chlorhexidine acetate in their compound effervescent tablets. Yaowu Fenxi Zazhi 2001;21:335-7.
- Solich P, Hajkova R, Pospisilova M, Sicha J. Determination of methylparaben, propylparaben, clotrimazole and its degradation products in topical cream by RP-HPLC. Chromatographia 2002;56:5181-4.
- Agarwal D, Jain DK, Trivedi P. Simultaneous spectrophotometric estimation of tinidazole and clotrimazole in tablet formulations. Indian Drugs 1998;35:499.
- Bedair M, Korany MA, Fahmy OT. Derivative spectrophotometric determination of clotrimazole in single formulations and in combination with other drugs. J AOAC Int 1989;72:432.
- Rao TS, Rao PS, Prasad UV, Sastry CS. Spectrophotometric determination of Sertraline and Clotrimazole with precipitation reagents. Acta Ciencia Indica Chem 2002;28:73-6.
- Rao PSNHR, Rao TS, Prasad UV, Sastry CSP. Extractive spectrophotometric determinations of Clotrimazole in formulations. Asian J Chem 2002;14:190-6
- Huakan L, Guizhi Z, Yanquing Z, Zuo L. Spectrophotometric determination of clotrimazole based on charge transfer reaction between Clotrimazole and Chloranilic acid. Zhongguo Huaxuehui Fenxi Huaxue 2002;30:334-6
- Chainani ML, Rao LS, Chavda S. A colorimetric method for the estimation of Clotrimazole in pharmaceutical preparations. Indian Drugs 1981;18:405-7.
- Pereira FC, Zanoni MV, Guaratini CC, Fogg AG. Differential pulse polarographic determination of Clotrimazole after derivatization with procion Red HE-3B. J Pharm Biomed Anal 2002;27:201-8.
- Roychowdhury U, Das SK. Rapid identification and quantitation of Clotrimazole, Miconazole and Ketoconazole in ointments by Thin-Layer Chromatography-Densitometry. J AOAC Int 1996;79:656-9.
- Cakar M, Popovic G, Agbaba D. High performance Thin-Layer Chromatography determination of some Antimycotic Imidazole derivatives and preservatives in medicinal creams and a gel. J AOAC Int 2005;88:1544-8.
- Vaidya VV, Menon SN, Singh GR, Kekare MB, Choulcekar MP. Simultaneous HPTLC determination of clotrimazole and tinidazole in a pharmaceutical formulation. J Planar Chromatogr Modern TLC 2007;20:145-7.
- Abdel-moety EM, Khattab FI, Kelani KM, AbouAl-Alamein AM. Chromatographic determination of clotriamazole, ketoconazole and fluconazole in pharmaceutical formulations. IL Farmaco 2003;57:931-8.


