- *Corresponding Author:
- P. S. Jain
Department of Pharmaceutical Chemistry, R. C. Patel Institute of Pharmaceutical Education and Research, Shirpur-425405, India
E-mail: pritash79@yahoo.com
| Date of Submission | July 23, 2011 |
| Date of Revision | March 27, 2012 |
| Date of Acceptance | April 10, 2012 |
| Indian J Pharm Sci, 2012, 74 (2): 152-156 |
Abstract
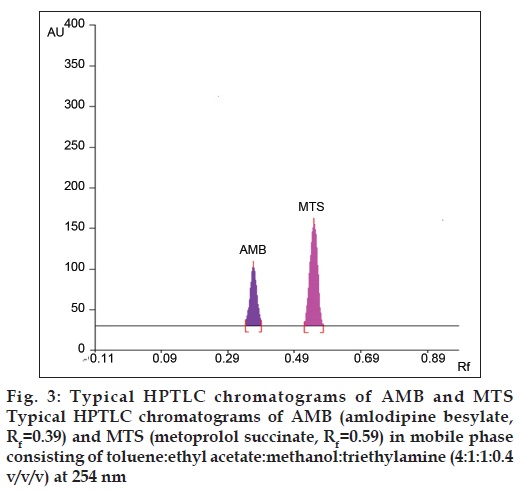
A simple, selective, precise highâ??performance thinâ??layer chromatographic method for simultaneous determination of amlodipine besylate and metoprolol succinate in bulk and pharmaceutical combined dosage form was developed and validated. The method employed HPTLC aluminum plates precoated with silica gel 60Fâ??254 (10×10) as the stationary phase. The solvent system consisted of toluene:ethyl acetate:methanol:triethylamine (4:1:1:0.4 v/v/v). The system was found to give a compact spot for amlodipine besylate (Rf = 0.39±0.02) and metoprolol succinate (Rf = 0.59±0.02). Densitometric analysis of amlodipine besylate and metoprolol succinate was carried out in the absorbance mode at 254 nm. Linear regression analysis data for the calibration plots showed good linear relationship with r2 = 0.9990±0.0013 with respect to peak area in the concentration range 400â??1400 ng per spot for amlodipine besylate and r2 = 0.9993±0.0013 with respect to peak area in the concentration range 3800–13300 ng per spot for metoprolol succinate. The method was validated for precision, recovery and robustness. The limits of detection and quantitation were 39.99 and 121.20 ng per spot for amlodipine besylate and 234.31 and 710.03 ng per spot for metoprolol succinate, respectively. Statistical analysis proved that the method is selective, precise and accurate for the estimation of amlodipine and metoprolol.
Keywords
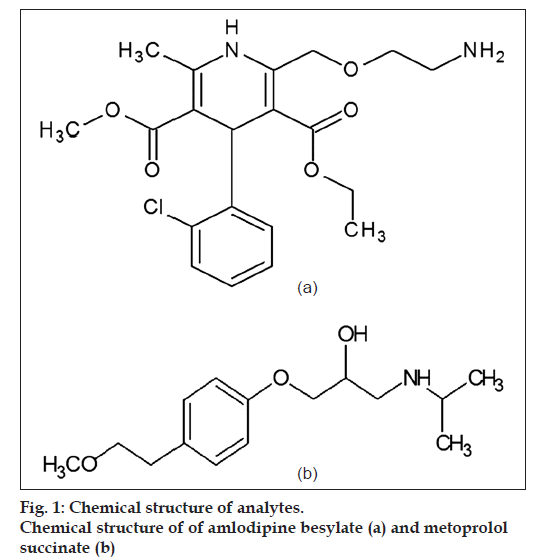
Amlodipine besylate, HPTLC, metoprolol succinate, pharmaceutical formulationAmlodipine besylate (AMB, fig. 1), chemically, (RS)‑3‑ethyl‑5‑methy-l‑2‑(2‑amino ethoxymethyl)‑ 4‑(2‑chlorophenyl)‑1,4‑dihydro‑6‑methyl‑3,5‑ pyridinedicarboxylate benzene sulfonate [1], is a long acting calcium channel blocker, which is used as an antihypertensive agent [2‑4]. Metoprolol succinate (MTS, fig. 1), is chemically (RS)‑1‑ (Isopropylamino)‑3‑ [4‑(2‑methoxyethyl)phenoxy] propan‑2‑ol, a selective β1‑receptor blocker, which is also used as an antihypertensive agent [5].
For estimating AMB, methods have been reported using HPLC, HPTLC and UV spectrophotometry alone or in combination with other drugs [6‑11]. Various methods have been reported for the analysis of MTS in bulk and in pharmaceutical formulation such as those using HPLC, ultra performance liquid chromatography (UPLC) with different column materials and mobile phase systems [12‑16]. This method developed has chosen over the reported HPTLC method owing to a better mobile phase composition of the method reported [17].
Literature review revealed that no HPTLC method has been reported for estimation of AMB and MTS as single components or as a mixture. The present study reports development and validation of a simple, accurate, economical and reproducible method for the analysis of AMB and MTS using HPTLC at 254 nm either as bulk drug mixture or in combined tablet dosage form.
Materials and Methods
AMB and MTS were provided as gift samples by Sun Pharmaceuticals Ltd., Mumbai, India. Toluene, methanol, ethyl acetate and triethylamine were used as solvents to prepare the mobile phase. All chemicals used were of HPLC grade (S. D. Fine Chem. Ltd., Mumbai, India) used without further purification.
Instrumentation and HPTLC conditions
The samples were spotted in the form of bands of width 6 mm with 100 μl sample syringe on precoated silica gel aluminium plate 60 F254 (10×10 cm, E Merck, Darmstadt, Germany) using a Camag Linomat 5 (Switzerland) sample applicator. The plates were prewashed with methanol and activated at 110° for 5 min, prior to chromatography. A constant application rate of 150 nl/sec was employed and space between two bands was maintained at 14 mm. The slit dimension was kept at 6×0.45 mm. The mobile phase consists of toluene:ethyl acetate:methanol:triethylamine (4:1:1:0.4 v/v/v). Linear ascending development was carried out in 10×10 cm twin trough glass chamber. The optimized chamber saturation time for mobile phase was 30 min, at temperature (25±2°) and relative humidity (60±5%); the length of chromatogram run was 8 cm and TLC plates were air‑ dried. Densitometric scanning was performed on a Camag TLC Scanner 3 equipped with winCATS software version 1.3.0 at 254 nm. The source of radiation utilized was deuterium lamp. Evaluation was performed using peak area with linear regression.
Preparation of standard solution
An accurately weighed quantity (10 mg) of AMB and 95 mg of MTS were transferred to 10 ml volumetric flask containing 4 ml methanol and volume was adjusted to mark with methanol to obtain a concentration of 1000 ng/µl of AMB and 9500 ng/µl of MTS. Dilutions were prepared from the stock solution of AMB and MTS. For AMB linearity range employed was 400‑1400 and for MTS 3800‑13300 ng/spot.
Analysis of tablets
Twenty Metpure AM 2.5 (25 mg MTS + 2.5 mg AMB) tablets were weighed and powdered in a glass mortar. An amount of powder equivalent to 2.5 mg of AMB and 23.75 mg of MTS was transferred to 25 ml volumetric flask, extracted with methanol for 20 min by shaking mechanically. The solution was diluted to volume with the same solvent and filtered. A sample solution of 6 µl was spotted on TLC plate followed by development and scanning as described in instrumentation and HPTLC condition section. The concentration of drugs was determined from linear regression equations and % label claim was calculated. The developed method was validated in terms of linearity, specificity, precision, accuracy, robustness and ruggedness [18].
Results and Discussion
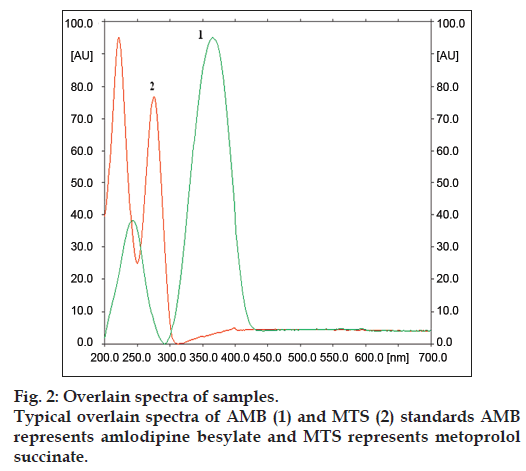
In this study, quantitative determination of AMB and MTS in tablets was performed by a HPTLC method. The HPTLC developed was found to be simple, rapid and sensitive, which did not require any pretreatment procedure. Typical overlain spectra of AMB and MTS were shown in fig. 2. Also the typical HPTLC Chromatogram obtained from the analysis of standard AMB (Rf = 0.39) and MTS (Rf = 0.59) was shown in fig. 3. The peak purity of AMB and MTS were found to be 0.999 and 0.998, respectively indicating that no impurities or degradation products were found along with the peaks of standard drug solutions, hence making the method specific. Regression analysis for the HPTLC method was carried out (Tables 1 and 2) and a highly linear calibration graph (r2 = 0.999) indicated adherence of the method to Beer’s law. Quantitative determination of AMB and MTS in tablets using this HPTLC method indicated good agreement with the labeled amount of AMB and MTS (Table 3). Closeness of the amount found to the amount taken and the low coefficient of variation value showed that the proposed method was accurate and precise. Recovery study conducted by the HPTLC method was performed by spiking 80, 100 and 120 % of additional drug recovery of 99.48‑100.87% for AMB and 99.85‑100.88 as listed in Table 4. The method was found to be precise based on the results obtained in the intra‑day and inter‑day precision evaluation study. These results were expressed in terms of % RSD that was found to be less than 2 (Table 5). High recovery values followed by low % RSD value (<2) coupled with low standard deviation makes the proposed method highly suitable for accurate and precise determination of AMB and MTS in combined tablet dosage forms. Repeatability was determined by spotting 8 µl of standard solutions on a TLC plate. After developing the plate, separated spots of AMB and MTS were scanned six times without changing position of the plate and RSD for measurement of peak area was calculated, which was found to be 0.9391 and 0.8947% for AMB and MTS, respectively (Table 6).
| Concentration (ng/spot) | Peak area (mean ± SD; n=5) | % RSD |
|---|---|---|
| AMB | ||
| 400 | 793.94 ± 11.70 | 1.47 |
| 600 | 1177.48 ± 10.98 | 0.93 |
| 800 | 1544.76 ± 14.50 | 0.93 |
| 1000 | 1950.34 ± 23.59 | 1.20 |
| 1200 | 2267.44 ± 30.43 | 1.34 |
| 1400 | 2708.42 ± 29.11 | 1.07 |
| MTS | ||
| 3800 | 1605.52 ± 15.59 | 0.97 |
| 5700 | 2364.82 ± 25.68 | 1.08 |
| 7600 | 3022.62 ± 30.69 | 1.01 |
| 9500 | 3809.96 ± 15.27 | 0.40 |
| 11400 | 4537.82 ± 29.27 | 0.64 |
| 13300 | 5182.86 ± 33.37 | 0.64 |
AMB represents amlodipine besylate and MTS represents metoprolol succinate
Table 1: Statistical Analysis For The Calibration Curves Of Amb And Mts
| Drugs | Label claim | Amount found | Amount found |
|---|---|---|---|
| (mg) | (mg) | (%) | |
| AMB | 2.5 | 2.4676 | 98.70 |
| 2.5 | 2.5149 | 100.59 | |
| 2.5 | 2.4935 | 99.74 | |
| 2.5 | 2.5191 | 100.76 | |
| 2.5 | 2.5131 | 100.52 | |
| Mean ± SD | 2.5016 ± 0.0214 | 100.06 ± 0.8576 | |
| % RSD | 0.8570 | 0.8570 | |
| MTS | 23.75 | 24.2147 | 101.9568 |
| 23.75 | 23.5162 | 99.0158 | |
| 23.75 | 24.0145 | 101.1139 | |
| 23.75 | 23.8671 | 100.4932 | |
| 23.75 | 23.6207 | 99.4558 | |
| Mean ± SD | 23.7439 ± 0.1742 | 99.9745 ± 0.7335 | |
| % RSD | 0.7337 | 0.7337 |
Brand name of the tablets used was Metpure-AM 2.5, with Batch No.LAA07008 manufactured by M/s Emcure Ltd., Pune
Table 2: Determination Of Amb And Mts In Tablet Formulation
| Components | Initial amount (ng/spot) | Amount added (%) | Amount recovered ± SD (ng/spot, n=3) | % Recovered | % RSD |
|---|---|---|---|---|---|
| AMB | 600 | 0 | 602.43 ± 6.27 | 100.40 | 1.04 |
| 600 | 80 | 1074.38 ± 7.08 | 99.48 | 1.48 | |
| 600 | 100 | 1199.52 ± 8.17 | 99.96 | 1.36 | |
| 600 | 120 | 1331.48 ± 6.76 | 100.87 | 0.93 | |
| MTS | 5700 | 0 | 5691.86 ± 41.30 | 99.85 | 0.72 |
| 5700 | 80 | 10249.88 ± 50.03 | 100.34 | 1.09 | |
| 5700 | 100 | 11438.76 ± 42.90 | 100.24 | 0.75 | |
| 5700 | 120 | 12650.32 ± 72.21 | 100.88 | 10.4 |
AMB represents amlodipine besylate and MTS represents metoprolol succinate
Table 3: Recovery Analysis Of Amb And Mts In Tablets
| Drugs | Conc. (ng/spot) | Intra-day amount found (ng) | Inter-day amount found (ng) | ||
|---|---|---|---|---|---|
| Mean ± SD (n=5) | % RSD | Mean ± SD (n=5) | % RSD | ||
| AMB | 600 | 604.92 ± 6.02 | 0.99 | 601.62 ± 5.05 | 0.84 |
| 800 | 801.00 ± 4.59 | 0.57 | 797.81 ± 9.39 | 1.17 | |
| 1000 | 997.57 ± 7.23 | 0.72 | 996.81 ± 12.34 | 1.23 | |
| MTS | 5700 | 5613.06 ± 39.72 | 0.68 | 5713.33 ± 71.79 | 1.25 |
| 7600 | 7610.55 ± 45.91 | 0.60 | 7611.95 ± 46.42 | 0.60 | |
| 9500 | 9495.53 ± 76.11 | 0.80 | 9563.82 ± 16.06 | 0.16 | |
AMB represents amlodipine besylate and MTS represents metoprolol succinate
Table 4: Intra-Day And Inter-Day Precision Studies
| Application volume [µl] | Area AMB | Area MTS |
|---|---|---|
| (800 ng/spot) | (7600 ng/spot) | |
| 8 | 1548.6 | 3016.4 |
| 8 | 1542.8 | 3057.8 |
| 8 | 1562.6 | 3069.8 |
| 8 | 1523.3 | 3088.4 |
| 8 | 1551.5 | 3071.5 |
| 8 | 1529.8 | 3029.8 |
| Mean | 1543.1 | 3055.617 |
| SD | 14.4919 | 27.34011 |
| %RSD | 0.9391 | 0.894749 |
AMB represents amlodipine besylate and MTS represents metoprolol succinate
Table 5: Results Of Repeatability Studies
| Analyst | % Amount found | % RSD | % Amount found | %RSD |
|---|---|---|---|---|
| AMB (n = 3) | MTS (n = 3) | |||
| I | 100.23 | 1.38 | 100.32 | 0.84 |
| II | 100.02 | 0.78 | 100.26 | 0.76 |
AMB represents amlodipine besylate and MTS represents metoprolol succinate
Table 6: Ruggedness Studies
The results of ruggedness and robustness evaluation were shown in Table 7.
| Parameters | AMB | MTS | ||
|---|---|---|---|---|
| SD of peak area (n=6) | % RSD | |||
| SD of peak area (n=6) | % RSD | |||
| Mobile phase composition | 16.84 | 1.09 | 22.09 | 0.72 |
| Toluene:ethyl acetate: | ||||
| methanol:triethylamine; | ||||
| 4:1:1:0.4 (v/v/v) | ||||
| Toluene: ethyl acetate: | 24.80 | 1.59 | 31.00 | 1.01 |
| methanol:triethylamine; | ||||
| 3.5:1.3:1.2:0.4 (v/v/v) | ||||
| Mobile phase volume | ||||
| 6.4 ml | 18.56 | 1.18 | 18.56 | 0.60 |
| 12.4 ml | 21.32 | 1.36 | 21.32 | 0.69 |
| Development distance | ||||
| 7 cm | 13.82 | 0.89 | 13.82 | 0.45 |
| 7.5 cm | 22.24 | 1.41 | 22.24 | 0.72 |
| 8 cm | 28.61 | 1.85 | 34.71 | 1.13 |
| Relative humidity | ||||
| 55 | 11.09 | 0.71 | 11.09 | 0.36 |
| 65 | 15.85 | 1.03 | 18.41 | 0.60 |
| Duration of saturation | ||||
| 20 min | 14.88 | 0.95 | 21.51 | 0.70 |
| 25 min | 18.69 | 1.20 | 10.94 | 0.35 |
| 30 min | 18.88 | 1.22 | 22.02 | 0.71 |
| Activation of prewashed | ||||
| TLC plates | ||||
| 8 min | 14.06 | 0.90 | 14.06 | 0.46 |
| 10 min | 28.48 | 1.56 | 28.58 | 0.93 |
| 12 min | 12.78 | 0.82 | 29.70 | 0.96 |
| Time from spotting to chromatography | 13.33 | 0.89 | 28.77 | 0.93 |
| Time from chromatography to scanning | 12.84 | 0.84 | 26.35 | 0.86 |
AMB represents amlodipine besylate and MTS represents metoprolol succinate
Table 7: Results Of Robustness Studies
The developed HPTLC technique is found to be precise, specific, accurate and stability indicating. The developed method was validated based on ICH guidelines. Statistical analysis indicated that the method is repeatable and selective for the analysis of AMB and MTS both in bulk drug mixture and in tablets.
The developed method appears to be useful for determining purity of these drugs available from various sources. It is necessary to evaluate this method further in degradation kinetics of AMB and MTS and also for estimating these drugs in plasma and other biological fluids. In conclusion, the proposed HPTLC method is suitable for the analysis of amlodipine besylate and metoprolol succinate in commercial tablets.
Acknowledgements
We thank the Principal, R. C. Patel Institute of Pharmaceutical Education and Research, Shirpur for providing the facilities to carry out the research work.
References
- British Pharmacopoeia (A-I). London: The Stationary Office Medicinal and Pharmaceutical Substances; 2008. p. 137.
- Budavari S, editors. The Merck Index. 13th ed. Whitehouse Station, NJ, USA: Merck and Co., Inc.; 2001. p. 86.
- Hoffman BB. Therapy of Hypertension. In: Brunton LL, Lazo JS, Parker KL, editors. Goodman and Gilman’s Pharmacological Basis of Therapeutics. 11th ed. New York: McGraw-Hill Professional; 2006. p. 845-68.
- Sweetman SC. Martindale-The Complete Drug Reference. 33rd ed. London: The Pharmaceutical Press; 2002. p. 862.
- Available from: http: //en.wikipedia.org/wiki/metoprolol. [Last accessed on 2011 Jul 11].
- Safeer K, Anbarasi B, Senthilkumar N. Analytical method development and validation of amlodipine and hydrochlorothiazide in combined dosage form by RP-HPLC. Int J ChemTech Res 2010;2:21-5.
- Ramadan NK, Mohamed HM, Moustafa AA. Rapid and highly sensitive HPLC and TLC methods for quantitation of amlodipine besylate and valsartan in bulk powder and in pharmaceutical dosage forms and in human plasma. Anal Lett 2010;43:570-81.
- Chitlange SS, Bagri K, Sakarkar DM. Stability indicating RP- HPLC method for simultaneous estimation of valsartan and amlodipine in capsule formulation. Asian J Res Chem 2008;1:15-8.
- Younus M, Reddy TK, Reddy YR, Arif MF. RP-HPLC method development and validation for simultaneous estimation of amlodipine besylate, valsartan and hydrochlorothiazide in tablet dosage form. J Pharm Res 2010;3:2647-50.
- Shah DA, Bhatt KK, Mehta RS, Baldania SL, Gandhi TR. Stability indicating RP-HPLC estimation of atorvastatin calcium and amlodipine besylate in pharmaceutical formulations. Indian J Pharm Sci2008;70:754-60.
- Jayaseelan S, Rajasekar M, Ganesh S, Sekar V, Perumal P. RP-HPLC method development and validation for simultaneous estimation of Losartan Potassium, Amlodipine Besilate and Hydrochlorthiazide in tablet dosage form. Der Pharm Chem 2010;2:31-6.
- Chandra Bose RJ, Sivanseyal G, Duraisamy KK, Surender NS, Ramasamy P. Validated RP-HPLC method for the simultaneous estimation of ramipril and metoprolol tartrate in bulk and tablet dosage form. Asian J Biol Pharm Res 2011;2:171-7.
- PrasadaRao MM, Rahaman SA, Ragjendra Prasad Y, Gangi Reddy P. RP-HPLC method of simultaneous estimation of amlodipine besylate and metoprolol in combined dosage form. Int J Pharm Res Dev 2010;9:69-76.
- Rajamanickam V, Stephen Rathinaraj B, Thangavelpandian N, Pandian AR. A validated RP-HPLC method of metoprolol succinate and amlodipine succinate from bulk drugs. Der Pharm Lett 2010;2:40-6.
- Joshi P, Kumar M. Development and validation of a reverse phase HPLC method for the simultaneous estimation of metoprolol and telmisartan in tablet dosage form. Der Pharm Sin 2011;2:211-9.
- Seshadri RK, Desai MM, Raghavaraju TV, Krishnan D, Rao DV, Chakravarthy IE. Simultaneous quantitative determination of metoprolol, atorvastatin and ramipril in capsules by a validated stability-indicating RP-UPLC method. Sci Pharm 2010;78:821-34.
- Kakde R, Bawane N. High-performance thin-layer chromatographic method for simultaneous analysis of metoprolol succinate and amlodipine besylate in pharmaceutical preparations. J PlannChromatogr2009;22:115-9.
- Q2 (R1) ICH guidelines, 2005. Available from: http: //www.ich.org/ LOB/media/MED/A417.pdf. [Last accessed on 2011 May 12].


