- Corresponding Author:
- S. Katekhaye
Medicinal Natural Products Research Laboratory, Department of Pharmaceutical Science and Technology, Institute of Chemical Technology, Matunga, Mumbai-400 019, India
E-mail: shankar.katekhaye@gmail.com
| Date of Submission | 10 March 2011 |
| Date of Revision | 28 December 2011 |
| Date of Acceptance | 31 December 2011 |
| Indian J Pharm Sci, 74 (1): 72-75 |
Abstract
A rapid, simple and specific reversed-phase HPLC method has been developed for analysis of karanjin in Pongamia pinnata Linn. leaves. HPLC analysis was performed on a C18 column using an 85:13.5:1.5 (v/v) mixtures of methanol, water and acetic acid as isocratic mobile phase at a flow rate of 1 ml/min. UV detection was at 300 nm. The method was validated for accuracy, precision, linearity, specificity. Validation revealed the method is specific, accurate, precise, reliable and reproducible. Good linear correlation coefficients (r2>0.997) were obtained for calibration plots in the ranges tested. Limit of detection was 4.35 μg and limit of quantification was 16.56 μg. Intra and inter-day RSD of retention times and peak areas was less than 1.24% and recovery was between 95.05 and 101.05%. The established HPLC method is appropriate enabling efficient quantitative analysis of karanjin in Pongamia pinnata leaves.
Keywords
HPLC, karanjin, Pongamia pinnata, quantification, validation
Introduction
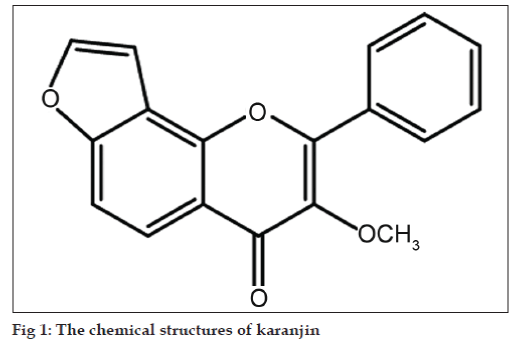
Karanja (Pongamia pinnata, syn. P. glabra; Family: Leguminoceae) is a plant used in medicine from the time of Ayurveda, the ancient system of Indian medicine. The major active constituent of Pongamia pinnata is karanjin. Chemically karanjin (fig. 1) is a furanoflavonoid [1]. The juice of leaves is prescribed in flatulence, dyspepsia, diarrhoea and cough. It is also considered a remedy for leprosy and gonorrhoea. A hot infusion of the leaves is used as a medicated bath for relieving rheumatic pain, cleaning foul ulcers and sores [2-4]. Pongamia pinnata leaves show antiviral activity, antiparasitic, antiinflammatory and used in dermatitis and crusting [5-8]. Isolated karanjin shows the promising antihyperglycemic activity [9]. In view of the interesting biological activity of this constituent, it was of interest to develop a suitable, simple, rapid, and sensitive novel analytical procedure for quantification of karanjin, not only to facilitate standardization but also for use in scientific and commercial applications.
Karanjin from Medicinal Natural Product Research Laboratory, Institute of Chemical Technology, Mumbai was used. HPLC grade methanol and acetic acid were purchased from Merck India. Solvents were filtered through a 0.45 μm filter (Millipore Bedford, MA, USA) and degassed in an ultrasonic bath (Remi Instruments, Mumbai, India) before use. Pongamia pinnata leaflets were collected from Mumbai, India and authenticated. A voucher specimen of the plant material (SNPS-871) has been preserved in the herbarium of Institute of Chemical Technology, Mumbai, India. Stock solution (1 mg/ ml) of karanjin was freshly prepared in methanol. Standard solutions at six concentrations (karanjin concentration range 5–100 μg/ml; 5, 10, 20, 30, 40, 50, 60, 70, 80, 90 and 100 μg/ml) were prepared by appropriate dilution.
Five grams of the dried leaflet powder was weighed and extracted with methanol by Soxhlet apparatus for 24 h. The extract was filtered and volume was made up in 100 ml volumetric flask. One millilitre of this stock solution was transferred to 10 ml volumetric flask and volume was made up to 10 ml with methanol and used for HPLC analysis.
HPLC analysis was performed with a Jasco (Hachioji, Tokyo, Japan) system consisting of an intelligent pump (PU-1580, PU-2080), a high-pressure mixer (MX-2080-31), a manual sample injection valve (Rheodyne 7725i) equipped with a 20 μl loop, and a UV/Vis detector (UV-1575). HPLC column of 250×4.6 mm internal diameter, 5 μm particle, Hibar LiChrocart Purospher Star RP-18 (Merck, Darmstadt, Germany) was used, with 85:13.5:1.5 (%, v/v) methanol-water-acetic acid as isocratic mobile phase at a flow rate of 1 ml/min. The injection volume was 20 μl and the detection wavelength was 300 nm. HPLC was performed at ambient temperature and data were analyzed on a computer equipped with Borwin software.
Calibration plots were constructed for standard karanjin, after triplicate analysis of each calibration solution, by plotting peak area against concentration (μg/ml) of the corresponding standard solution. To determine the limits of detection (LOD) and quantification (LOQ) standard solutions were further diluted in methanol. LOD and LOQ were defined as the amounts for which signal-tonoise ratios (S/N) were 3 and 10, respectively. Precision was determined as the intra day and inter day variation of results from analysis of three different standard solutions. Intra day precision was determined by triplicate analysis of each solution on a single day. Inter-day precision was determined by triplicate analysis of the solutions on three successive days. To test sample stability, solutions were stored at room temperature and analyzed after 0, 2, 4, 8, 12, 24, and 48 h. The relative standard deviations (RSD) of retention time (Rt) and peak area (Pa) were calculated as measures of precision, repeatability, and stability. The accuracy of the method was determined by application of the standard addition method. Accurately known amounts of the standards (1 ml standard of 250, 500, and 1000 μg/ml concentration to the 1 ml of the extract having concentration 500 μg/ml) were added and analyzed in duplicate as described above. The total amount of each compound was calculated from the corresponding calibration plot and the recovery of each compound was calculated by use of the equation: Recovery (%) = (amount found - amount contained)/amount added×100.
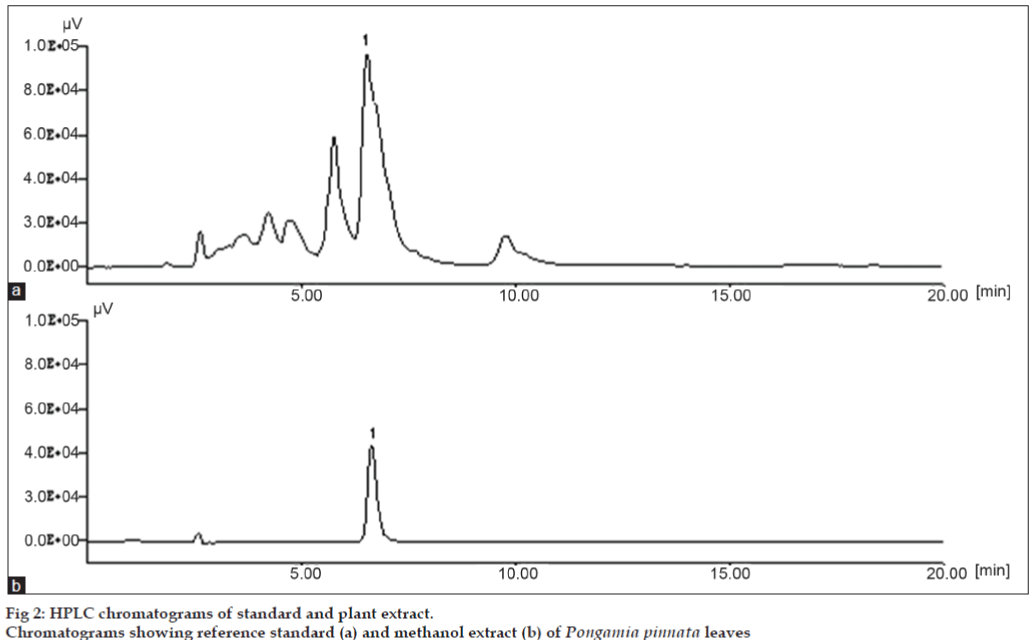
The method was optimized by varying the flow rate and the relative amounts of methanol, water and acetic acid. Use of a concentration of methanol (85%), water (13.5%) and acetic acid (1.5%) and flow rate of 1 ml/min was optimum which resulted in sharp peaks and better resolution. Decreasing the flow rate resulted in slow elution with distortion of the chromatographic peaks. When 85:13.5:1.5 (v/v) methanol, water and acetic acid were used at a flow rate of 1.0 ml/min, karanjin was eluted at 6.5 min. The wavelength of maximum absorption (λmax) of karanjin is at 300 nm. Chromatograms obtained from a standard solution and a sample (fig. 2) reveal the selected marker constituent in standard and sample solutions ware having same retention time. The purity of karanjin was found to be 98%. Spiking the sample solution with the standard compounds was also used to assist confirmation of peak identity.
The calibration plots for karanjin was linear in the range 10-100 µg/ml (r2=0.997). The regression equation was y=12221.0x+10828. The LOD and LOQ were 4.35 and 16.56 µg, for karanjin. Intraday and inter-day RSD of retention time and peak area was less than 1.24%, showing precision was good. The reproducibility of the method was also good (RSD 1.20%, Table 1) and, recovery of karanjin was in the range 95.05-101.05%, with RSD <2.24%, indicating the analysis was accurate (Table 2).
| Analyte | Precision (RSD, %) | Repeatability (n = 3) | Stability | |||||
|---|---|---|---|---|---|---|---|---|
| Intra-day (n= 3) | Inter-day (n= 3) | Mean content (mg/g) | RSD of Pa (%) | RSD of Pa (%) | ||||
| Rt | Pa | Rt | Pa | |||||
| Karanjin | 10 µg/ml | 0.11 | 1.18 | 0.12 | 1.24 | 1.19 | 1.20 | 0.84 |
| 8 µg/ml | 0.14 | 0.87 | 0.18 | 0.10 | 0.88 | 0.90 | 0.61 | |
| 6 µg/ml | 0.26 | 0.95 | 0.20 | 0.10 | 0.97 | 0.91 | 0.85 | |
Note: Rt is retention time and Pa is peak area
Table 1: Precision, repeatability and stability of karanjin
| Analyte | Contained (μg) | Added (μg) | Found (μg) | Recovery (%) | Mean (%) | RSD (%) |
|---|---|---|---|---|---|---|
| Karanjin | 28.75 | 1000 | 979.27 | 95.05 | 97.70 | 2.24 |
| 28.75 | 1000 | 987.72 | 95.89 | |||
| 28.75 | 500 | 522.04 | 98.65 | |||
| 28.75 | 500 | 523.89 | 98.65 | |||
| 28.75 | 250 | 271.00 | 96.90 | |||
| 28.75 | 250 | 281.40 | 101.05 |
Table 2: Recovery of karanjin from pongamia pinnata leaves
These results revealed that, the method enables rapid, precise, sensitive and highly accurate quantification of karanjin. When the method was used for analysis of a Pongamia pinnata leaves, the amounts of karanjin was in the range of 0.2 to 0.35% (Table 1).
In this study a validated HPLC method for quantification of karanjin in Pongamia pinnata leaves has been established. The method enabled highly accurate, sensitive and reproducible quantification of karanjin. It can be used for quantitative analysis and quality control of Pongamia pinnata leaves as a marker compound.
Acknowledgements
Authors are thankful to Institute of Chemical Technology for providing facilities for work.
References
- Maurya R, Yadav PP. Furanoflavonoids: An overview. Nat Prod Rep2005;22:400-24.
- Nadkarni AK. Indian MateriaMedica. Vol 1. 3rd ed. Mumbai: BombayPopular Prakashan; 1982. p. 1001-4.
- Kirtikar KR, Basu BD. Indian Medicinal Plants. 2nd ed. Allahabad:Lalit Mohan Basu; 1981. p. 830-2.
- Anonymous. The Wealth of India (Raw materials). Volume VII: Ph-Re. New Delhi: Council of Scientific and Industrial Research; 2005.p. 206- 11.
- Essa MM, Subramanian P, Suthakar G, Manivasagam T, DakshayaniKB. Protective influence of Pongamiapinnata (Karanja) onblood ammonia and urea levels in ammonium chloride-inducedhyperammonemia: antihyperammonemic effect of the leaf extract.J Appl Biomed 2005;3:133-8.
- Rameshthangam P, Ramasamy P. Antiviral activity ofbis(2- methylheptyl)phthalate isolated from Pongamiapinnata leavesagainst White Spot Syndrome Virus of PenaeusmonodonFabricius.Virus Res 2007;126:38-44.
- Srinivasan K, Muruganandan S, Lal J, Chandra S, Tandan SK, PrakashVR. Evaluation of antiinflammatory activity of Pongamiapinnata leavesin rats. J Ethnopharmacol 2001;78:151-7.
- Moton JF. The Pongam tree, unfit for Florida landscaping, has multiplepractical uses in under-developed lands. Proceeding of the FloridaHorticulture Society 1990;103:338-43.
- Akanksha, Shrivastava AK, Maurya R. Antihyperglycemic activity ofcompounds isolated from Indian medicinal plants. Indian J ExpBiol2010;48:294-8.


