- *Corresponding Author:
- Disha Parjapati
Department of Pharmacognosy, Parul Institute of Pharmacy and Research, Parul University, Vadodara, Gujrat 391760, India
E-mail: disha.prajapati@paruluniversity.ac.in
| Date of Received | 13 July 2023 |
| Date of Revision | 02 August 2024 |
| Date of Acceptance | 25 October 2024 |
| Indian J Pharm Sci 2024;86(5):1845-1851 |
This is an open access article distributed under the terms of the Creative Commons Attribution-NonCommercial-ShareAlike 3.0 License, which allows others to remix, tweak, and build upon the work non-commercially, as long as the author is credited and the new creations are licensed under the identical terms
Abstract
Herbs are the main source of polyherbal formulations. The potency of polyherbal formulations depends on their ingredients. The evaluation parameters for polyherbal formulations are based on chemical, physical and microbiological assessment. The aim of the present study was to formulate and standardize Palash beejadi churna and develop a simple, accurate and reproducible high performance thin layer chromatography method for simultaneous estimation of phytoconstituents in the formulation. Embelin and conessine were selected as the markers for development of high performance thin layer chromatography method. The chromatographic analysis was performed on pre-coated thin layer chromatography plates with silica gel G60 F254 using toluene:ethyl acetate:formic acid:ammonia:diethyl amine (3:3:1.5:0.5:2.5 v/v/v/v/v) as solvent system. Both the markers were scan at 520 nm. The retention factors values of conessine and embelin were 0.46 and 0.87, respectively. Linearity for conessine and embelin was observed in the ranges 2000-6000 ng/spot. Limit of detection and limit of quantification values of conessine and embelin were found to be 624.5 and 768.5, 1892 and 2328 (ng/spot), respectively. The average percent recovery of conessine and embelin was found to be 98 % and 101 %, respectively. The SD and percent relative SD for of intraday and interday precision of both the markers were found to be <2 % respectively. The high performance thin layer chromatography method was validated as per the International Council for Harmonisation guideline and found to be simple, precise, specific, sensitive and accurate that can be used for routine quality control of raw material as well as formulation containing any of these markers.
Keywords
Conessine, embelin, standardization, high performance thin layer chromatography, validation
Physicians frequently recommend herbal remedies that combine a few markers. Because they work synergistically in combination to reduce toxicity, polyherbal formulations have a superior therapeutic impact than single medication treatments[1].
It is crucial to pharmacognostically standardise polyherbal formulations so that the product's quality is assured when tested and demonstrates the proper therapeutic efficacy. The Ayurvedic Pharmacopoeia of India (API) provides the standard value and assessment protocol for the raw drug[1,2].
Palash Beejadi Churna (PBC) of Rasoddaratantra, mentioned in the Ayurvedic Formulary of India, PBC is a frequently prescribed medicine for Krimiroga[3]. PBC was prepared following the procedure as given in the Ayurvedic Formulary of India[4]. The composition of churna was described in Table 1[5-10].
| S. No. | Components | Part used in formulation | Scientific name | Major chemical constituents |
|---|---|---|---|---|
| 1 | Palash beejadi | Seed | Butea monosperma | Palmitic acid, oleic acid, linolenic, linalenic and stearic acid |
| 2 | Indrayava (kutaja) | Seed | Holarrhena pubescens | Conessine, norconessine, conimine, conessimine, isoconessimine and antidysentericine |
| 3 | Vidanga | Fruit | Embelin ribes | Embelin, vilangin, quercitol, tannins and volatile oil |
| 4 | Nimbabija | Seed | Azadirachta indica | Azadirachtin, nimbosterol, nimbdiol, nimbilin, nimolinin, nimbin and nimbidin |
| 5 | Chiryata (kiratatikta) | Plant | Swertia chirata bunch Ham | 1,3,7,8-tetrahydroxyxanthone, 1,3,8- trihydroxy-5-methoxyxanthone, 1,5,8- trihydroxy-3-methoxyxanthone, swertianin, sweroside, chiratanin, amarogentin and amaroswerin |
Table 1: Components of PBC
High-Performance Thin-Layer Chromatography (HPTLC) is an extremely valuable quantitative investigation method that combines the rules of chromatography with speed and automation. HPTLC plays a significant role in today's logical world. HPTLC is an effective separation tool for quantitative separation methods with high sample throughput[1,2].
According to a review of the literature, there are several methods available for estimating embelin and conessine individually and in combination with other phytoconstituents. Moreover, there is no HPTLC method available for simultaneous estimation of embelin and conessine as shown in fig. 1.
As a consequence, the aim of the present study is to develop and validate HPTLC method for the simultaneous estimation of embelin and conessine simultaneously in PBC. Additionally, these two markers are also used in other Ayurvedic formulations, including PBC and Krimi Kuthara Rasa.
Materials and Methods
PBC was prepared following the procedure as given in the Ayurvedic Formulary of India. The ingredients viz., Palash (Butea monosperma) seed, Dravya (Holarrhena pubescens (Bunch-Ham) Wall. ex G. Don) seeds, Vidanga (Embelia ribes Burm.f.) fruits, Nimba (Azadirachta indica. Juss.) seed, Chirata (Swertia chirayita (Roxb.) Buch. Ham) whole plant was purchased from Yucca Yucca Enterprises, Mumbai, Maharashtra[3].
Experimental condition of HPTLC:
Preparation of reference standard solution (embelin and conessine): Prepared 500 μg/ml solution with 0.5 mg of each marker weighed and transferred to 10 ml volumetric flask, added approximately 1 ml chloroform to volumetric flask and the contents of the flask were then dissolved, sonicated and mixed[7,8].
Preparation of sample solution: Accurately weighed 1 g of PBC was transferred to 100 ml of beaker, 10 ml chloroform was added to the beaker and was covered with aluminium foil and placed for 24 h. After 24 h it was filtered with 5 mm Whatman filter paper and dried. The dried extract was dissolved in chloroform, sample solution of PBC was prepared[3].
Selection of wavelength: Since the approach was developed utilising a simultaneous estimation technique, it is crucial to detect both standards at the right concentrations using two separate wavelengths. After standards spotting and formulation, an HPTLC plate was scanned at both 254 and 366 nm.
Optimised HPTLC condition: In order to analyse and separate conessine and embelin correctly in samples as well as in standards, adequate chromatographic conditions were developed by analysing numerous Thin Layer Chromatography (TLC) and HPTLC trials as shown in Table 2.
| Parameters | Conditions |
|---|---|
| Mobile phase | Toluene:ethyl acetate:formic acid:ammonia:diethylamine (3:3:1.5:0.5:2.5) |
| Saturation time | 15 min |
| Solvent | Chloroform |
| Wavelength | 520 nm |
| Visualization in UV | Iodine chamber is used for conessine at 254 nm and 366 nm for embelin |
Table 2: Optimised HPTLC Conditions
Method validation:
The method was developed in order to separate and quantify markers embelin and conessine in PBC. Appropriate conditions were developed in order to properly determine the markers, as it is necessary to evaluate whether the developed method is really accurate, precise, robust, etc., validation has to be performed. So, validation of the developed method was performed as per International Council for Harmonisation (ICH) guidelines Q2(R2). Specificity, precision, linearity, consistency, robustness, Limit of Detection (LOD), Limit of Quantification (LOQ) and system suitability were all accessed as part of the validation of the developed method[11,12].
System suitability: System suitability testing was done to determine whether or not the established method is appropriate. Embelin and conessine standards were spotted six times using the same volume for each spot (8.0 μl/spot) of the 500 μg/ml solution.
Specificity: The specificity was determined by analysing standard and test sample in developed mobile phase. The spot of each standard in the sample was confirmed by the Retention factors (Rf) values and UV spectra of the separate bands of the standard peaks.
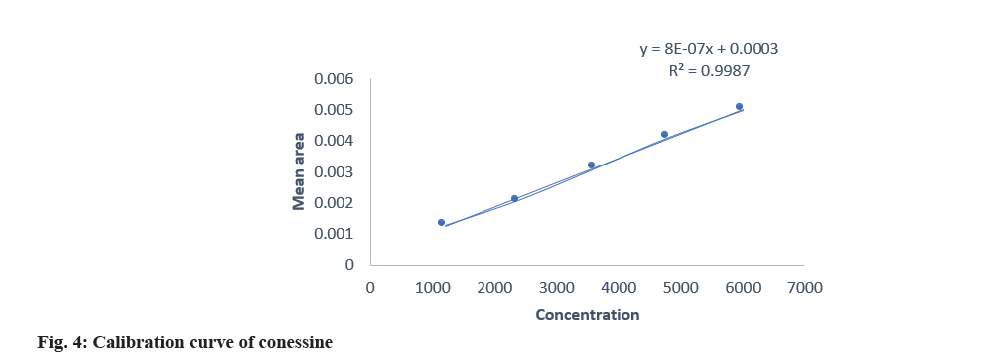
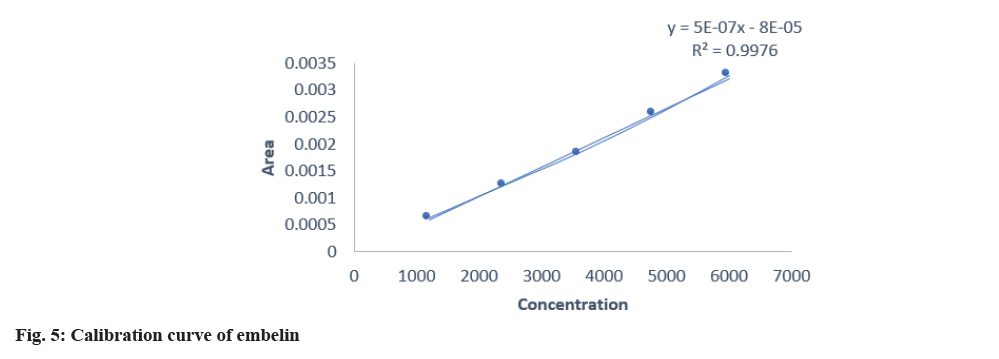
Linearity: Mixture of 500 μg/ml of the two markers i.e., embelin and conessine was prepared. Calibration was performed by deciding the range with respect to the concentration of markers present in the formulation. This stock solution was spotted on 10×10-dimension TLC plate in the volume of (8, 16, 24, 32 and 40) μl. Using the above result calibration graph was plotted using concentration vs. peak area to obtain a regression coefficient (R2).
Accuracy: Accuracy was assessed by adding known amounts of standard to the sample matrix silica gel G60 F254. The accuracy was determined by relative recovery method. The percentage recoveries of both the markers were found at three different concentration levels of 80 %, 100 % and 120 %.
Precision: Precision was evaluated in terms of intraday precision and interday precision. Intraday precision was determined by analysing the standard solution at different intervals within the same day. The Standard Deviation (SD) and Percent (%) Relative SD (RSD) was calculated. The interday precision was determined by measuring same concentration (500 μg/ml) at six times on three different days and mean, SD and % RSD was calculated.
LOD: LOD was carried out based on calibration curve method. A specific calibration curve was studied using sample containing an analyte in the range of Detection Limit (DL). The SD of y-intercepts of regression lines used as the SD. It was calculated as per ICH guidelines, equation as shown below,
LOD=3.3×SD/slope of calibration curve
LOQ: LOQ was carried out based on calibration curve method. A specific calibration curve was studied using sample containing an analyte in the range of Quantification Limits (QL). The SD of y-intercepts of regression lines used as the SD. It was calculated as per ICH guidelines, equation as shown below,
LOQ=10×SD/slope of calibration curve
Robustness: To determine the robustness of the developed method, small changes were made to some of the developed conditions in order to see the capacity of developed method to remain unchanged. Changes were made in parameters like saturation time (±2) and in the detection wavelength (±2) in order to calculate SD and % RSD thus to prove the reliability of method.
Results and Discussion
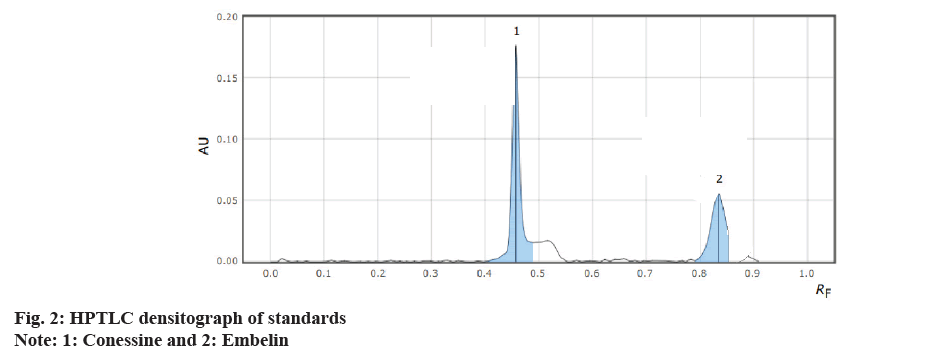
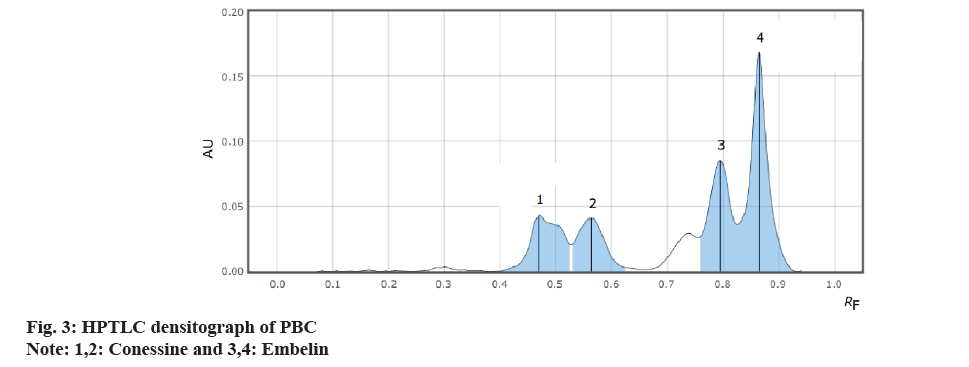
The identification of the markers in the PBC was done using different compositions of the mobile phase and was optimised depending on the polarities of the solvents. Standard conessine and embelin with the Rf values of 0.46 and 0.83, respectively, at the selected wavelength of 520 nm it was found that the toluene:ethyl acetate:formic acid:ammonia:diethyl amine as a mobile phase with the ratio (3:3:1.5:0.5:2.5 v/v/v/v/v) shows a good and sharp peak when the complete chamber saturation is done for 15 min with the mobile phase.
It was found that a good and well-defined peak was shown in fig. 2 and fig. 3.
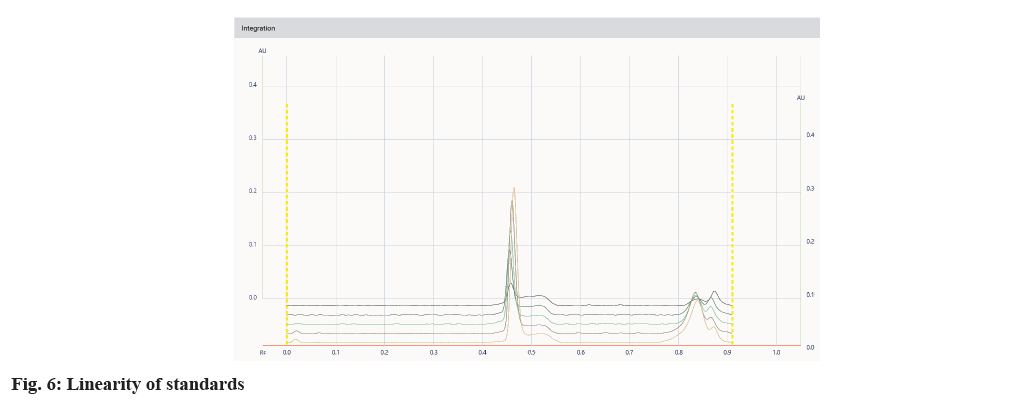
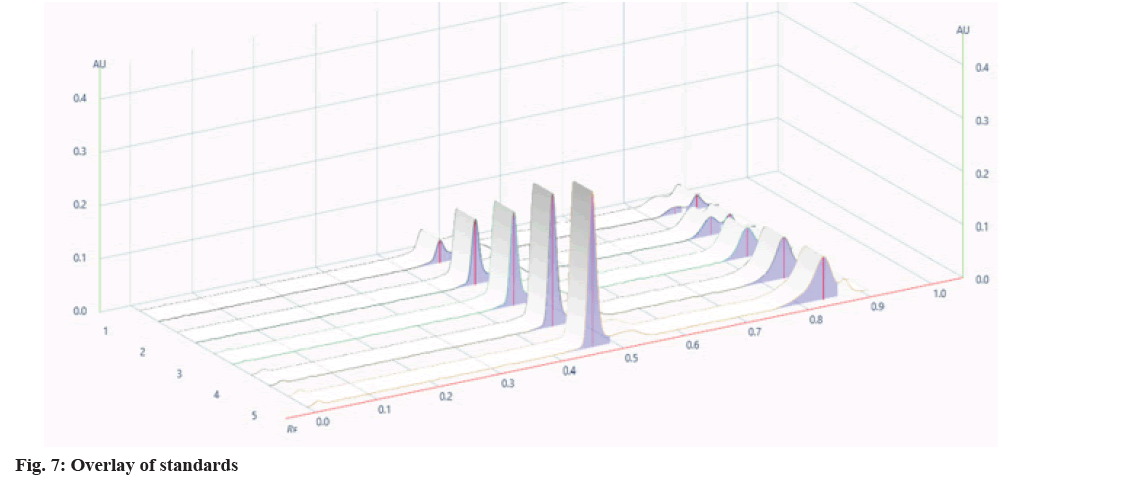
The developed method was validated by parameters like linearity, precision, specificity, accuracy, and robustness according to the ICH Q2(R2) guidelines. Specificity was established by comparing standard drugs with the sample formulation and by collating the retardation factor and the spectrum of the standard with the sample formulation. The developed method was found to be specific, as shown in Table 3. The linearity of conessine and embelin was established in the concentration range of (8-12) μl in the range of 1200-6000 μg/band, and it was found to be linear in the range with a regression coefficient (R2) 0.998 for conessine and 0.997 for embelin as shown in Table 4. The calibration curves for conessine and embelin are shown in fig. 4-fig. 7. A recovery study for accuracy was performed at three different levels; 80 %, 100 %, and 120 % by spiking the standards, and the % recovery and % RSD were calculated. The accuracy results are shown in Table 5. A precision study was performed by analysing intraday and interday variations. It was carried out at one concentration in each of the six replicates. The procedures were found to be precise. Intraday was performed by repeating one concentration six times in the interval of time calculation shown in Table 6, and interday was performed by repeating one concentration in a day in six replicates as shown in Table 7. Robustness was performed by the minor changes in the wavelength of 520±2 and the saturation time of 15±2 min as shown in Table 8. Quantification of standard in the formulation was done by the R2 equation by the area of the standard in formulation as shown in Table 9.
| Sample | Rfvalues | |
|---|---|---|
| Conessine | Embelin | |
| Mixture | 0.465 | 0.835 |
| Formulation | 0.456 | 0.829 |
Table 3: Scanning result of specificity for both the markers and formulation
| Standard | R2 value | Equation |
|---|---|---|
| Conessine | 0.998 | y=0.0000008x+0.0003 |
| Embelin | 0.997 | y=0.0000005x-0.00008 |
Table 4: Linearity of conessine and embelin
| Spike (%) | Recovery (%) | % RSD |
|---|---|---|
| Conessine | ||
| 80 | 0.9801 | 1.249 |
| 100 | 0.9806 | 0.363 |
| 120 | 1.02 | 0.622 |
| Embelin | ||
| 80 | 0.9801 | 0.673 |
| 100 | 1.01 | 0.817 |
| 120 | 1.01 | 0.363 |
Table 5: Accuracy of conessine and embelin
| Standard | Mean±SD | % RSD |
|---|---|---|
| Conessine | 0.00215±0.00008 | 0.421 |
| Embelin | 0.00122±0.00001 | 0.956 |
Table 6: Interday precision of conessine and embelin
| Standards | Mean±SD | % RSD |
|---|---|---|
| Conessine | 0.002148±0.00001 | 0.801 |
| Embelin | 0.001248±0.00002 | 1.785 |
Table 7: Intraday precision of conessine and embelin
| Parameters | Changes | % RSD | |
|---|---|---|---|
| Conessine | Embelin | ||
| Wavelength | (350±2) nm | 0.719 | 1.235 |
| Saturation time | (15±2) min | 0.718 | 1.682 |
Table 8: Robustness study of conessine and embelin
| Standard | Quantification (µg/spot) |
|---|---|
| Conessine | 4862 |
| Embelin | 6320 |
Table 9: Quantification of conessine and embelin
It is necessary to be sure about the quality of the formulation in order to ensure the quality of PBC (Table 10). Standardisation was carried out. A proper method was developed for the quantification of conessine and embelin, which were 4862 μg/spot and 6320 μg/spot respectively. The linearity of conessine and embelin was found in the range of (1200-6000) ng/spot. The accuracy of conessine and embelin was in the range 98 %±102 %, as per ICH guidelines. LOD and LOQ of conessine were 624 and 768, apparently for embelin it was 1892 and 2328. The robustness study for both of these markers was done by comparing wavelength and saturation time ±2 to their desired data. So, we conclude that all validation parameters were as per ICH guidelines, and simultaneous estimation of conessine and embelin was followed by the HPTLC method.
| Parameters | Conessine | Embelin |
|---|---|---|
| Rf value | 0.46 | 0.83 |
| Scanning wavelength (nm) | 520 | 520 |
| Linearity range (ng/spot) | 1200-6000 | 1200-6000 |
| Regression equation | y=0.0000008x+0.0003 | y=0.0000005x-0.00008 |
| R2 value | 0.9987 | 0.9976 |
| Intercept | 0.0003 | 0.00008 |
| LOD (ng/spot) | 624 | 1892 |
| LOQ (ng/spot) | 768 | 2328 |
Table 10: Summary of validation parametrs
Acknowledgements:
The authors are thankful to the management of Parul Institute of Pharmacy and Research, Parul University, Vadodara for providing facilities to carry out this research work.
Conflict of interest:
The authors declare no conflict of interests.
References
- Jain A, Parashar AK, Nema RK, Narsinghani T. High Performance Thin Layer Chromatography (HPTLC): A modern analytical tool for chemical analysis. Curr Res Pharm Sci 2014:8-14.
- Wankhade PR, Gupta RD, Das RJ, Awandekar NB, Umekar MJ. Review on pharmacological and phytochemistry of Embelia ribes plant. Int J Pharmacogn Life Sci 2021;2:34-43.
- Anonymous. The Ayurvedic Formulary of India. 1st ed. New Delhi: Ministry of Health and family welfare; 2003. p. 123.
- Pharmaceutical analysis definition and scope. Pharmaguideline; 2022.
- National Center for Biotechnology Information. PubChem Compound Summary for CID 3218; Embelin: 2022.
- Saraf A, Srinivas KS, Chaturvedi A. Validation of HPTLC method for quantification of embelin from Embelia ribes Burm. f. Int J Pharmacog Phytochem Res 2016;8(9):1492-6.
- Jain KL, Patel RK, Patel HP. HPTLC method for simultaneous determination of piperine, embeline, and carvone in the ayurvedic formulation Catpusphadhya churna. J AOAC Int 2014;97(3):773-7.
- National Center for Biotechnology Information. PubChem Compound Summary for CID 441082, Conessine: 2022.
- Kaur AD, Ravichandran V, Jain PK, Agrawal RK. High-performance thin layer chromatography method for estimation of conessine in herbal extract and pharmaceutical dosage formulations. J Pharm Biomed Anal 2008;46(2):391-4.
[Crossref] [Google Scholar] [PubMed]
- Bhujbal PS, Sandhya P. Chromatographic analysis of bioactive markers in Vidangarista, an ayurvedic polyherbal formulation. J Planar Chromatogr Mod 2012;25:42-7.
- Bhardwaj SK, Dwivedia K, Agarwala DD. A review: HPLC method development and validation. Int J Anal Bioanal Chem 2015;5(4):76-81.
- ICH Steering Committee. ICH Q2 (R2) validation of analytical procedures: Method. European agency for the evaluation of medicinal products, International commission on harmonisation, (CPMP/ICH/281/95). 2022.

