- *Corresponding Author:
- K. K. Pradhan
Department of Pharmaceutical Analysis and Quality Assurance, Royal College of Pharmacy and Health Sciences
E-mail: kishanta_pradhan@yahoo.com
| Date of Submission | 25 February 2011 |
| Date of Revision | 19 November 2011 |
| Date of Acceptance | 27 November 2011 |
| Indian J Pharm Sci, 2011, 73 (6): 693-696 |
Abstract
A simple, specific, accurate and stability-indicating UV- Spectrophotometric method was developed for the estimation of candesartan cilexitil, using a Shimadzu, model 1700 spectrophotometer and a mobile phase composed of methanol: water in the ratio of 9:1 at wave length (λmax) 254 nm. Linearity was established for candesartan in the range of 10- 90 μg/ml. The percentage recovery of was found to be in the range of 99.76-100.79%. The drug was subjected to acid, alkali and neutral hydrolysis, oxidation, dry heat, UV light and photolytic degradation. Validation experiments performed to demonstrate system suitability, specificity, precision, linearity, accuracy, interday assay, intraday assay, robustness, ruggedness, LOD, and LOQ. While estimating the commercial formulation there was no interference of excipients and other additives. Hence this method can be used for routine determination of candesartan cilexetil in bulk and their pharmaceutical dosage forms. The proposed method for stability study shows that there was appreciable degradation found in stress condition of candesartan.
Keywords
Analytical method, Candesartan cilexetil, degradation, UV Spectroscopy, validation
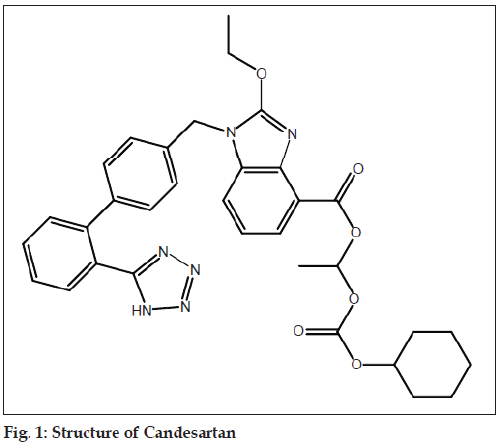
Candesartan cilexetil, (±)-1- [ [(Cyclohexyloxy) carbonyl]oxy]ethyl-2-ethoxy-1- [ [2’-(1H-tetrazol-5-yl) [1,1’-biphenyl]-4-yl]methyl]-1H-benzimidazole-7- carboxylate (fig.1), is a novel, potent, highly selective non peptide Angiotensin II type 1 receptor blocker which is administered orally as candesartan cilexetil, which is rapidly and completely hydrolyzed to candesartan, the active moiety, during absorption from the gastrointestinal tract [1-3].
Candesartan has much greater affinity (>10,000 folds) for the AT1 receptor than for the AT2 receptor blockade of the renin-angiotensin system with ACE inhibitors; it does not bind to or block other hormone receptors or ion channels known to be important in cardiovascular regulation [4,5]. UV Spectrophotometric method was developed and validated as per ICH guidelines. Spectrophotometric method is generally preferred especially by small-scale industries as the cost of the equipment is less and the maintenance problems are minimal. The method of analysis is based on measuring the absorption of a monochromatic light by colorless compounds in the near ultraviolet path of spectrum (200-380 nm) [6-8].
The API is subjected to a number of force degradation conditions which include acidic, basic, and oxidative conditions. Force degradation should be one of the activities performed early in the development process to ensure that the method is discriminating between the API and degradants. Depending on the API, not every stress agent may effect degradation, but each agent has to be evaluated to determine whether degradation occurs [9,10].
In the present study all the reagents and solvents were used of analytical grade. The tablet formulation (Dr. Reddy’s Laboratories Pvt. Ltd., Hyderabad, India) containing 8 mg of candesartan was procured from local market and used for analysis. The analysis was performed by using an electronic balance (Sigma 200/A super) and UV/Vis spectrophotometer (Shimadzu model 1700).
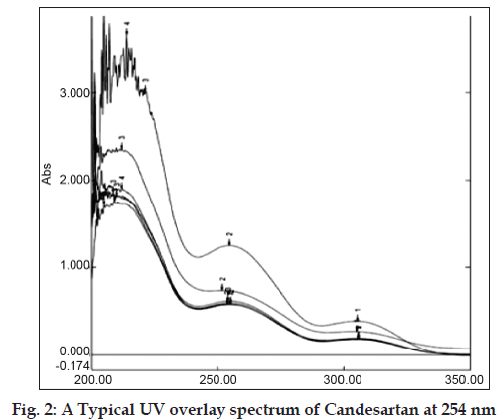
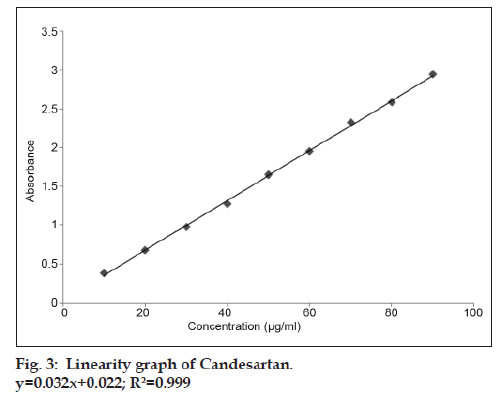
Basing on the solubility study of candesartan the solvent chosen for UV analysis was methanol:water (9:1). Standard stock solution of candesartan was prepared by dissolving 10 mg of bulk drug in 100 ml of methanol:water (9:1). It was shaken properly to dissolve the drug and then the volume was adjusted with solvent to get 100 μg/ml concentration. In order to ascertain the wavelength of maximum absorbance (λmax) of the API solution of particular concentration of 10 μg/ml was scanned within the wavelength range of 200-400 nm against a corresponding blank solvent. The resulting overlay spectrum of absorption curve was presented in fig 2. The absorption curves showed characteristic absorption maxima at 254 nm for candesartan. The prepared stock solution was further diluted with methanol:water (9:1) to get working standard solution of 10, 20….up to 90 ppm to construct calibration curve (Table 1). The absorbance of each solution was measured at 254 nm against methanol:water (9:1) as blank. The standard graph for candesartan was plotted by taking concentration of drug on X-axis and absorbance on Y-axis (fig. 3). The drug obeyed Beer’s law in the concentration range of 10-90 μg/ml and R2 = 0.999. The optical characteristics are given in Table 2.
| Concentration (µg/ml) | Mean absorbance |
|---|---|
| 10 | 0.378 |
| 20 | 0.67 |
| 30 | 0.97 |
| 40 | 1.269 |
| 50 | 1.644 |
| 60 | 1.947 |
| 70 | 2.32 |
| 80 | 2.581 |
| 90 | 2.937 |
Table 1: Linearity Table Of Candesartan
| Optical characters | Values |
|---|---|
| Absorbance Maxima | 254 nm |
| Beer’s Limit | 10-90 µg/ml |
| % R.S.D. | 1.467 |
| Regression equation (Y=mx+c) | 0.032X+0.022 |
| Slope (a) | 0.032 |
| Intercept (b) | 0.022 |
| Correlation coefficient | 0.999 |
| LOD (µg/ml) | 0.0413 |
| LOQ (µg/ml) | 0.1253 |
Table 2: Optical characteristics of Candesartan
For analysis of commercial formulations, 20 tablets were weighed and powdered and powder equivalent to 10 mg of candesartan were transferred into 100 ml volumetric flask and dissolved in methanol:water (9:1) to get 100 μg/ml concentration. Then the solution was sonicated for 15 min and filtered and further dilutions were made with methanol:water (9:1) to get the concentration (30 μg/ml) within the linearity range and measured the absorbance at 254 nm. The drug content in each tablet was found to be 7.98 mg against the label claimed 8 mg by using the standard graph.
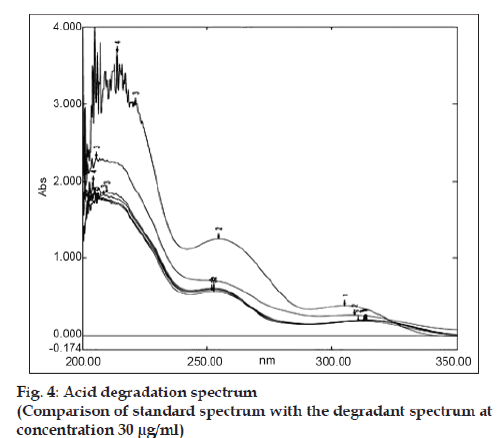
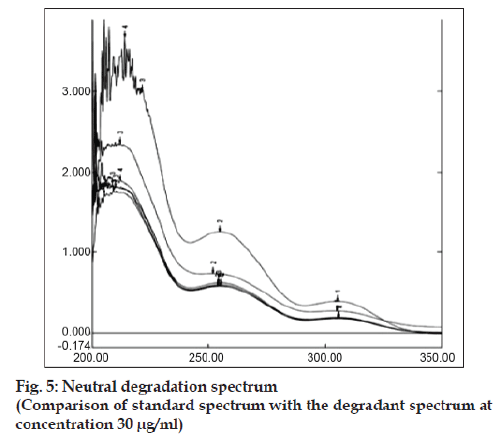
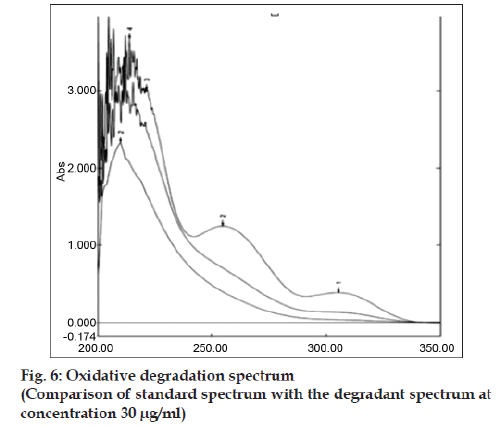
Accurately weighed 10 mg bulk drug was taken in 10 ml volumetric flask. Then the volume was made with 0.1 N NaOH and refluxed for 5 h at 60º. The absorbance was measured in every hour by withdrawing the required amount of sample from the reaction mixture to prepare 30 μg/ ml concentration and subjected for UV analysis. Similarly acidic and neutral degradation were performed and subjected to analysis keeping the condition same as earlier by taking 0.1 N HCl and distilled water as medium respectively. About 10 mg of bulk drug was weighed accurately, 2-3 drop of methanol:water (9:1) was added to make the drug soluble and finally the volume was made up to 10 ml by using 3% H2O2. The above solution mixture was kept in dark condition for 12 h. Each 6 h interval the specified amount sample was withdrawn and the required concentration was prepared and determined the absorbance. For photolytic degradation about 150 mg of bulk drug was accurately weighed and kept in the Petridish under direct sun light for three days. After each 6 h interval the required amount of sample was withdrawn to prepare the concentration of 30 μg/ ml by using solvent system and then absorbance was measured. A specific amount of bulk drug was taken in a cleaned Petridish and was put it in an oven at 60º for determining thermal degradation. The UV-degradation was performed by keeping the API in UV light and after each 8 h interval the sample was withdrawn and required concentration (30 μg/ml) was made for measuring absorbance in UV spectrophotometer. In all cases the extensive degradation were found but the magnitude of degradation was in the order of acidic>neutral> oxidative>thermal>alkaline>photolytic>UV. Candesartan was found to be highly sensitive to acidic, neutral and oxidative degradation condition as indicated in figs. 4 to 6. The summary of degradation is given in Table 3.
| Stress conditions | Time | % of assay of degraded product | % assay of active substance |
|---|---|---|---|
| Acidic hydrolysis (1 N HCl) | 5 h | 45.83 | 54.17 |
| Alkaline hydrolysis (1 N NaOH) | 5 h | 28.23 | 71.77 |
| Neutral hydrolysis | 5 h | 43.64 | 56.36 |
| Photolytic degradation | 12 h | 18.85 | 81.15 |
| U.V. degradation | 48 h | 12.08 | 87.92 |
| Thermal degradation | 12 h | 35.33 | 64.67 |
| Oxidative degradation (3% H2O2) | 6 h | 43.44 | 56.66 |
Table 3: Summary of stress degradation Results
The proposed method was simple, sensitive and reliable with good precision and accuracy. The method is specific while estimating the commercial formulation without interference of excipients and the other additives. Hence it can be used for routine analysis of candesartan in bulk and pharmaceutical formulations. The proposed method for stability study shows that there is appreciable degradation found in stress condition of candesartan. A new simple analytical method was developed to be applied for the evaluation of the stability of candesartan to quantify Candesartan and its degradation products in a solid premix dosage forms. In addition to demonstrate specificity, forced degradation study can be used to determine the degradation pathways and degradation product of the APIs that could form during storage and facilitate formulation, development, manufacturing and packaging.
References
- Blake PS. Cardiovascular drugs. Martindale, 33rd edition. London: Pharmaceutical Press; 2002. p. 853.
- Moffat C, Osselton M, Widdop B. Clark’s Analysis of Drugs and Poisons, 3rd ed. Mumbai: Pharmaceutical Press; 2004. p. 740.
- Singh H, Kapoor V. Cardiovascular agents. Medicinal and Pharmaceutical Chemistry,1st ed. Delhi: Vallabh Prakashan; 2001. p. 273-5.
- Tripathi KD. Antihypertensive Drugs. Essentials of Medical Pharmacology, 6th ed. New Delhi: Jaypee Brothers Medical Publishers; 2008. p. 539-43
- Rall A, Nies A. Cardiovascular drugs. The Pharmacological Basis of Therapeutics, 8th ed. New York: Pergamon Press; 1990. p. 846-9.
- Stenlake JB, Beckett AH. The Basis of Spectrophotometry. Practical pharmaceutical Chemistry, 4th edition, Part.2, New Delhi: CBS Publishers and Distributors; 2007. p. 255-7.
- Singh JK. Degradation study of cardiovascular drugs. Anal Chem 2009;10:40-1.
- Skoog DA, Hollar FJ, Crouch SR. An Introduction to Ultraviolet-Visible Molecular Absorption Spectrometry. In, Principles of Instrumental Analysis, 6th ed, Harayana: Thomson; 2007. p. 336-7.
- Carstensen T, Hong D, Shah M. Development and Validation of HPLC stability-indicating assays. Drug stability, 3rd ed. New York: Marel Dekker Inc; 2008. p. 364-6.
- Carstensen T, Hong D, Shah M. Regulatory Aspects of Stability Testing in Europe. Drug stability, 3rd ed. New York: Marel Dekker Inc; 2008. p. 594-6.
