- *Corresponding Author:
- Pooja A.Chawla
Department of Pharmaceutical Analysis, ISF College of Pharmacy, Moga, Punjab 142001, India
E-mail: pvchawla@gmail.com
| Date of Received | 29 November 2020 |
| Date of Revision | 06 April 2021 |
| Date of Acceptance | 01 November 2021 |
| Indian J Pharm Sci 2021;83(6):1208-1214 |
Abstract
Today people are focused on their health, as good health is a key to the happiness of our life. Medicine takes a big responsibility to take care of our health. Various supplements are available to meet the nutritional requirement. One such supplement is a combination of piperine and coenzyme Q10. The medicines have to be analyzed properly before introducing them to the market. As no analytical method is available for simultaneous estimation of the combination, hence an attempt was made to develop a validated method for the estimation of piperine and coenzyme Q10 simultaneously in bulk and its dosage form. A simple, precise, accurate and validated reversed phase high performance liquid chromatography technique was developed for the estimation of piperine and coenzyme Q10 in bulk and its tablet formulation. In this developed method, Waters X Bridge C18 column (250 mm×4.6 mm, 5 μm) was used as a stationary phase and acetonitrile, tetrahydrofuran and water was used in 65:32:3 (v/v) ratio as mobile phase with 1 ml/min flow rate. This isocratic separation was accomplished using Waters 2707 Autosampler high performance liquid chromatography system, Waters 515 solvent delivery system, with photodiode array detector detection at 275 nm. Chromatographic data was processed by Empower 2 software. The retention times of coenzyme Q10 and piperine were 4.56 and 8.19 min respectively. The linearity ranges have lied between 4-6 μg/ml, 240-360 μg/ml for piperine and coenzyme Q10 respectively with 0.997 as correlation coefficient for both.
Keywords
Piperine, coenzyme Q10, reversed phase high performance liquid chromatography, method validation, limit of detection, limit of quantitation
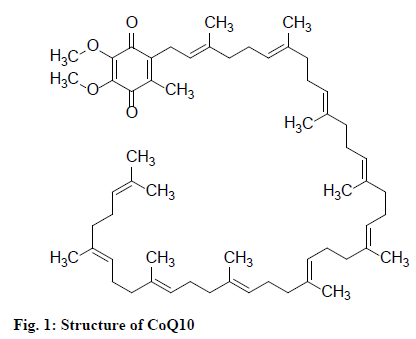
Coenzyme Q10 (CoQ10) is a vitamin like nutraceutical which was found out by Frederick Crane and his colleagues at the University of Wisconsin in 1957[1]. Chemically, it is a 2,3 dimethoxy-5 methyl-6 decaprenyl benzoquinone, having 10 isoprene units associated in the side chain and also known as ubiquinone or ubidecarenone[2] (fig. 1). It is chemically produced in the body and found in fish, meat, nut and various oils[3]. CoQ10 is very popular for its potent antioxidant property, has a vital role in Adenosine Triphosphate (ATP) productions through the electron transport chain in mitochondria, cardioprotective, nephroprotective and membrane stabilizer[4]. CoQ10 is a higher molecular weight (863.34 g/mol) highly lipophilic compounds which come under Biopharmaceutical Classification System (BCS) class II[5] (fig. 1), practically insoluble in water[6], dietary absorption of Q10 is very mild and confined[7]. CoQ10 has an outstanding safety profile, as proved by a large number of preclinical and clinical studies, in both adults and children[8-10]. For adults and pediatrics doses were up to 1200 mg/kg/d and 8 mg/ kg/d respectively. Several clinical trials have identified the use of CoQ10 as adjuvant care in cardiovascular, neurodegenerative disorders and myopathies of the mitochondria[11-13]. According to the National Cancer Institute (NCI) people having low CoQ10 levels in the blood, were associated with myeloma, lymphoma and cancers of breast, lung, prostate, pancreatic, colon, kidney, head and neck. However, the researchers proposed that CoQ10 stimulates the immune system and can also be beneficial in secondary cancer treatment.
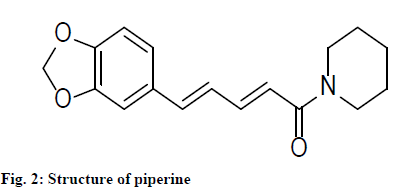
Piperine is part of a group of compounds known as "Vanilloids," because they are identified by the existence of a functional group depend on the structure of vanillin. Piperine is a natural substance present as the principal pungent component (1-9 %) in several portions of a plant which belong to the Piperaceae family[14]. Piperine, the most enormous alkaloid in pepper, was first identified by Hans Christian Ørsted from the pepper extract in 1819. It was collected as a crystalline yellow compound with a melting point between 128 and 130°. Piperine’s chemical structure was later known as piperoylpiperidine, with the chemical formula C17H19NO3 and with the International Union of Pure and Applied Chemistry (IUPAC) name 1-(5-[1,3-benzodioxol-5-yl]-1-oxo-2,4-pentadienyl) piperidine (fig. 2). Piperine was reported to be a weak base that breaks down to volatile basic piperine, known as piperidine (C5H11N) and piperic acid (C12H10O4) after acid or alkali hydrolysis[15]. Piperine is highly soluble in alcohol, ether and chloroform and slightly soluble in water[16]. Various studies proved that piperine has versatile beneficial activities such as immunomodulatory, anticarcinogenic, stimulatory, hepatoprotective, anti-inflammatory, antimicrobial and antiulcer activities[17-19]. It was also used for improving the circulation of blood, enhancement of the flow of saliva and provoking appetite[20]. Another main function of piperine is to enhance the bioavailability of various drugs, vitamins and nutraceuticals by increasing the absorption or decelerating the metabolism of the drugs[21-23]. Literature reveals that several methods such as Ultraviolet (UV), High Performance Liquid Chromatography (HPLC) are used for estimation of piperine and also HPLC methods are reported for CoQ10 but no single HPLC method is reported for simultaneous estimation of CoQ10 and piperine. Therefore, this study can describe a simple, rapid, precise, economical and accurate Reverse Phase High Performance Liquid Chromatography (RP-HPLC) method for the development and validation of CoQ10 and piperine in the combined pharmaceutical dosage form. Here Qubinor tablet (CoQ10/ubedicarenone and piperine) is used as a nutritional supplement that contains a high absorption form of CoQ10 available, ubidecarenone. CoQ10 helps the body’s cells in energy production and has antioxidant properties that protect the body’s cells from damage caused by oxidative stress and free radicals.
In the sight of useful pharmacological effects of CoQ10, the feasible role of piperine is for the enhancement of bioavailability.
Materials and Methods
Chemical reagents:
Piperine was obtained as generous gift sample from Unico Pharmaceuticals, Ludhiana India and CoQ10 from La-Pharma Ludhiana, India. Acetonitrile (ACN), methanol and Tetrahydrofuran (THF) (HPLC grade) was purchased from Rankem (New Delhi, India), HPLC grade water was collected from water purification systems Elix 03 (Millipore, USA) in our institutional water plant. 0.45 μm Millipore membrane filter and syringe filter were purchased from local market. The pharmaceutical dosage forms used in the study was Qubinor tablet containing 300 mg of CoQ10 and 5 mg of piperine. Tablets were purchased from online pharmacy named 1 mg.
Instrumentation:
The analysis was carried out on Waters (2707) autosampler HPLC system, Waters 515 solvent delivery system, with Photodiode Array (PDA) detector. Empower-2 software was used for chromatographic data processing. PCI analytics ultrabath sonicator was used for mixing and sonication purpose. Agilent Cary 630 Fourier-Transform Infrared (FTIR) spectrometer with Microlab software and Shimadzu-1700 UVSpectrophotometer with UV probe software had used for Active Pharmaceutical Ingredients (APIs) confirmation, Analytical Balance Mettler Toledo, AB204-S/FACT had used for weighing purpose.
Chromatographic conditions:
The mobile phase consisted of ACN, THF and HPLC water (65:32:3) was used in isocratic mode through Waters X Bridge C18 column (250 mm×4.6 mm, 5 μm) with flow rate of 1.0 ml/min and run time 20 min. Detection was done at 275 nm wavelength. Column temperature was set at 40°. Mobile phase was filtered through 0.45 μm Millipore filter paper and degassing by sonication before running into the system.
Preparation of standard solutions:
Standard stock solutions of CoQ10 and piperine were prepared as 1000 ppm concentration by taking 10 mg of both in 10 ml volumetric flask individually. Mobile phase was used as a diluent, before the final make up solution had sonicated. From this 1000 ppm, both standard and stock, 300 ppm and 5 ppm (as per label claim) target concentration was prepared for CoQ10 and piperine respectively. Then for further validation study, mixed the two target concentrations as equal amount and continued the study as per International Council for Harmonisation (ICH) Q2(R1). The CoQ10 solution was kept in amber coloured volumetric flask due to its light sensitivity.
Preparation of sample solution:
20 tablets were crushed and as per label claim calculated 10 mg equivalent weight was taken in a 10 ml volumetric flask to make upto 1000 ppm as test stock and then prepared the test concentrations of 300 ppm and 5 ppm for the estimation of CoQ10 and piperine, respectively. Mobile phase was used as a diluent. All the test solutions were kept in amber colored volumetric flask.
Results and Discussion
Various trials were used by changing the composition of the mobile phase to develop a sensitive HPLC method to estimate piperine and CoQ10 simultaneously. The developed method was appropriate with good linearity, precision and accuracy.
According to the United States Pharmacopeia (USP) guideline, the system suitability test was fulfilled by studying few parameters like theoretical plate, retention time, peak area, capacity factor, asymmetry factor, etc. Five duplicates of standard stock solution of drug piperine and CoQ10 were taken and analysis was performed at the optimized chromatographic conditions. The results are discussed in Table 1.
| Sr. No. | Parameters | USP limit | CoQ10 | Piperine |
|---|---|---|---|---|
| 1 | Concentration (%) | - | 100 % | 100 |
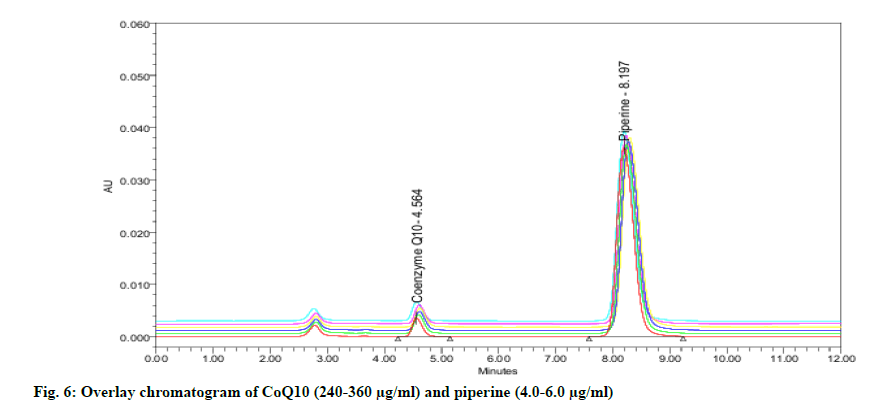
| 2 | Retention time (min) | - | 4.56 | 8.19 |
| 3 | Average peak area | - | 42410.5 | 622697.3 |
| 4 | % RSD of peak area | £2.0 | 0.904 | 0.773 |
| 5 | Peak asymmetry | £1.5 | 0.786 | 0.647 |
| 6 | Mean no. of theoretical Plate | =2000 | 3500 | 5500 |
| 7 | Final retention time (min) | - | 4.606 | 8.280 |
Table 1: System Suitability Parameters
The developed RP-HPLC method was validated according to ICH guideline parameters[24-26].
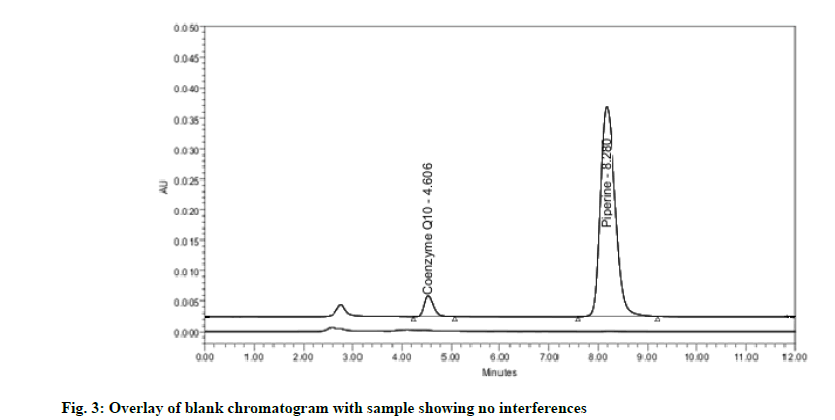
Specificity may be explained as the power of an analytical method to accurately distinguish the analyte in the presence of another potential sample mixture. The specificity is assessed by injecting the blank and sample solution. The entire identification followed by the separation of piperine and CoQ10 by the RP-HPLC technique was obtained with no interference (fig. 3) which corroborates the specificity of the developed method.
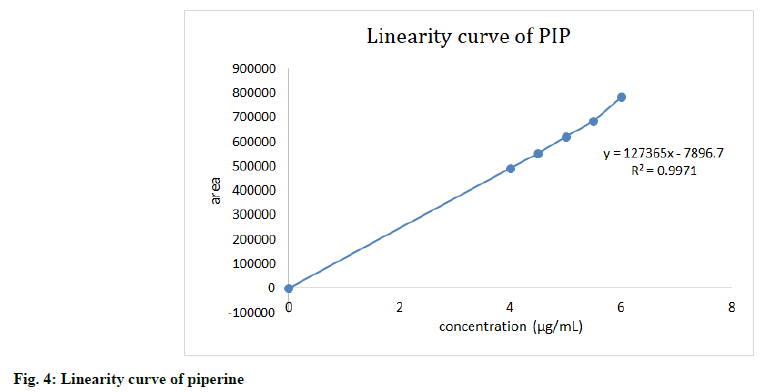
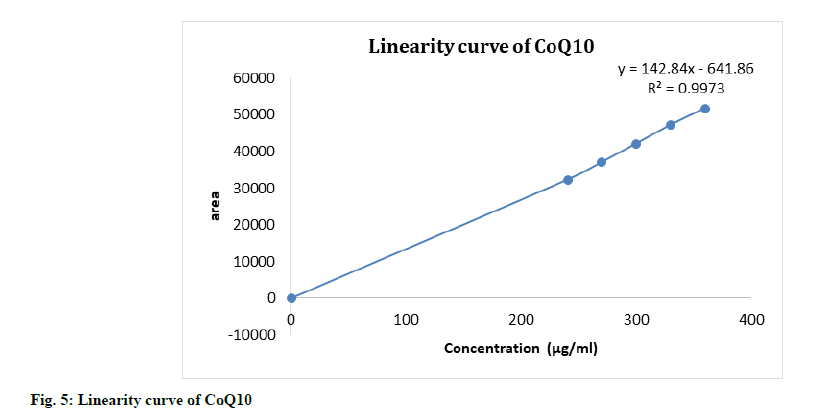
The linearity of the HPLC method was performed by preparing six concentrations of piperine and CoQ10 standard solution in methanol from their stock solution individually. The linearity was followed in the concentration range of 4-6 μg/ml for piperine and 240-360 μg/ml for CoQ10 with 0.997 as correlation coefficient for all (fig. 4-fig. 6). The results confirmed that the concentration range in which the standard curve of linearity was performed has good reproducibility as per Table 2.
| Piperine | CoQ10 | ||
|---|---|---|---|
| Concentration (µg/ml) | Peak area | Concentration (µg/ml) | Peak area |
| 4 | 492021 | 240 | 32221 |
| 4.5 | 553185 | 270 | 37075 |
| 5 | 621403 | 300 | 42095 |
| 5.5 | 687251 | 330 | 47252 |
| 6 | 782884 | 360 | 51768 |
Table 2: Linearity Results of Piperine and COQ10
The value of Limit of Detection (LOD) was found to 0.21 μg/ml and 2.79 μg/ml for piperine and CoQ10 respectively. Similarly, Limit of Quantitation (LOQ) was found to be 0.69 μg/ml and 9.32 μg/ml for piperine and CoQ10 respectively. Various factors as column type, detector sensitivity and pH are responsible for the value of LOD and LOQ. The results are shown in Table 3.
| Validation parameters | CoQ10 | Piperine |
|---|---|---|
| Detection wavelength (nm) | 275 | 275 |
| Linearity range (µg/ml) | 243-360 | 4-6 |
| Coefficient of determination (r2) | 0.997 | 0.9971 |
| Regression equation | y=142.84x-641.86 | y=127365x-7896.7 |
| Slope | 142.84 | 127365 |
| Intercept | -641.86 | -7896.7 |
| Limit of detection (µg/ml) | 2.79 | 0.21 |
| Limit of quantitation | 9.32 | 0.69 |
Table 3: Validation Parameters
The system precision study was accomplished by using a 100 % target concentration of test sample with 6 replicates. The calculated percentage Relative Standard Deviation (% RSD). of the area o f piperine and CoQ10, six replicates should not be more than 2 %. The % RSD for system precision was within the limit.
The precision of a method can be explained as the degree of closeness among the individual results of the standard solution of the target concentration. Six duplicates of 100 % of test concentration of piperine and CoQ10 were used for the intraday and interday precision study. The % RSD should be less than 1 % for API and 2 % for the drug product. The method has accomplished the limit of % RSD as per ICH guideline. The results are shown in Table 4.
| Precision | Piperine | CoQ10 |
|---|---|---|
| Intraday (n=6) (% RSD) | 0.91 | 0.97 |
| Interday (n=6) (% RSD) | 0.77 | 0.52 |
Note: Number of injections-6
Table 4: % Rsd In Method Precision
An accuracy study was performed by adding a known amount of standard solution into the test solution, called the spiking method. 80 %, 100 % and 120 % standard solution of target concentration was added to the 100 % test solution. According to ICH guidelines, the percent (%) recovery should be within 98-102 %. The followed formula for calculating % recovery is as follows:
% Recovery=Spiked concentration−Unspiked concentration/Known concentration added×100
The results are shown in Table 5.
| Drug | Level (%) | Unspiked | Spiked | Total | Amount recovered | % Recovery |
|---|---|---|---|---|---|---|
| Piperine | 80 | 5 | 4 | 9 | 8.98 | 99.77 |
| 100 | 5 | 5 | 10 | 10.04 | 100.40 | |
| 120 | 5 | 6 | 11 | 11.03 | 100.27 | |
| CoQ10 | 80 | 300 | 240 | 540 | 534.6 | 99 |
| 100 | 300 | 300 | 600 | 603.12 | 100.52 | |
| 120 | 300 | 360 | 660 | 657.82 | 99.67 |
Table 5: % Recovery Results of Piperine and Coq10
According to USP, robustness tests the capacity of an analytical process to remain uninfluenced by minor yet deliberate changes in parameters of the method. Robustness gives some sense of an analytical method’s reliability during daily use. The results achieved were not influenced by the variation in the conditions and were in parallel with the findings for previous conditions. The results are shown in Table 6.
| Drug | Concentration (µg/ml) | Changed flow rate (1.00 ml/min)±10 % | Changed composition of mobile phase (ACN:THF:Water) (65:32:3)±2 % | Changed wavelength (275 nm)±2 nm | |||
|---|---|---|---|---|---|---|---|
| 0.90 ml/min | 1.10 ml/min | 63:34:3 | 67:30:3 | 273 nm | 277 nm | ||
| Piperine (Area % RSD) | 5 | 0.67 | 0.58 | 0.67 | 0.54 | 0.65 | 0.51 |
| CoQ10 (Area % RSD) | 300 | 0.62 | 0.79 | 0.74 | 0.94 | 0.70 | 0.66 |
Note: Number of injections-2
Table 6: % Rsd of Piperine and Coq10 In The Study of Robustness
The assay can be defined as the test for checking the purity of the drug in a marketed formulation (Qubinor) called a percentage purity study (w/w). The estimated % purity of piperine and CoQ10 and was found to be 99.33 % and 100.31 % respectively. The results are shown in Table 7. Thus, procured piperine and CoQ10 were found to be in pure form.
| Drug | Label claim (mg/ml) | Amount found (mg) | % Estimation (mg/tab) |
|---|---|---|---|
| CoQ10 | 300 | 297.99 | 99.33 |
| Piperine | 5 | 5.01 | 100.31 |
Table 7: Assay Determination (% Purity W/W) of The Dosage Form (Qubinor) By Rp-Hplc
A rapid, precise and validated RP-HPLC method was developed for the estimation of piperine and CoQ10 simultaneously from a pharmaceutical fixed dosage combination named Qubinor. This HPLC method may also offer convenience for the selective determination of piperine and CoQ10. The developed method was validated as per ICH Q2(R1) guideline. This reported method is precise, accurate, linear, sensitive and specific on the parameters of validation. This method can be applied for the quality control assay and analytical purpose in pharmaceutical industries.
Acknowledgements:
The authors are thankful to the management of ISF College of Pharmacy, Moga for providing necessary infrastructure to carry out this research work.
Conflict of interests:
The authors declared no conflict of interest.
References
- FL C, RL L. Isolation of a quinone from beef heart mitochondria. Biochim Biophys Acta 1957;25(1):220-1.
- Wolf DE, Hoffman CH, Trenner NR, Arison BH, Shunk CH, Linn BO, et al. Coenzyme QI Structure studies on the coenzyme Q group. J Am Chem Soc 1958;80(17):4752.
- Pravst I, ?mitek K, ?mitek J. Coenzyme Q10 contents in foods and fortification strategies. Crit Rev Food Sci Nutr 2010;50(4):269-80.
- Muheem A, Shakeel F, Zafar S, Jahangir MA, Warsi MH, Jain GK, et al. Development and validation of stability indicating liquid chromatographic (RP-HPLC) method for estimation of ubidecarenone in bulk drug and formulations using quality by design (QBD) approach. Braz J Pharm Sci 2018;53.
- Tran MT, Mitchell TM, Kennedy DT, Giles JT. Role of coenzyme Q10 in chronic heart failure, angina, and hypertension. Pharmacotherapy 2001;21(7):797-806.
- Ondarroa M, Sharma SK, Quinn PJ. Solvation properties of ubiquinone-10 in solvents of different polarity. Biosci Rep 1986;6(9):783-96.
- Zhang Y, Åberg F, Appelkvist EL, Dallner G, Ernster L. Uptake of dietary coenzyme Q supplement is limited in rats. J Nutr 1995;125(3):446-53.
- Fu X, Ji R, Dam J. Acute, subacute toxicity and genotoxic effect of Bio-Quinone® Q10 in mice and rats. Regul Toxicol Pharmacol 2009;53(1):1-5.
- Miles MV, Patterson BJ, Schapiro MB, Hickey FJ, Chalfonte-Evans M, Horn PS, et al. Coenzyme Q10 absorption and tolerance in children with Down syndrome: A dose-ranging trial. Pediatr Neurol 2006;35(1):30-7.
- Shults CW, Beal MF, Song D, Fontaine D. Pilot trial of high dosages of coenzyme Q10 in patients with Parkinson’s disease. Exp Neurol 2004;188(2):491-4.
- Abdin AA, Hamouda HE. Mechanism of the neuroprotective role of coenzyme Q10 with or without L-dopa in rotenone-induced parkinsonism. Neuropharmacology 2008;55(8):1340-6.
- Haas RH. The evidence basis for coenzyme Q therapy in oxidative phosphorylation disease. Mitochondrion 2007;7:S136-45.
- Singh RB, Niaz MA, Kumar A, Sindberg CD, Moesgaard S, Littarru GP. Effect on absorption and oxidative stress of different oral Coenzyme Q10 dosages and intake strategy in healthy men. Biofactors 2005;25(1):219-24.
- Badmaev V, Majeed M, Prakash L. Piperine derived from black pepper increases the plasma levels of coenzyme Q10 following oral supplementation. J Nutr Biochem 2000;11(2):109-13.
- Govindarajan VS, Stahl WH. Pepper-chemistry, technology, and quality evaluation. Crit Rev Food Sci Nutr 1977;9(2):115-225.
- Upadhyay V, Sharma N, Joshi HM, Malik A, Mishra M, Singh BP, et al. Development and validation of rapid RP-HPLC method for estimation of piperine in Piper nigrum L. Int J Herb Med 2013;1(4):6-9.
- Darshan S, Doreswamy R. Patented antiin?ammatory plant drug development from traditional medicine. Phytother Res 2004;18(5):343-57.
- Yang YC, Lee SG, Lee HK, Kim MK, Lee SH, Lee HS. A piperidine amide extracted from Piper longum L. fruit shows activity against Aedes aegypti mosquito larvae. J Agric Food Chem 2002;50(13):3765-7.
- Bai YF, Xu H. Protective action of piperine against experimental gastric ulcer. Acta Pharmacol Sin 2000;21(4):357-9.
- Meghwal M, Goswami TK. Chemical composition, nutritional, medicinal and functional properties of black pepper: A review. Sci Rep 2012;1(2):1-5.
- Atal CK, Dubey RK, Singh J. Biochemical basis of enhanced drug bioavailability by piperine: evidence that piperine is a potent inhibitor of drug metabolism. J Pharmacol Exp Ther 1985;232(1):258-62.
- Majeed M, Badmaev V, Rajendran R, inventors; Sabinsa Corp, assignee. Use of piperine as a bioavailability enhancer. United States patent US 5,972,382; 1999.
- Patil UK, Singh A, Chakraborty AK. Role of piperine as a bioavailability enhancer. Int J Recent Adv Pharm Res 2011;4:16-23.
- ICH Harmonised Tripartite Guideline. Validation of Analytical Procedures: Text and Methodology Q2 (R1). International conference on harmonisation of technical requirements for registration of pharmaceuticals for human use. Geneva; 1994. p. 1-5.
- Shabir GA. Step-by-step analytical methods validation and protocol in the quality system compliance industry. J Valid Technol 2005;10:314-25.
- Walfish S. Analytical methods: A statistical perspective on the ICH Q2A and Q2B guidelines for validation of analytical methods. BioPharm Int 2006;19(12):1-6.
