- *Corresponding Author:
- Dongmei Gui
Department of Ophthalmology, Shengjing Hospital, China Medical University, Shenyang, Liaoning Province 110004, China
E-mail: guidongmei2004@163.com
| This article was originally published in a special issue,“Clinical Advancements in Life Sciences and Pharmaceutical Research” |
| Indian J Pharm Sci 2024:86(5) Spl Issue “102-117” |
This is an open access article distributed under the terms of the Creative Commons Attribution-NonCommercial-ShareAlike 3.0 License, which allows others to remix, tweak, and build upon the work non-commercially, as long as the author is credited and the new creations are licensed under the identical terms
Abstract
As a common neurodegenerative condition, glaucoma is manifested by increased intraocular pressure and gradual retinal ganglion cell degeneration, to ultimately result in irreversible blindness. Investigating crucial genes involved in mitophagy holds promise as potential diagnostic biomarkers for the condition and provides valuable insights for clinical decision-making and novel therapeutics for patients. Researchers utilized datasets from the gene expression omnibus to identify genes differentially expressed in relation to mitophagy. They employed least absolute shrinkage and selection operator regression to sift through these genes and pinpoint potential diagnostic markers. A glaucoma prediction model (nomogram) was then generated using multivariable logistic regression analyses, and then evaluated. To gain a deeper molecular understanding of glaucoma, molecular subtyping and enrichment, interaction network, and immune infiltration analyses were performed. We identified 15 mitophagy, from which Bcl-2 interacting protein 3, X-C motif chemokine ligand 12, fucosyltransferase 8, microtubule associated scaffold protein 1, phospho fructokinase, platelet, and reticulon 1 were selected and used to construct a glaucoma prediction model. The evaluation of the model involved calibration curves, receiver operating characteristic curves, and decision curve analysis analysis to ensure precision and stability. Based on this, a diagnostic diagram was constructed. The study revealed potential involvement of immune cells in glaucoma, with cathepsin K identified as a crucial immune regulatory factor. Significant differences in immune cell populations between glaucoma and normal groups were observed, and strong correlations were found between specific immune cell types and key genes. Our findings and predictive model provide valuable insights for future clinical investigations and research underpinning the molecular mechanisms in glaucoma.
Keywords
Mitophagy, glaucoma, prediction model, intraocular pressure, selection operator regression, logistic regression
Glaucoma represents several neurodegenerative conditions that may cause irreversible blindness, with elevated Intraocular Pressure (IOP) a significant factor in different glaucoma types. Primary glaucomatous damage is manifested in Retinal Ganglion Cells (RGCs), which are critical in maintaining normal vision[1]. A glaucoma diagnosis is often delayed due to early asymptomatic stages and relatively late symptom onset, which cause irreversible damage to the eyes and exemplifies the limitations of current glaucoma diagnostics[2].
Mitophagy or selective autophagy helps maintain mitochondrial quality by removing damaged mitochondrial organelles, and has vital roles in homeostasis[3]. The mitochondria produce Reactive Oxygen Species (ROS), which if aberrantly expressed, can affect cell integrity. The mitochondria also act as energy factories, are crucial for neuronal function, and when dysfunctional, are closely linked to neurodegenerative diseases. Mitophagic processes remove defective mitochondria and are potential strategies in diagnosing and treating neurodegenerative diseases; however, impaired mitophagy is associated with glaucoma[4-6]. Mitophagy also limits apoptosis, reduces dysfunctional mitochondrial accumulation and oxidative stress, and facilitates cellular metabolic adaptation from oxidative phosphorylation to glycolysis in response to reported hypoxia during glaucoma[7,8]. Thus, comprehensively analyzing key genes underpinning mitochondrial autophagy could provide diagnostic biomarkers for glaucoma, guide clinical decision-making, and provide additional treatment options for patients.
In this study, Gene Expression Omnibus (GEO) datasets related to glaucoma were thoroughly examined. Differential analyses were employed to identify genes differentially expressed in relation to Mitophagy Related Differentially Expressed Genes (MRDEGs) in glaucoma. Advanced machine learning techniques, such as Least Absolute Shrinkage and Selection Operator (LASSO) regression, were applied to pinpoint potential diagnostic markers. Subsequently, a prediction model was established using multivariable logistic regression and depicted in a nomogram. The performance of this model was assessed using calibration curves, Receiver Operating Characteristic (ROC) analysis, and Decision Curve Analysis (DCA). Furthermore, the study encompassed molecular subtyping, enrichment analysis, interaction network analysis, and evaluation of immune infiltration patterns.
Materials and Methods
Data collection:
From the GEO database, we obtained patient transcriptome data from three Homo sapiens glaucoma-related datasets (GSE9944, GSE2378, and GSE45570) using the GEOquery package. GSE9944 (GPL8300 data platform) contained 19 human optic nerve head astrocyte samples (13 glaucoma and six normal samples). GSE2378 (GPL8300 data platform) contained 13 human optic nerve head astrocyte samples; three samples with no clear groupings were excluded, while seven glaucoma and three normal samples were selected. GSE45570 (GPL5175 data platform) contained 18 optic nerve head samples; six ocular hypertension samples were excluded, while six glaucoma and six normal samples were selected (Table 1).
| Group | GSE9944 | GSE2378 | GSE45570 |
|---|---|---|---|
| Platform | GPL8300 | GPL8300 | GPL5175 |
| Species | Homo sapiens | Homo sapiens | Homo sapiens |
| Tissue | Human optic nerve head astrocytes | Human optic nerve head astrocytes | Human optic nerve head |
| Samples in normal | 6 | 3 | 6 |
| Samples in glaucoma | 13 | 7 | 6 |
| Reference | PMID: 18613964 | PMID: 11921203 |
Table 1: Geo Dataset List
Using the keyword mitophagy in MSigDB, four sets of mitophagy-related gene sets were retrieved. After deduplication, 34 unique Mitophagy-Related Genes (MRGs) were identified, including those involved in positive regulation in response to mitochondrial depolarization and various mitophagy mechanisms from REACTOME pathways[9]. We downloaded 29 MRGs from Pathcards and 2377 from GeneCards using mitophagy as the search term and kept only protein coding MRGs[10]. All MRGs were then assembled and combined to generate 2377 MRGs.
MRDEGs:
To identify DEGs associated with glaucoma and normal datasets, we performed batch corrections on datasets (sva in R)[11], which generated a merged dataset containing 26 glaucoma and 15 normal samples.
Subsequently, differential analyses using limma in R were conducted on the combined dataset to investigate expression profiles. Genes meeting the criteria of logFC>0.5 and p<0.05 are defined as DEGs. Specifically, genes with logFC>0.5 and p<0.05 are classified as upregulated DEGs, while genes with logFC<-0.5 and p<0.05 are classified as downregulated DEGs.
To identify DEGs linked to glaucoma, differential analyses were conducted on the merged dataset and all DEGs meeting logFC>0.5 and p<0.05 criteria were selected. These DEGs were then intersected with MRGs and the intersection visualized (Venn diagram) to generate a set of MRDEGs. We next created a volcano plot displaying differential analysis results (ggplot2 in R) and a heatmap showing MRDEG expression patterns (pheatmap in R). Furthermore, we generated grouped comparison MRDEG plots between glaucoma and normal groups, and also MRDEG chromosomal localization plots.
MRDEG differences between glaucoma and normal groups:
To investigate MRDEG differences between glaucoma and normal groups, we first performed LASSO regression analyses based on MRDEGs using parameters seeds 2022 and binomial family (glmnet in R) and ran it for 1000 cycles (prevented overfitting) [12,13]. The prognostic models are constructed using Lasso regression, a method derived from linear regression that includes a penalty term (lambda multiplied by the absolute value of the slope). This regularization technique helps prevent overfitting of the model, thereby enhancing its ability to generalize to new data. ROC curves were generated from the Lasso models to assess their diagnostic efficacy in identifying glaucoma.
After identifying MRDEGs, both univariate and multivariate logistic regression analyses were conducted. Calibration curves were then plotted to illustrate the consistency between predicted and observed probabilities generated by the multivariate model across different scenarios[14]. Additionally, diagnostic assessments of the logistic model included DCA and ROC analyses to evaluate its accuracy.
Molecular subtyping analysis:
Consensus clustering distinguishes samples into subtypes based on different omics datasets, and facilitates new disease subtype discovery or comparative subtype analyses. To explore potential disease subtypes associated with MRDEG expression in the merged dataset (containing glaucoma samples), we performed clustering analyses (ConsensusClusterPlus in R)[15]. The analysis was configured with specific parameters; 100 repetitions (reps=100), resampling of samples at an 80 % proportion (pItem=0.8), resampling of features at 100 % proportion (pFeature=1), and employing the Partition Around Medoids (PAM) clustering algorithm. Our findings were visualized using heatmaps, a Cumulative Distribution Function (CDF) plot, and a delta area plot to illustrate the clustering results effectively. We also constructed subgroup comparison plots and performed ROC validation analyses for MRDEGs across different disease subtypes.
MRDEG interaction networks:
Protein-Protein Interaction (PPI) networks are generated using protein interactions and are characterized using the STRING database. Based on specific criteria (human organism and minimum interaction score of 0.150), we constructed a PPI network for MRDEGs and visualized it using Cytoscape software[16]. We also used the Maximal Clique Centrality (MCC) algorithm (cytoHubba plugin) to calculate scores. The top ten highest MCC-scoring genes were deemed hub genes and represented key network genes[17].
The ENCORI database offers visualization tools to investigate microRNA (miRNA) targets. The tool utilizes CLIP-seq and degradome sequencing data, focusing on the plant domain, to map various RNA interactions such as miRNA non-coding Ribonucleic Acid (ncRNA), miRNA messenger RNA (mRNA), and RBP-RNA interactions. The miR Database (DB) is used for predicting miRNA target genes and providing functional annotations[18]. We used both databases to predict miRNA and hub gene interactions. Specifically, we selected miRDB subset data (target score >80) and intersected these data with ENCORI mRNA-miRNA data to generate a mRNA-miRNA interaction network.
Utilizing DNA-binding protein ChIP-seq data, the CHIPBase database (V3.0) is employed to discover binding motif matrices and their corresponding binding sites. It also predicts associations between genes and Transcription Factors (TFs) in terms of transcriptional regulation. Additionally, the hTFtarget database is utilized to identify human TFs and explore their regulatory mechanisms[19]. Both databases were utilized in our study to investigate TFs that interact with hub genes.
Functional enrichment analyses:
GO analysis is crucial for studies on functional enrichment, encompassing Biological Processes (BPs), Molecular Functions (MFs) and Cellular Components (CCs). The Kyoto Encyclopedia of Genes and Genomes (KEGG) database serves as a comprehensive resource for genome data, biological pathways, disease information, and drug-related data. We performed Gene Ontology (GO) annotation analyses on hub genes (clusterProfiler in R)[20]. GO term filtering criteria were as follows; p<0.05 and a False Discovery Rate (FDR) <0.20. The Benjamini- Hochberg method was used for p-value corrections.
Gene Set Enrichment Analysis (GSEA):
GSEA is used to assess distribution trends in a predefined gene set in a ranked gene list, which are based on their associations with a phenotype, thus determining their contributions to that phenotype[21]. We first ranked DEGs in the merged dataset using logFC values and conducted GSEA on DEGs (clusterProfiler in R). GSEA analysis parameters: seed value 2020, 1000 permutations for assessing significance, gene sets containing 10-500 genes, Benjamini-Hochberg correction of p values. Gene set c2.cp.all.v2022.1.Hs.symbols.gmt from MSigDB was used, with significance determined by p<0.05 and FDR (q<0.25) criteria[9].
Immune cell subtypes:
Consensus clustering categorizes samples into distinct subtypes using various omics datasets, which aids in discovering new disease subtypes or conducting comparative analyses among existing subtypes[22]. We used ConsensusClusterPlus (R) for clustering analyses[15]. Using immune cell infiltration levels (single-sample GSEA, ssGSEA), glaucoma samples were allocated to groups to generate immune cell subtypes. Parameters were as follows; reps=100, pItem=0.8, pFeature=1, and clustering algorithm=PAM. From analyses, we generated clustering heatmaps, and also CDF and delta area plots. In addition, we generated comparative plots of immune cell groupings across various disease subtypes and correlation heatmaps depicting relationships between immune cells and hub genes. These heatmaps visually represented significant differences (p<0.05) in immune cell infiltration and highlighted correlations between immune cell populations across different disease subtypes.
Immune infiltration analyses:
CIBERSORT is a tool available in both R and as a web application, which utilizes linear support vector regression to deconvolve expression matrix data into human immune cell subtypes[23]. It evaluates immune cell infiltration in sequencing samples using predefined gene expression signatures for 22 immune cell subtypes. We used CIBERSORT to assess immune cell infiltration in the combined dataset. Initially, we compared the infiltration differences of immune cell subtypes between the glaucoma and normal groups, and plotted comparison graphs accordingly. Subsequently, we identified significant subtype differences (p<0.05) and created scatter plots to visualize any correlations observed. Additionally, a heatmap was constructed to explore associations between hub genes and immune cell populations.
Statistical analyses:
The study utilized R 4.2.0 for data analysis. For comparisons of continuous variables, normal distribution was assessed using t-tests, while nonnormal distribution was assessed using the Mann- Whitney U test. Comparisons involving multiple groups used the Kruskal-Wallis test. Categorical variables were compared using the Chi-square test or Fisher's exact test. Spearman analysis was used to examine correlations between molecules. Unless otherwise specified, p<0.05 (two-tailed) was considered statistically significant.
Results and Discussion
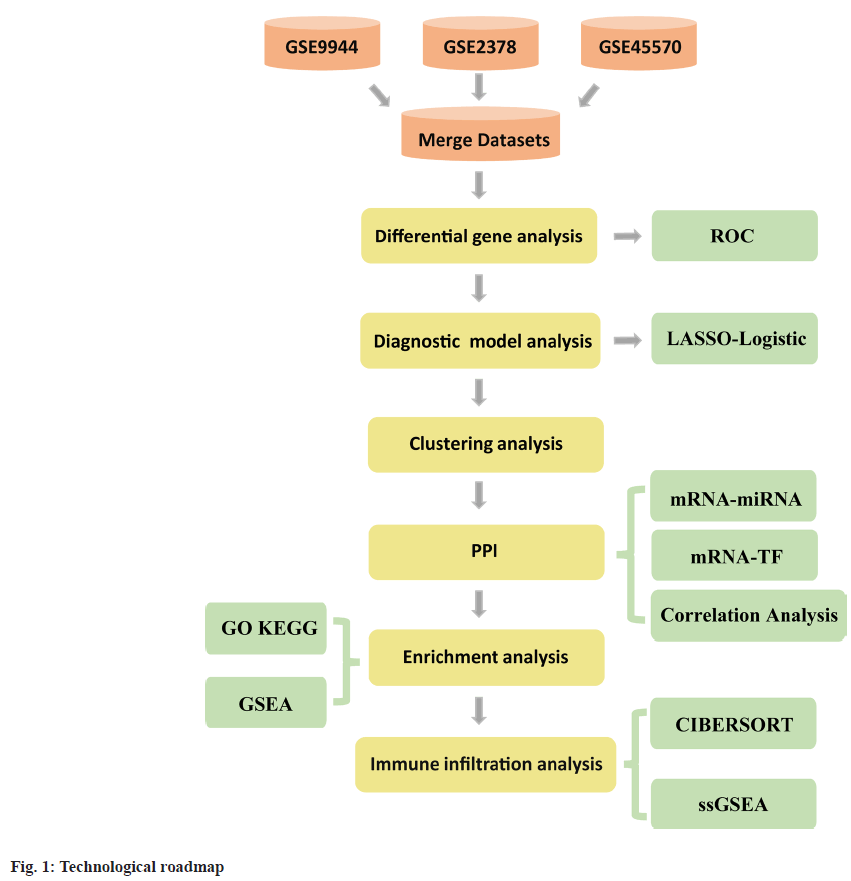
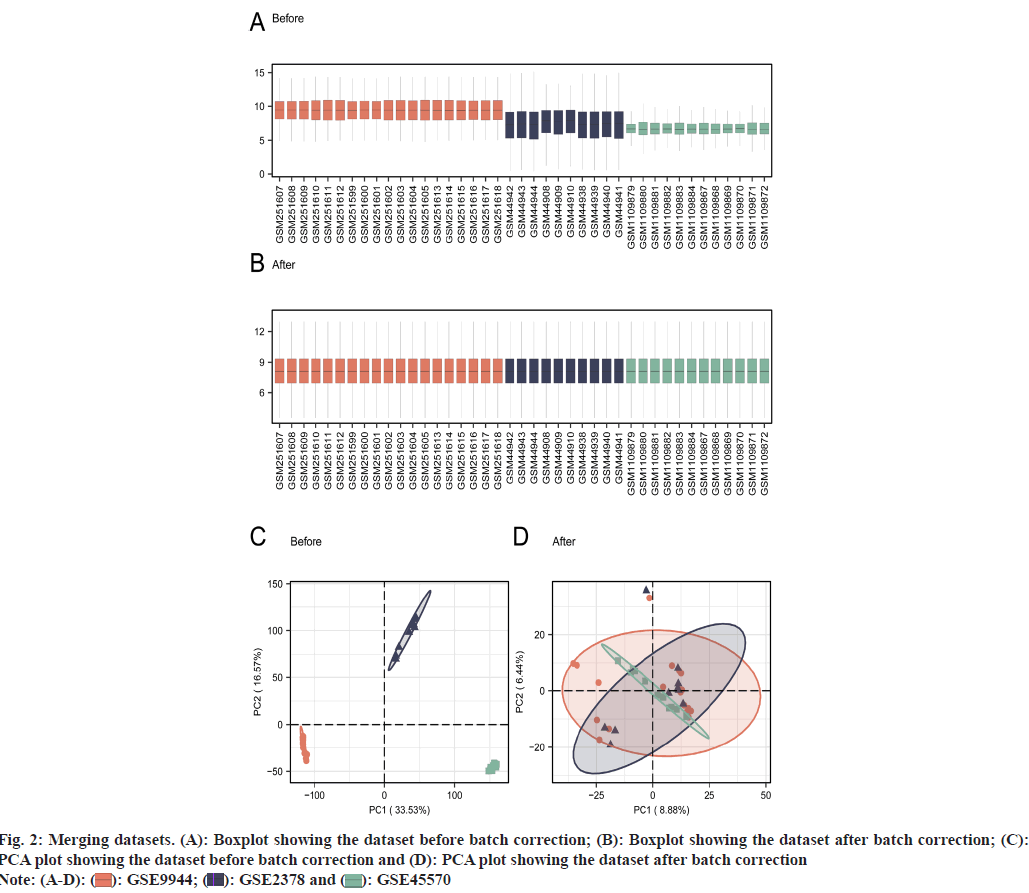
A bioinformatics summary is shown (fig. 1). We performed batch effect removal from glaucoma datasets (GSE9944, GSE2378, and GSE45570) to generate a merged GEO dataset, which underwent batch correction and normalization. Batch effect removal was assessed by examining boxplots of data distributions and Principal Component Analysis (PCA) plots for datasets both before and after batch correction (fig. 2A-fig. 2D). Distribution (fig. 2A and fig. 2B) and PCA (fig. 2C and fig. 2D) plot data indicated that batch effects were largely eliminated post processing.
Fig. 2: Merging datasets. (A): Boxplot showing the dataset before batch correction; (B): Boxplot showing the dataset after batch correction; (C): PCA plot showing the dataset before batch correction and (D): PCA plot showing the dataset after batch correction
Note: (A-D): ( ): GSE9944; (
 ): GSE2378 and (
 ): GSE45570
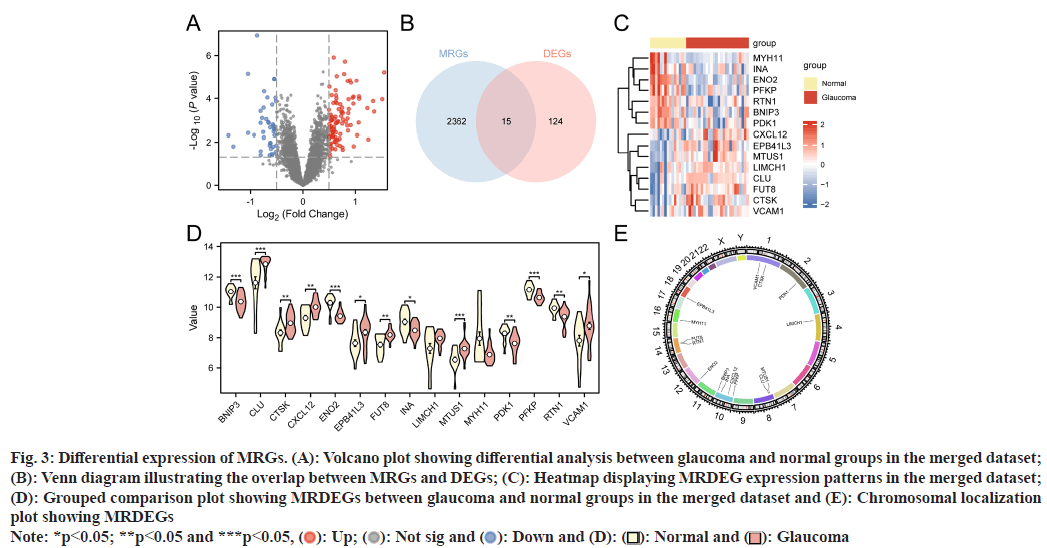
In our combined dataset, gene expression disparities between glaucoma and normal groups were analyzed using differential analyses (limma in R), revealing 139 genes meeting criteria of logFC>0.5 and p<0.05 for differential expression. Among these, 96 genes showed upregulation (logFC>0.5 and p<0.05), while 43 genes were downregulated (logFC<-0.5 and p<0.05). Subsequently, these findings were visualized in a volcano plot (fig. 3A). To pinpoint specific MRDEGs linked to glaucoma, we intersected the DEGs meeting logFC>0.5 and p<0.05 criteria with the previously identified MRGs (fig. 3B). After Venn diagram construction, 15 MRDEGs were identified; BCL2 Interacting Protein 3 (BNIP3), Fucosyltransferase 8 (FUT8), Vascular Cell Adhesion Molecule 1 (VCAM1), Erythrocyte Membrane Protein Band 4.1 Like 3 (EPB41L3), Reticulon 1 (RTN1), Cathepsin K (CTSK), Enolase 2 (ENO2), Pyruvate Dehydrogenase Kinase 1 (PDK1), Myosin Heavy Chain 11 (MYH11), Phosphofructokinase, Platelet (PFKP), Clusterin (CLU), Internexin Neuronal Intermediate Filament Protein Alpha (INA), LIM And Calponin Homology Domains 1 (LIMCH1), C-X-C Motif Chemokine Ligand 12 (CXCL12), and Microtubule Associated Scaffold Protein 1 (MTUS1). A MRDEG heatmap was also generated (fig. 3C) and showed expression patterns in glaucoma and normal groups. Grouped comparison (fig. 3D) and chromosomal location plots (fig. 3E) were also created. The former plot indicated significant (p<0.05) MRDEG expression differences between glaucoma and normal groups, while the latter showed that four MRDEGs (BNIP3, INA, CXCL12, and PFKP) were located on chromosome 10.
Fig. 3: Differential expression of MRGs. (A): Volcano plot showing differential analysis between glaucoma and normal groups in the merged dataset; (B): Venn diagram illustrating the overlap between MRGs and DEGs; (C): Heatmap displaying MRDEG expression patterns in the merged dataset; (D): Grouped comparison plot showing MRDEGs between glaucoma and normal groups in the merged dataset and (E): Chromosomal localization plot showing MRDEGs
Note: *p<0.05; **p<0.05 and ***p<0.05, (![]() ): Up; (
): Up; ( ): Not sig and (
 ): Down and (D): (
 ): Normal and (
 ): Glaucoma
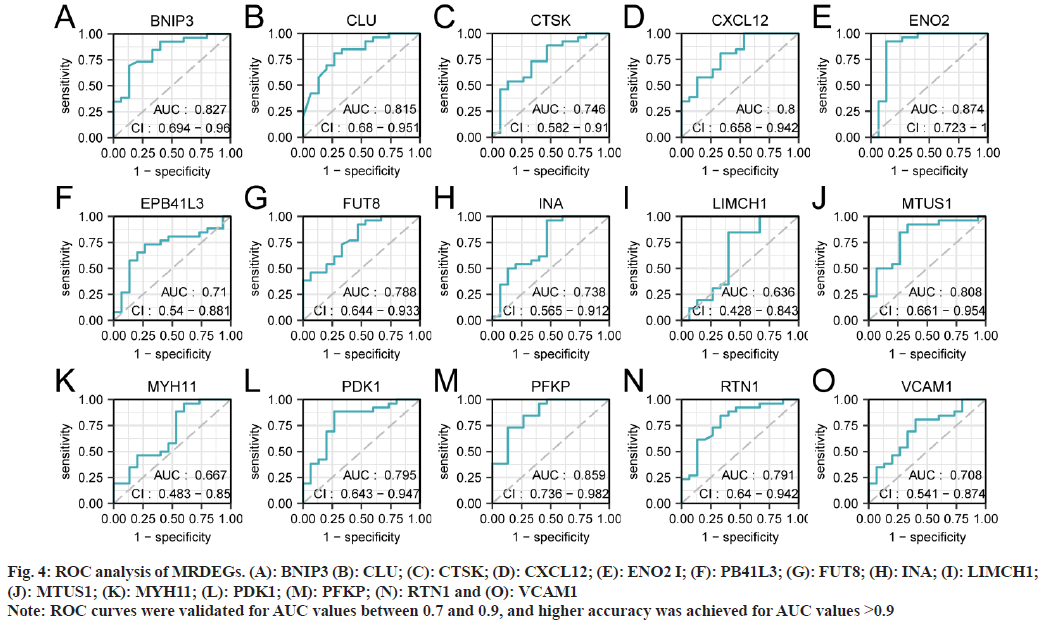
To validate the expression of the 15 MRDEGs in the merged dataset, we plotted their ROC curves for the glaucoma and normal groups (fig. 4A-fig. 4O). The results indicate that 13 genes including BNIP3 showed high accuracy in glaucoma development (Area Under the Curve (AUC) values ranging from 0.708 to 0.874), while LIMCH1 and MYH11 exhibited lower accuracy levels (with AUC values of 0.636 and 0.667, respectively).
Fig. 4: ROC analysis of MRDEGs. (A): BNIP3 (B): CLU; (C): CTSK; (D): CXCL12; (E): ENO2 I; (F): PB41L3; (G): FUT8; (H): INA; (I): LIMCH1; (J): MTUS1; (K): MYH11; (L): PDK1; (M): PFKP; (N): RTN1 and (O): VCAM1
Note: ROC curves were validated for AUC values between 0.7 and 0.9, and higher accuracy was achieved for AUC values >0.9
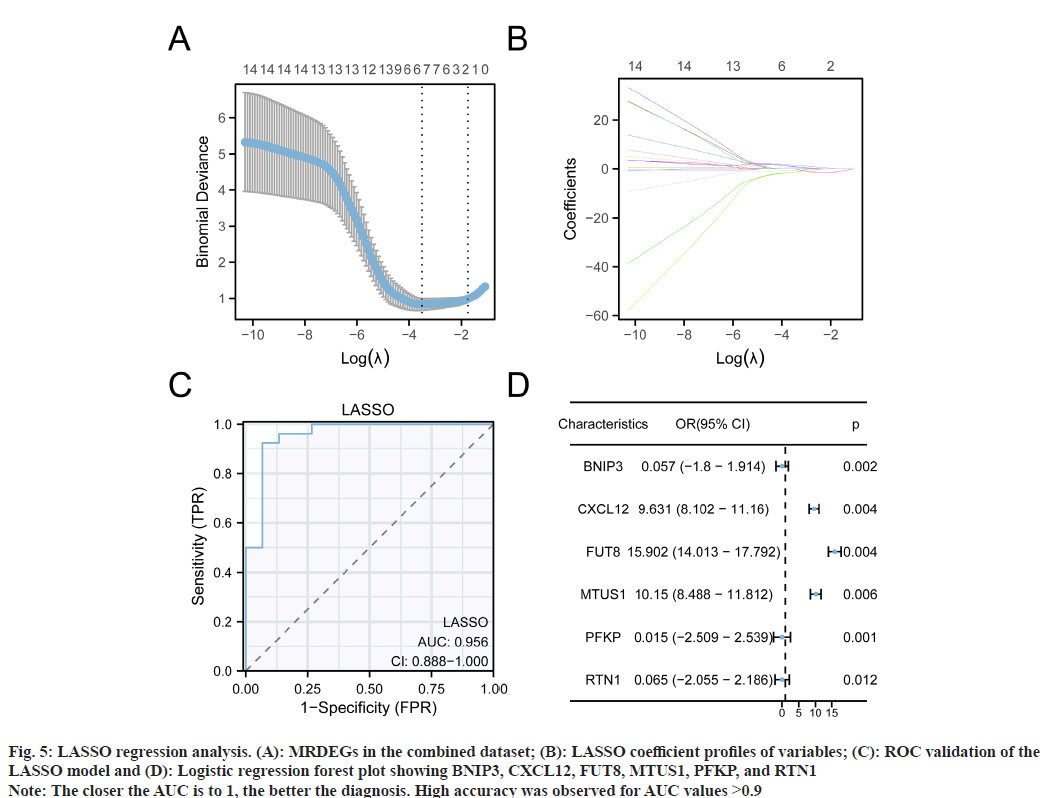
To explore MRDEG diagnostic roles in glaucoma, we performed Lasso regression analyses and constructed a MRDEG diagnostic model (fig. 5A and fig. 5B). As indicated, six genes (BNIP3, CXCL12, FUT8, MTUS1, PFKP, and RTN1) were included in the model after screening. We then plotted model ROC curves according to Lasso model scores with respect to glaucoma and normal groups (fig. 5C); our LASSO model showed high accuracy for glaucoma diagnosis. Finally, we plotted gene forest plots using logistic one-way regression analyses (fig. 5D), which showed significant (p<0.05) diagnostic effect for all six genes.
Fig. 5: LASSO regression analysis. (A): MRDEGs in the combined dataset; (B): LASSO coefficient profiles of variables; (C): ROC validation of the LASSO model and (D): Logistic regression forest plot showing BNIP3, CXCL12, FUT8, MTUS1, PFKP, and RTN1
Note: The closer the AUC is to 1, the better the diagnosis. High accuracy was observed for AUC values >0.9
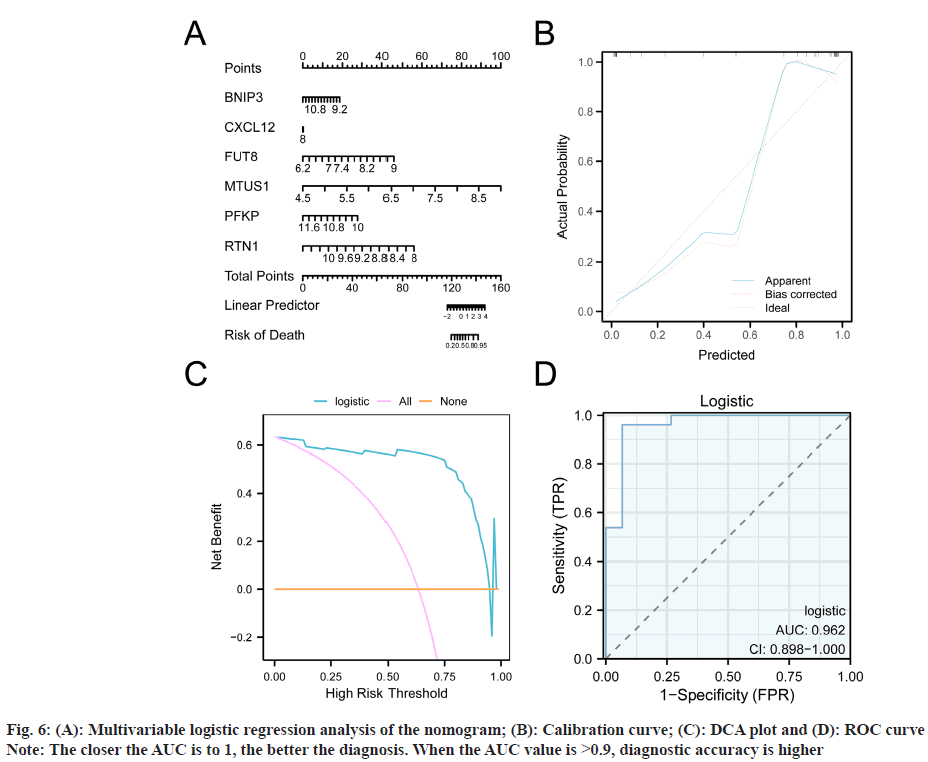
To examine the diagnostic effects of BNIP3, CXCL12, FUT8, MTUS1, PFKP, and RTN1 on glaucoma, we performed multivariable logistic regression analyses (fig. 6A-fig. 6C) and plotted a nomogram (fig. 6A), and also calibration (fig. 6B), DCA (fig. 6C), and ROC curves (fig. 6D). All plots showed that our six MRDEGs had high accuracy for glaucoma diagnosis.
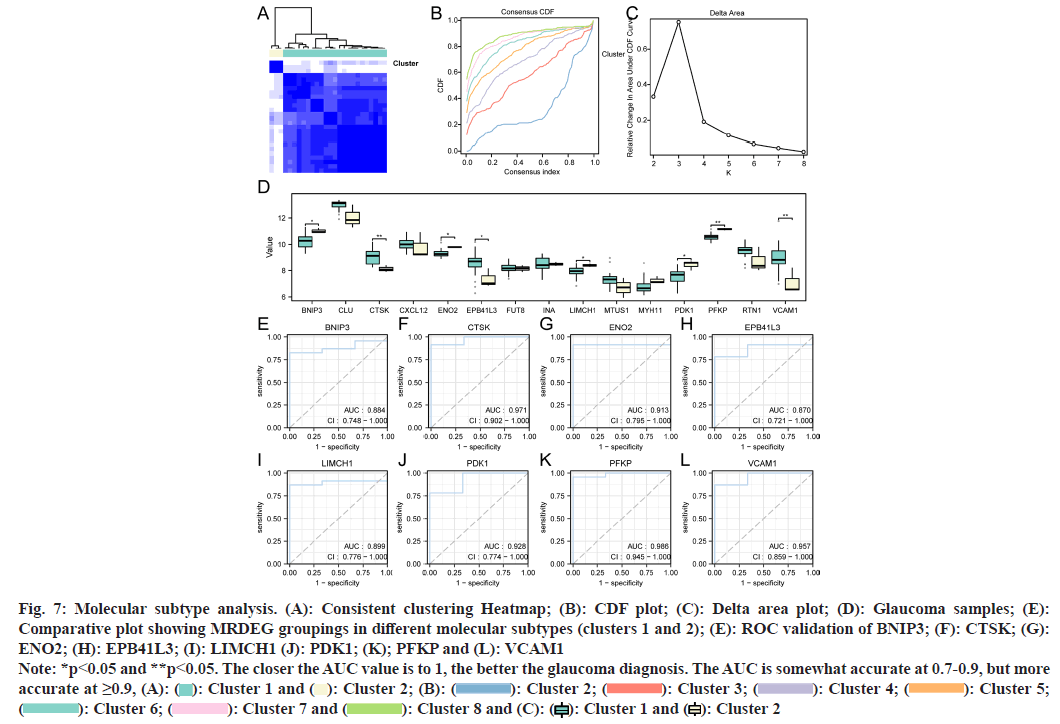
Based on the expression profiles of MRDEGs from the merged dataset, unsupervised consensus clustering was conducted on glaucoma samples, resulting in the classification into two subtypes (cluster 1: n=23; cluster 2: n=3, fig. 7A-fig. 7C). Additionally, we compared the expression patterns of MRDEGs across different molecular subtypes (clusters 1 and 2) using a grouped comparison plot (fig. 7D). We observed significant expression differences (p<0.05) for eight MRDEGs (BNIP3, CTSK, ENO2, EPB41L3, EPB41L3, PDK1, PFKP, and VCAM1) between different molecular subtypes. To validate the MRDEGs, ROC analyses were conducted (fig. 7E-fig. 7L), revealing that BNIP3 (AUC=0.884, fig. 7E), EPB41L3 (AUC=0.870, fig. 7H), and LIMCH1 (AUC=0.899, fig. 7I) displayed diagnostic accuracy in distinguishing between different molecular subtypes (clusters 1 and 2). Notably, CTSK (AUC=0.970, fig. 7F), ENO2 (AUC=0.913, fig. 7G), PDK1 (AUC=0.928, fig. 7J), PFKP (AUC=0.986, fig. 7K), and VCAM1 (AUC=0.957, fig. 7L) exhibited even higher accuracy in these analyses.
Fig. 7: Molecular subtype analysis. (A): Consistent clustering Heatmap; (B): CDF plot; (C): Delta area plot; (D): Glaucoma samples; (E): Comparative plot showing MRDEG groupings in different molecular subtypes (clusters 1 and 2); (E): ROC validation of BNIP3; (F): CTSK; (G): ENO2; (H): EPB41L3; (I): LIMCH1 (J): PDK1; (K); PFKP and (L): VCAM1
Note: *p<0.05 and **p<0.05. The closer the AUC value is to 1, the better the glaucoma diagnosis. The AUC is somewhat accurate at 0.7-0.9, but more accurate at ≥0.9, (A): ( ): Cluster 1 and (
 ): Cluster 2; (B): (
 ): Cluster 2; (
 ): Cluster 3; (
 ): Cluster 4; (
  ): Cluster 5; (
 ): Cluster 6; (
 ): Cluster 7 and (
 ): Cluster 8 and (C): (
 ): Cluster 1 and (
 ): Cluster 2
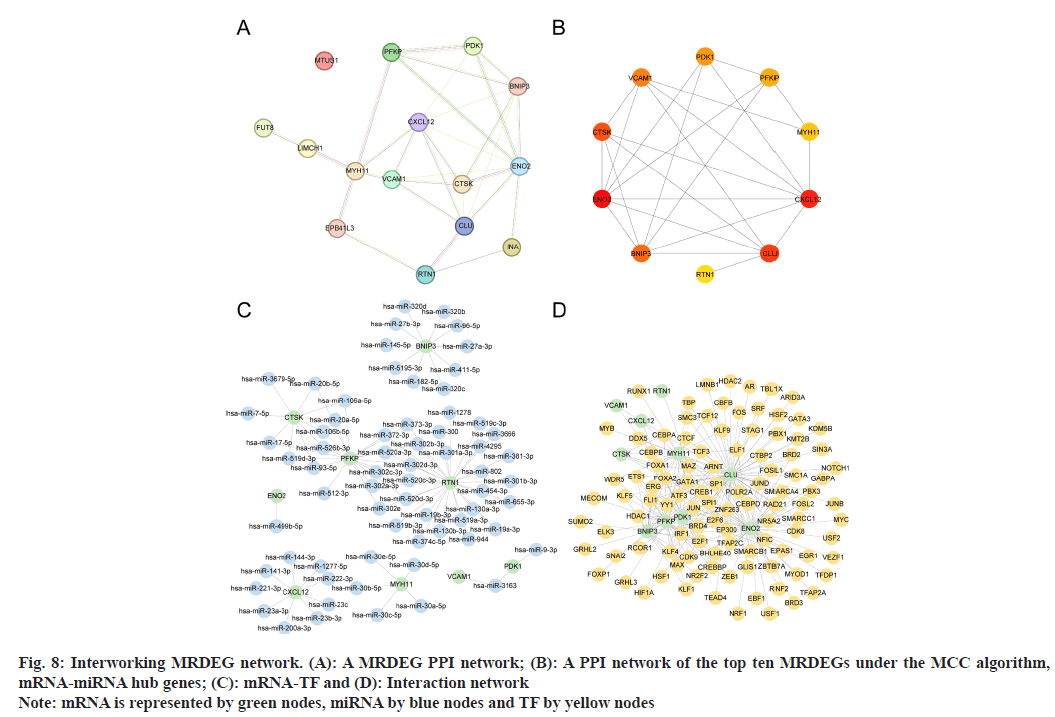
We conducted PPI analyses on the 15 MRDEGs (STRING database) and constructed a PPI network (fig. 8A). In total, 14 MRDEGs interacted with other genes. Then, using MCC MRDEG scores, we established another PPI network (fig. 8B) and identified the top ten high-MCC scoring hub genes (ENO2, PFKP, BNIP3, CXCL12, CLU, PDK1, RTN1, CTSK, MYH11, and VCAM1).
Following prediction of miRNA interactions with the ten identified hub genes (utilizing mRNA-miRNA data sourced from ENCORI and miRDB databases), we visualized the resulting mRNA-miRNA interaction network using Cytoscape (fig. 8C). This network included nine hub genes (ENO2, PFKP, BNIP3, CXCL12, PDK1, RTN1, CTSK, MYH11, and VCAM1) and encompassed 67 miRNAs, forming a total of 86 mRNA-miRNA interaction pairs.
Our next objective was to identify TFs interacting with the ten hub genes (ENO2, PFKP, BNIP3, CXCL12, CLU, PDK1, RTN1, CTSK, MYH11, and VCAM1) using data from the CHIPBase and hTFtarget databases. By intersecting interaction data from these databases with the hub genes, we pinpointed 104 TFs that were associated with these genes. Subsequently, we visualized this mRNATF interaction network using Cytoscape (fig. 8D). Notably, ENO2 exhibited the highest number of interactions among the hub genes, interacting with a total of 51 TFs.
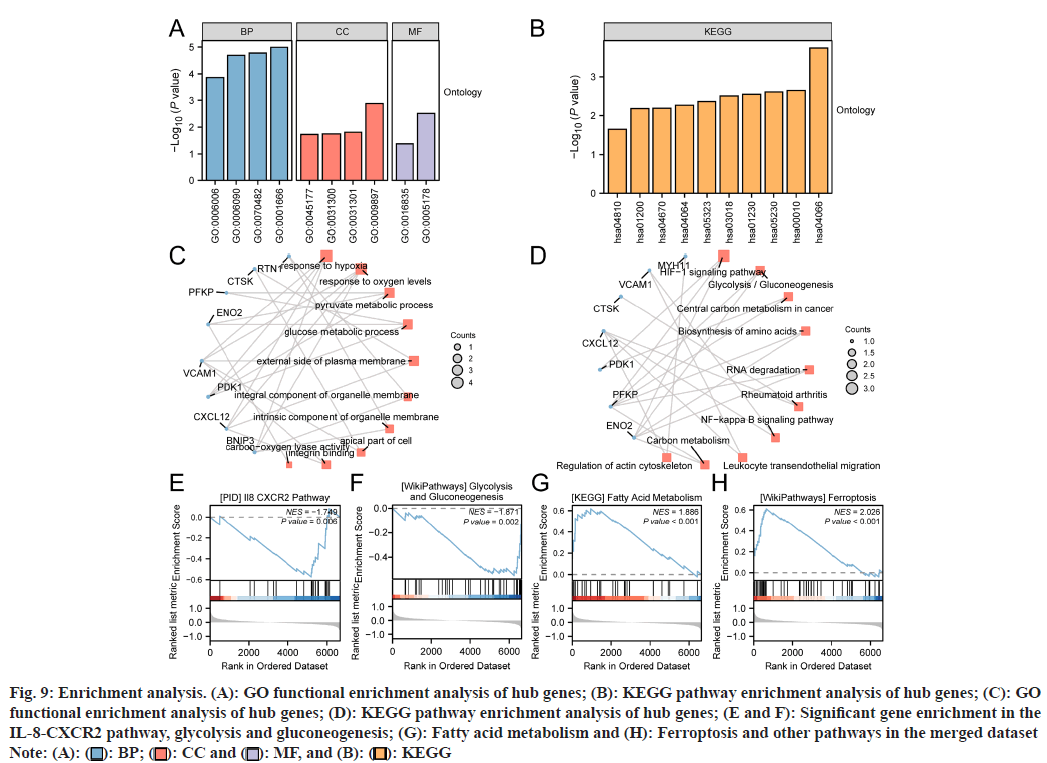
To analyze the BPs, MFs, CCs, and biological pathways associated with the ten hub genes, we performed GO and KEGG enrichment analyses. The results are presented in bar charts (fig. 9A and fig. 9B). The relationships between the hub genes and the enriched terms were visualized using circular network diagrams (fig. 9C and fig. 9D).
Fig. 9: Enrichment analysis. (A): GO functional enrichment analysis of hub genes; (B): KEGG pathway enrichment analysis of hub genes; (C): GO functional enrichment analysis of hub genes; (D): KEGG pathway enrichment analysis of hub genes; (E and F): Significant gene enrichment in the IL-8-CXCR2 pathway, glycolysis and gluconeogenesis; (G): Fatty acid metabolism and (H): Ferroptosis and other pathways in the merged dataset
Note: (A): ( ): BP; (
 ): CC and (
 ): MF, and (B): (
 ): KEGG
The hub genes were predominantly enriched in several BP, including responses to hypoxia and oxygen levels, pyruvate and glucose metabolic processes, among others. In terms of CCs, these hub genes are primarily enriched in locations such as the external side of the plasma membrane, integral components of organelle membranes, and apical cell parts. For MFs, the hub genes were associated with activities like integrin binding and carbon-oxygen lyase activity (Table 2).
| Ontology | ID | Description | Gene ratio | Bg ratio | p | q |
|---|---|---|---|---|---|---|
| BP | GO:0001666 | Response to hypoxia | 4/10 | 286/18800 | 1.02474E-05 | 0.000648621 |
| BP | GO:0070482 | Response to oxygen levels | 4/10 | 324/18800 | 1.67552E-05 | 0.000648621 |
| BP | GO:0006090 | Pyruvate metabolic process | 3/10 | 106/18800 | 2.0314E-05 | 0.000648621 |
| BP | GO:0006006 | Glucose metabolic process | 3/10 | 201/18800 | 0.000136703 | 0.002182458 |
| CC | GO:0009897 | External side of plasma membrane | 3/10 | 455/19594 | 0.001321788 | 0.039462419 |
| CC | GO:0031301 | Integral component of organelle membrane | 2/10 | 382/19594 | 0.01538208 | 0.039462419 |
| CC | GO:0031300 | Intrinsic component of organelle membrane | 2/10 | 412/19594 | 0.017750641 | 0.039462419 |
| CC | GO:0045177 | Apical part of cell | 2/10 | 424/19594 | 0.018739607 | 0.039462419 |
| MF | GO:0005178 | Integrin binding | 2/10 | 156/18410 | 0.003070423 | 0.04318891 |
| MF | GO:0016835 | Carbon-oxygen lyase activity | 1/10 | 79/18410 | 0.042102339 | 0.055740396 |
Table 2: Go Enrichment Analysis of Hub Genes
These hub genes significantly participate in various biological pathways, such as carbon metabolism, HIF-1 signaling pathway, central carbon metabolism in cancer, amino acid biosynthesis, glycolysis/ gluconeogenesis, RNA degradation, NF-κB signaling, leukocyte migration, rheumatoid arthritis, and regulation of the actin cytoskeleton (Table 3).
| Ontology | ID | Description | Gene ratio | Bg ratio | p | q |
|---|---|---|---|---|---|---|
| KEGG | hsa04066 | HIF-1 signaling pathway | 3/9 | 109/8164 | 0.000183439 | 0.00540662 |
| KEGG | hsa00010 | Glycolysis/gluconeogenesis | 2/9 | 67/8164 | 0.002301513 | 0.018775697 |
| KEGG | hsa05230 | Central carbon metabolism in cancer | 2/9 | 70/8164 | 0.002509549 | 0.018775697 |
| KEGG | hsa01230 | Biosynthesis of amino acids | 2/9 | 75/8164 | 0.002875398 | 0.018775697 |
| KEGG | hsa03018 | RNA degradation | 2/9 | 79/8164 | 0.003185163 | 0.018775697 |
| KEGG | hsa05323 | Rheumatoid arthritis | 2/9 | 93/8164 | 0.004387304 | 0.021551669 |
| KEGG | hsa04064 | NF-kappa B signaling pathway | 2/9 | 104/8164 | 0.005458336 | 0.021739348 |
| KEGG | hsa04670 | Leukocyte transendothelial migration | 2/9 | 114/8164 | 0.006526557 | 0.021739348 |
| KEGG | hsa01200 | Carbon metabolism | 2/9 | 115/8164 | 0.006638265 | 0.021739348 |
| KEGG | hsa04810 | Regulation of actin cytoskeleton | 2/9 | 218/8164 | 0.022579137 | 0.066549035 |
Table 3: KEGG Enrichment Analysis of Hub Genes
To evaluate the impact of gene expression levels on glaucoma, we employed GSEA to analyze the correlation between gene expression patterns in the combined dataset and glaucoma-related BPs, CCs, and MFs. Significant gene enrichment was identified in the IL-8-CXCR2 pathway (fig. 9E), glycolysis and gluconeogenesis (fig. 9F), fatty acid metabolism (fig. 9G), ferroptosis (fig. 9H), and other pathways (Table 4).
| ID | Set size | Enrichment score | NES | p | padjust | q |
|---|---|---|---|---|---|---|
| KEGG_VALINE_LEUCINE_AND_ISOLEUCINE_DEGRADATION | 33 | 0.71854 | 2.24912 | 2.9E-06 | 0.00612 | 0.00555 |
| WP_HAIR_FOLLICLE_DEVELOPMENT_CYTODIFFERENTIATION_PART_3_OF_3 | 57 | 0.5853 | 2.06201 | 1.6E-05 | 0.01712 | 0.01555 |
| REACTOME_CELL_JUNCTION_ORGANIZATION | 46 | -0.5696 | -2.0417 | 6.5E-05 | 0.02268 | 0.02059 |
| KEGG_HISTIDINE_METABOLISM | 14 | 0.80091 | 2.1017 | 9.3E-05 | 0.02468 | 0.02241 |
| PID_FOXM1_PATHWAY | 32 | 0.6572 | 2.03164 | 0.0001 | 0.02468 | 0.02241 |
| REACTOME_BASIGIN_INTERACTIONS | 17 | -0.7063 | -2.0066 | 0.00033 | 0.03674 | 0.03335 |
| WP_LEUCINE_ISOLEUCINE_AND_VALINE_METABOLISM | 15 | 0.75422 | 2.00689 | 0.0004 | 0.04023 | 0.03652 |
| WP_FERROPTOSIS | 45 | 0.61124 | 2.0264 | 4.1E-05 | 0.0186 | 0.01688 |
| KEGG_FATTY_ACID_METABOLISM | 29 | 0.61762 | 1.8857 | 0.00088 | 0.05409 | 0.04911 |
| WP_GLYCOLYSIS_AND_GLUCONEOGENESIS | 35 | -0.5493 | -1.871 | 0.00177 | 0.08215 | 0.07458 |
| PID_IL8_CXCR2_PATHWAY | 23 | -0.574 | -1.7492 | 0.00633 | 0.14732 | 0.13375 |
Table 4: GSEA of the Merged Datase
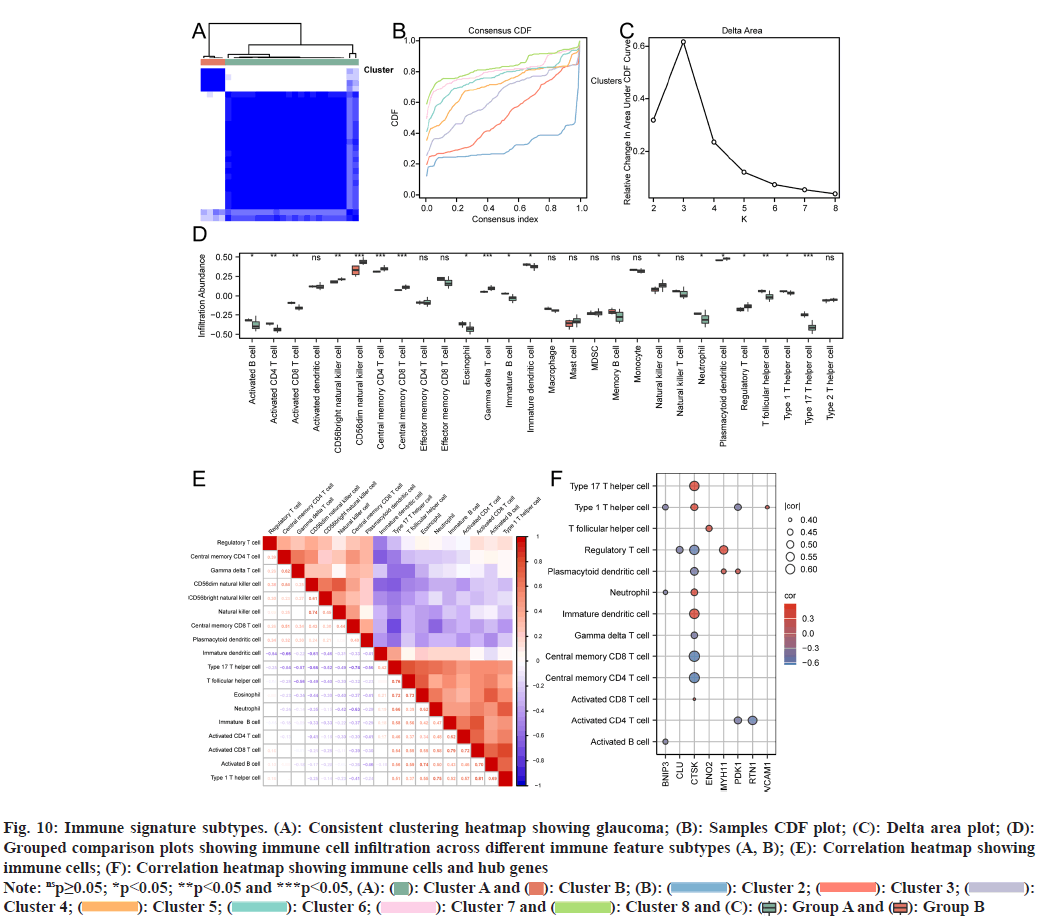
Using the ssGSEA algorithm to process the combined dataset, we evaluated the infiltration levels of 28 immune cell types and classified glaucoma samples into two subtypes, A (n=4) and B (n=22), through unsupervised consensus clustering (fig. 10A-fig. 10C). The grouped comparison plot revealed significant differences (p<0.05) in the infiltration of 18 immune cell types between subtypes A and B (fig. 10D). The heatmap further illuminated the associations between these immune cells and central genes, notably indicating that CTSK had a significant correlation with 10 immune cell types (p<0.05) (fig. 10A-fig. 10F).
Fig. 10: Immune signature subtypes. (A): Consistent clustering heatmap showing glaucoma; (B): Samples CDF plot; (C): Delta area plot; (D): Grouped comparison plots showing immune cell infiltration across different immune feature subtypes (A, B); (E): Correlation heatmap showing immune cells; (F): Correlation heatmap showing immune cells and hub genes
Note: nsp≥0.05; *p<0.05; **p<0.05 and ***p<0.05, (A): ( ): Cluster A and (
 ): Cluster B; (B): (
 ): Cluster 2; (
 ): Cluster 3; (
 ): Cluster 4; (
 ): Cluster 5; (
 ): Cluster 6; (
 ): Cluster 7 and (
 ): Cluster 8 and (C): (
 ): Group A and (
 ): Group B
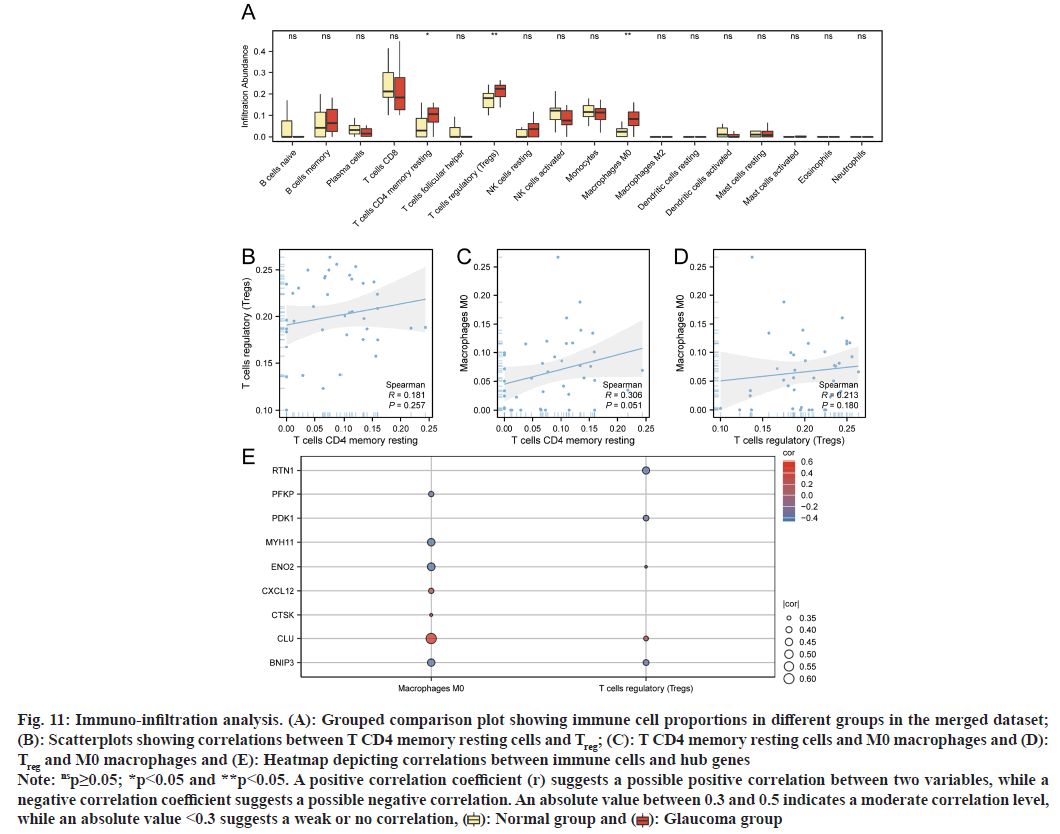
Using the CIBERSORT algorithm, we evaluated immune cell infiltration in the merged dataset. We excluded immune cell populations with a total infiltrating value=0 and generated a grouped comparison plot showing immune cell proportions between glaucoma and normal groups (fig. 11A). We identified significant infiltration level differences (p<0.05) between three immune cell types; T Cluster of Differentiation 4 (CD4) memory resting cells, Treg, and M0 macrophages. We also plotted correlation scatterplots between these cell types (fig. 11B-fig. 11D), which indicates moderate correlations between T CD4 memory resting cells and M0 macrophages. From Spearman’s correlation analyses, correlations were determined between immune cells and hub genes which identified significant correlations (p<0.05). M0 macrophages exhibited significant correlations (p<0.05) with seven hub genes (ENO2, PFKP, BNIP3, CXCL12, CLU, CTSK, and MYH11), while Treg showed significant correlations (p<0.05) with RTN1, RTN1, ENO2, CLU, and BNIP3 genes.
Fig. 11: Immuno-infiltration analysis. (A): Grouped comparison plot showing immune cell proportions in different groups in the merged dataset; (B): Scatterplots showing correlations between T CD4 memory resting cells and Treg; (C): T CD4 memory resting cells and M0 macrophages and (D): Treg and M0 macrophages and (E): Heatmap depicting correlations between immune cells and hub genes
Note: nsp≥0.05; *p<0.05 and **p<0.05. A positive correlation coefficient (r) suggests a possible positive correlation between two variables, while a negative correlation coefficient suggests a possible negative correlation. An absolute value between 0.3 and 0.5 indicates a moderate correlation level, while an absolute value <0.3 suggests a weak or no correlation, ( ): Normal group and (
 ): Glaucoma group
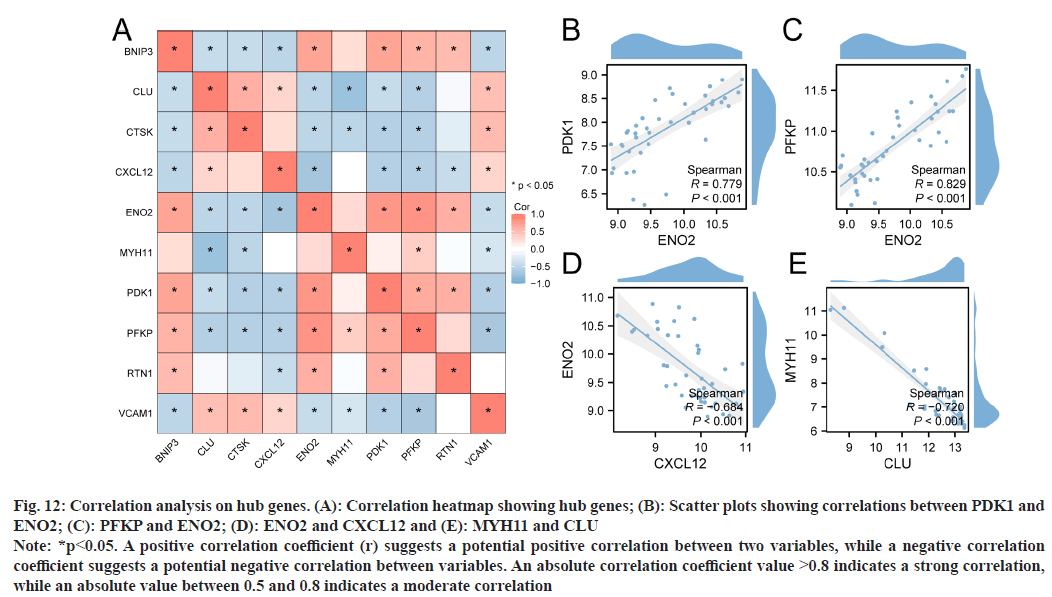
To explore correlations between hub genes (ENO2, PFKP, BNIP3, CXCL12, CLU, PDK1, RTN1, CTSK, MYH11, and VCAM1) in the merged dataset, Spearman’s algorithm was used, from which a correlation heatmap was generated (fig. 12A). We then selected hub gene combinations with the highest positive and negative correlations, and plotted scatter plots to show correlations (fig. 12B shows PDK1 and ENO2 with a moderate positive correlation, r=0.779; fig. 12C shows PFKP and ENO2 with a high positive correlation, r=0.829; fig. 12D shows ENO2 and CXCL12 with a moderate negative correlation, r=- 0.684; and fig. 12E shows MYH11 and CLU with a moderate negative correlation, r=-0.720).
Fig. 12: Correlation analysis on hub genes. (A): Correlation heatmap showing hub genes; (B): Scatter plots showing correlations between PDK1 and ENO2; (C): PFKP and ENO2; (D): ENO2 and CXCL12 and (E): MYH11 and CLU
Note: *p<0.05. A positive correlation coefficient (r) suggests a potential positive correlation between two variables, while a negative correlation coefficient suggests a potential negative correlation between variables. An absolute correlation coefficient value >0.8 indicates a strong correlation, while an absolute value between 0.5 and 0.8 indicates a moderate correlation
Glaucoma is a neurodegenerative condition that may cause irreversible vision loss[1]. Elevated IOP is also commonly linked to different glaucoma types[24]. For many years, glaucoma diagnostic and treatment approaches have been the focal point of considerable research outputs. The neurodegenerative changes in glaucoma involve complex interactions between multiple factors, including mitochondrial autophagy. Mitophagy has key roles maintaining mitochondrial homeostasis by eliminating impaired mitochondria. Disrupted mitophagy however leads to damaged mitochondria accumulation and may trigger inflammasome activation. Mitophagy also prevents apoptosis by reducing dysfunctional mitochondria and oxidative stress, and promoting the metabolic shift away from oxidative phosphorylation to glycolysis in response to hypoxia[7,8]. Therefore, mitophagy could form the basis of preventative and therapeutic strategies for glaucoma. Exploring such associations between mitophagy and glaucoma may help identify novel diagnostic biomarkers and potential treatment targets.
To expedite this, we merged three datasets (GSE9944, GSE2378 and GSE45570) and performed differential analysis on identified genes. DEGs were then combined with MRGs to finally identify 15 MRDEGs. ROC analyses showed that 13 genes showed possible diagnostic efficacy for glaucoma. In other analyses (Lasso regression and univariate logistic regression analyses), we then identified six genes that were closely associated with glaucoma. Finally, a predictive glaucoma diagnosis model was developed (multivariable regression analyses) that incorporated these six genes. The model showed good discrimination (ROC analysis). Our calibration curve also indicated good consistency between predicted and observed events in the prediction model. We also constructed a nomogram based on the glaucoma prediction diagnostic model. From molecular subtype analyses, eight MRDEGs exhibited significant expression differences across different molecular subtypes and showed good diagnostic performance.
In total, six MRDEGs (BNIP3, CXCL12, FUT8, MTUS1, PFKP, and RTN1) were included in the final glaucoma diagnostic model. Previous studies have reported BNIP3 and CXCL12 involvement in glaucoma progression; BNIP3-mediated neuroprotection, via direct ROS scavenging and Hypoxia Inducible Factor-1 (HIF-1) pathway targeting via Phosphatidylinositol-3-Kinase (PI3K)/ Protein Kinase B (AKT)/mammalian Target of Rapamycin (mTOR) pathways, was attributed to N-acetylcysteine. CXCL12 provided protection against apoptotic cell death in in vitro trabecular cells via CXCR4[25]. Critically, no previous studies have reported FUT8, MTUS1, PFKP, and RTN1 gene involvement in glaucoma. To the best of our knowledge, ours is the first study to identify their MRG roles in this context. Specifically, FUT8 and MTUS1 genes were upregulated, while PFKP and RTN1 were downregulated in our model.
Expression profile data from our merged dataset were analyzed to evaluate immune cell infiltration across 28 different cell types using the ssGSEA algorithm. Through unsupervised consensus clustering, we distinguished two distinct subtypes within glaucoma samples based on their patterns of immune cell infiltration. Significant disparities in the infiltration levels of 18 immune cell types were observed between these identified subtypes, denoted as subtypes A and B. Furthermore, CTSK showed significant correlations with ten immune cell types. These data provided key insights into immune cell involvement in glaucoma and highlighted CTSK as a key player in modulating immune responses.
To evaluate immune cell infiltration in the combined dataset, we used the CIBERSORT algorithm. Significant infiltration differences were observed in T CD4 memory resting cells, Treg, and M0 macrophages between glaucoma and normal groups. Previous research reported significant associations between glaucoma and the immune system, as immune strength is linked to resistance to RGC death. CD4+ T cells also contribute to RGC death under acute ischemia/reperfusion injury. Previous research also identified altered Treg to Th17 cell ratios in experimental autoimmune optic neuritis, a condition that shares significant similarities with glaucoma pathology. In other work, the potential therapeutic efficacy of adoptive Treg transfer has been reported when treating inflammatory disorders (e.g., enteritis and multiple sclerosis) indicating its potential as a viable therapeutic for managing glaucoma[26].
Importantly, our study had some limitations. Firstly, while a predictive model was successfully established and demonstrated good discrimination and calibration, it required validation. In future research, we will collect more data for validation purposes and seek external validation from different regions. Secondly, with ongoing sequencing technology development and continuous database updates, MRGs are still being updated, which necessitates continuous model updating. Finally, we did not validate DEG levels in animal models. In future studies, patient clinical data will be collected to improve model accuracy.
Finally, we developed a glaucoma prediction model based on differential analysis and machine learning methods, and identified six key MRGs. We constructed a nomogram based on the glaucoma prediction model to provide molecular insights for clinicians and their patients. Such model development provides a novel approach when diagnosing glaucoma and lays the foundation for further research in the field.
Conflict of interests:
The authors declared no conflict of interests.
References
- Tham YC, Li X, Wong TY, Quigley HA, Aung T, Cheng CY. Global prevalence of glaucoma and projections of glaucoma burden through 2040: a systematic review and meta-analysis. Ophthalmology 2014;121(11):2081-90.
[Crossref] [Google Scholar] [PubMed]
- Nickells RW, Howell GR, Soto I, John SW. Under pressure: cellular and molecular responses during glaucoma, a common neurodegeneration with axonopathy. Ann Rev Neurosci 2012;35(1):153-79.
[Crossref] [Google Scholar] [PubMed]
- Onishi M, Yamano K, Sato M, Matsuda N, Okamoto K. Molecular mechanisms and physiological functions of mitophagy. EMBO J 2021;40(3):e104705.
[Crossref] [Google Scholar] [PubMed]
- Dai Y, Hu X, Sun X. Overexpression of parkin protects retinal ganglion cells in experimental glaucoma. Cell Death Dis 2018;9(2):88.
[Crossref] [Google Scholar] [PubMed]
- Coughlin L, Morrison RS, Horner PJ, Inman DM. Mitochondrial morphology differences and mitophagy deficit in murine glaucomatous optic nerve. Invest Ophthalmol Vis Sci 2015;56(3):1437-46.
[Crossref] [Google Scholar] [PubMed]
- Kleesattel D, Crish SD, Inman DM. Decreased energy capacity and increased autophagic activity in optic nerve axons with defective anterograde transport. Invest Ophthalmol Vis Sci 2015;56(13):8215-27.
[Crossref] [Google Scholar] [PubMed]
- Liu L, Feng D, Chen G, Chen M, Zheng Q, Song P, et al. Mitochondrial outer-membrane protein FUNDC1 mediates hypoxia-induced mitophagy in mammalian cells. Nat Cell Biol 2012;14(2):177-85.
[Crossref] [Google Scholar] [PubMed]
- Jassim AH, Inman DM. Evidence of hypoxic glial cells in a model of ocular hypertension. Invest Ophthalmol Vis Sci 2019;60(1):1-5.
[Crossref] [Google Scholar] [PubMed]
- Liberzon A, Birger C, Thorvaldsdóttir H, Ghandi M, Mesirov JP, Tamayo P. The molecular signatures database hallmark gene set collection. Cell Syst 2015;1(6):417-25.
[Crossref] [Google Scholar] [PubMed]
- Stelzer G, Rosen N, Plaschkes I, Zimmerman S, Twik M, Fishilevich S, et al. The GeneCards suite: From gene data mining to disease genome sequence analyses. Curr Protoc Bioinformatics 2016;54(1):1-30.
[Crossref] [Google Scholar] [PubMed]
- Leek JT, Johnson WE, Parker HS, Jaffe AE, Storey JD. The sva package for removing batch effects and other unwanted variation in high-throughput experiments. Bioinformatics 2012;28(6):882-3.
[Crossref] [Google Scholar] [PubMed]
- Cai W, van der Laan M. Nonparametric bootstrap inference for the targeted highly adaptive Least Absolute Shrinkage and Selection Operator (LASSO) estimator. Int J Biostat 2020;16(2).
[Crossref] [Google Scholar] [PubMed]
- Engebretsen S, Bohlin J. Statistical predictions with glmnet. Clin Epigenetics 2019;11(1):123.
[Crossref] [Google Scholar] [PubMed]
- Perkins NJ, Weck J, Mumford SL, Sjaarda LA, Mitchell EM, Pollack AZ, et al. Combining biomarker calibration data to reduce measurement error. Epidemiology 2019;30:S3-9.
[Crossref] [Google Scholar] [PubMed]
- Wilkerson MD, Hayes DN. ConsensusClusterPlus: A class discovery tool with confidence assessments and item tracking. Bioinformatics 2010;26(12):1572-3.
[Crossref] [Google Scholar] [PubMed]
- Shannon P, Markiel A, Ozier O, Baliga NS, Wang JT, Ramage D, et al. Cytoscape: A software environment for integrated models of biomolecular interaction networks. Genome Res 2003;13(11):2498-504.
[Crossref] [Google Scholar] [PubMed]
- Chin CH, Chen SH, Wu HH, Ho CW, Ko MT, Lin CY. CytoHubba: Identifying hub objects and sub-networks from complex interactome. BMC Syst Biol 2014;8:1-7.
[Crossref] [Google Scholar] [PubMed]
- Chen Y, Wang X. miRDB: An online database for prediction of functional microRNA targets. Nucleic Acids Res 2020;48(D1):D127-31.
[Crossref] [Google Scholar] [PubMed]
- Zhang Q, Liu W, Zhang HM, Xie GY, Miao YR, Xia M, et al. hTFtarget: A comprehensive database for regulations of human transcription factors and their targets. Genomics Proteomics Bioinformatics 2020;18(2):120-8.
[Crossref] [Google Scholar] [PubMed]
- Yu G, Wang LG, Han Y, He QY. ClusterProfiler: An R package for comparing biological themes among gene clusters. OMICS 2012;16(5):284-7.
[Crossref] [Google Scholar] [PubMed]
- Subramanian A, Tamayo P, Mootha VK, Mukherjee S, Ebert BL, Gillette MA, et al. Gene set enrichment analysis: A knowledge-based approach for interpreting genome-wide expression profiles. Proc Natl Acad Sci 2005;102(43):15545-50.
[Crossref] [Google Scholar] [PubMed]
- Brière G, Darbo É, Thébault P, Uricaru R. Consensus clustering applied to multi-omics disease subtyping. BMC Bioinform 2021;22:1-29.
[Crossref] [Google Scholar] [PubMed]
- Newman AM, Steen CB, Liu CL, Gentles AJ, Chaudhuri AA, Scherer F, et al. Determining cell type abundance and expression from bulk tissues with digital cytometry. Nat Biotechnol 2019;37(7):773-82.
[Crossref] [Google Scholar] [PubMed]
- Tamm ER, Ethier CR, Dowling JE, Downs C, Ellisman MH, Fisher S, et al. Biological aspects of axonal damage in glaucoma: A brief review. Exp Eye Res 2017;157:5-12.
[Crossref] [Google Scholar] [PubMed]
- Denoyer A, Godefroy D, Celerier I, Frugier J, Degardin J, Harrison JK, et al. CXCR3 antagonism of SDF-1 (5-67) restores trabecular function and prevents retinal neurodegeneration in a rat model of ocular hypertension. PLoS One 2012;7(6):e37873.
[Crossref] [Google Scholar] [PubMed]
- Duffy SS, Keating BA, Moalem-Taylor G. Adoptive transfer of regulatory T cells as a promising immunotherapy for the treatment of multiple sclerosis. Front Neurosci 2019;13:1107.
[Crossref] [Google Scholar] [PubMed]
