- Corresponding Author:
- M. N. Saraf
Department of Pharmacology, The Bombay College of Pharmacy, Kalina, Santacruz (E), Mumbai - 400 098, India
E-mail: saraf@bcpindia.org
| Date of Submission | 15 December 2008 |
| Date of Revision | 27 October 2010 |
| Date of Acceptance | 14 November 2010 |
| Indian J Pharm Sci, 2010, 72 (6): 726-731 |
Abstract
An analytical method based on high-performance liquid chromatography with ultraviolet detection (245 nm) was developed for the determination of actarit in human plasma. Coumarin was used as an internal standard. Chromatographic separation was achieved with a C8 column using a mobile phase of methanol: 1% acetic acid (50-50, v/v) with a flow rate of 1.0 ml/min. The calibration curve was linear over the range of 0.1-4.0 μg/ml (r 2 > 0.99) and the lower limit of quantification was 0.1 μg/ml. The method was validated for sensitivity, accuracy, precision, recovery and stability. The method was used to determine the concentration-time profiles of actarit in the plasma following oral administration of 100 mg actarit tablets.
Keywords
Actarit, bioequivalence study, HPLC
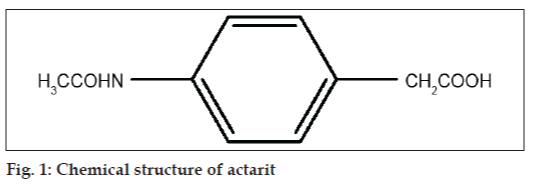
Actarit, 4-acetylaminophenylacetic acid (fig. 1), is an orally active immunomodulator used in the treatment of rheumatoid arthritis. It has been documented that actarit has a suppressive effect on the progression of articular lesions in mice and that it has prophylactic and therapeutic effects on secondary inflammation in adjuvant arthritis in rats. Actarit suppressed type III and IV allergic reactions in mice. Type IV allergic reaction is considered of importance in the pathogenic mechanism of experimental allergic encephalomyelitis [1].
Literature search revealed a single pharmacokinetic study published in a non-English language [2] (Only abstract of the published article is available with authors). Another reported method describes the use of an ion-pairing chromatographic method to determine actarit in tablet formulation [3].
This paper presents the development and optimization of a simple, rapid and selective isocratic HPLC method with an easy sample preparation for the estimation of actarit from plasma which can be routinely applied for the analysis of bioequivalence study samples.
Materials and Methods
Actarit and coumarin were obtained from Macleods Pharmaceuticals Ltd and Dr. M. K. R Drug Testing Laboratory, Mumbai, India, respectively. Acetonitrile and methanol (HPLC grade) were purchased from Qualigens Fine Chemicals, Mumbai. Perchloric acid (AR grade) was purchased from S. D. Fine Chem. Ltd., Mumbai. Freshly prepared double distilled water was used throughout the study. Fresh frozen human plasma used in the method development was obtained from the National Plasma Fractionation Center, K. E. M. Hospital, Mumbai, and was stored at -20° until required.
Instrumentation and Chromatography
The HPLC system consisted of a Jasco–PU 980 intelligent pump (Jasco Ltd., Japan), manual injector port with 20 μl loop (Rheodyne, USA) and Jasco UV/Vis 975 intelligent detector (Jasco Ltd., Japan). The wavelength of the detector was set at 245 nm. Detector output was quantified on Jasco–Borwin (Version 1.50) chromatography software with Hercules 2000 Chromatography Interface (Version 2.0). Separation was carried out on a HiQ Sil C8, 250´4.6 mm i.d., Japan, using methanol:1% acetic acid in the ratio of 50:50 (v/v) as a mobile phase, at a flow rate of 1 ml/min. The mobile phase was filtered through nylon membrane filter (0.45 μm pore size, Pall, Gelman Laboratories) and ultrasonically degassed prior to use. Total analysis time was 10 min.
Preparation of actarit and internal standard solutions
A standard stock solution of actarit was prepared in methanol at a concentration of 1 mg/ml. Working actarit solutions ranging from 100 to 4000 ng/ml were prepared by suitable dilution of the stock standard solution with the mobile phase. A standard stock solution of 1 mg/ml coumarin (internal standard) was prepared in methanol. This solution was further diluted with mobile phase to yield 100 μg/ml of coumarin solution.
Preparation of calibration and quality control standard solutions in plasma
Calibration standards in plasma were prepared by spiking drug free plasma with 100 μl of 1000 μg/ ml actarit stock solution, diluted to 10 ml with drug free plasma to furnish a 10 μg/ml actarit calibration standard. This solution was further diluted with drug free plasma to furnish the calibration standards of 100, 250, 500, 1000, 2000 and 4000 ng/ml. They were frozen in small portions at –20° until analyzed.
Quality control standards were prepared by spiking drug free plasma with actarit standard solution to furnish a ‘Highest Quality Control standard’ (HQC) 4000 ng/ml, ‘Median Quality Control standard’ (MQC) 1000 ng/ml and ‘Lowest Quality Control’ standard (LQC) 100 ng/ml. These samples were used to validate the method and were frozen in small portions at –20° until analyzed.
Sample preparation
To 1 ml plasma sample containing actarit (calibration standard), 50 μl of an internal standard (100 μg/ml) was added and was vortexed for 1 min. The drug was extracted by vortexing with 1 ml of 10% perchloric acid in methanol: Acetonitrile mixture (50:50, v/v) for 1 min followed by centrifugation at 8000 g for 20 min at 4o and 20 μl of the supernatant was injected onto the column.
Validation of the analytical method [4]
The analytical method developed for the determination of actarit from plasma was validated for selectivity, limit of detection and quantitation, linearity, precision, accuracy, recovery and stability in plasma. (http:// www.fda.gov/cder/guidance/index.html).
Selectivity
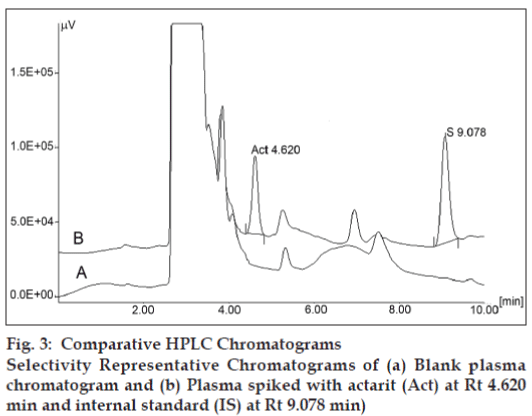
A quality control sample containing actarit (1000 ng/ml) and internal standard was developed under the optimized chromatographic condition. The separation of actarit, internal standard and probable impurities from plasma was checked, by comparing the chromatogram of quality control sample with that of blank plasma chromatogram. Six different samples of drug free blank plasma samples were prepared and compared.
Limit of Detection (LOD) and Limit of Quantitation (LOQ)
In order to estimate LOD and LOQ, the drug free blank plasma sample was extracted and injected six times and analysed as described under optimized chromatographic conditions. The noise level was then determined. Further drug spiked plasma was injected. The LOD (Signal-to-noise ratio = 3) and LOQ for actarit was determined (Signal-to-noise ratio = 10).
Linearity
Quantitative analytical results are highly influenced by the quality of the calibration curve. The linearity of the method was evaluated by a calibration curve in the range of 100-4000 ng/ml of actarit in plasma including LOQ. For linearity study six different concentrations of actarit were analyzed 100, 250, 500, 1000, 2000 and 4000 ng/ml. To each of these samples, 50 ml of an internal standard (100 μg/ml) was added. The calibration curve was obtained by plotting the area ratios of actarit to internal standard versus the concentration of actarit by least-squares linear regression analysis. The calibration curve requirement was set at a correlation coefficient (r2) of 0.99 or better.
Accuracy and precision
Intraday and interday accuracy and precision were determined by analysis of six sets of quality control standards of actarit (100, 1000, and 4000 ng/ml), six times a day randomly and once on each of six different days respectively. Six samples of each concentration along with a fixed concentration of internal standard were developed under optimized chromatographic conditions and the response was measured. For acceptable intraday and interday values, accuracy should be within 85–115% and coefficient of variation (CV) values should be <15% over the calibration range, except at the LOQ, where accuracy should be between 80 and 120% and CV should not exceed 20%.
Recovery
The recovery of actarit from plasma was determined on quality control standards (100, 1000, and 4000 ng/ml) containing fixed amount of internal standard in each of these samples. Recoveries of actarit was determined by comparing each of the peak area ratio of actarit to internal standard of extracted quality control standards with that of peak area ratio of actarit to internal standard of unextracted standard solutions containing the corresponding concentrations in the mobile phase.
Stability studies
Actarit stability in plasma was tested using quality control standards for three freeze–thaws and longterm stabilities. The freeze–thaw stability of the analyte was determined over three freeze–thaw cycles within 3 days. In each freeze–thaw cycle, the quality control samples were frozen for 24 h at −20° and thawed at room temperature. The long-term stability was evaluated by storing the quality control samples at −20° over time. The concentration of actarit was found out on day 5, day 15 and day 30. For the acceptance criterion of stability, the deviation compared to the freshly prepared standard should be within ±15%.
Clinical study design
The developed and validated HPLC method was applied to a bioequivalence study of actarit in healthy Indian male subjects with a mean age of 22.83±1.59 years and a mean body mass index (BMI) of 21.98±2.51 after a single dose of 100 mg actarit test and reference tablets. On the basis of medical history, clinical examination and laboratory investigation (hematology, blood biochemistry and urine analysis), all the study subjects were judged to be in good health. The study subjects were instructed to abstain from taking any medication including over the counter (OTC) drugs for at least 2 weeks prior to and during the study period and avoid any alcohol or xanthine containing food and beverages 36 h prior to and during the course of the study. The study was approved by a local ethics committee, written informed consent was obtained from all the study subjects. The study was conducted according to the principles outlined in the Declaration of Helsinki. The study was conducted as 12×2 single dose, randomized, open and complete crossover design. The study subjects were fasted overnight before the study and for 4 h after the dosing; the volunteers received one tablet (test or reference) of actarit 100 mg with 240 ml water. Venous blood samples (5 ml) were collected before dosing (0 h) and at 0.5, 0.75, 1.00, 1.25, 1.50, 1.75, 2.00, 2.50, 3.00, 4.00, 6.00, 8.00, 12.00, 16.00 and 24.00 h following drug administration through an indwelling cannula into heparinised tubes. After drug administration standard breakfast and lunch were provided at 4 and 6 h. The blood samples collected at various time intervals after drug administration were immediately centrifuged at 3000 g for 15 min at 4o, plasma was separated and stored at –20° until analysed. After a washout period of 7 days, the study was repeated in the same manner to complete the crossover design. The order of receiving the test and reference product for each subject during the two periods of the study was determined according to a randomization scheme. The plasma samples obtained at various time intervals were analysed by HPLC method developed and validated.
Pharmacokinetic analysis
The plasma concentration profile obtained was fed into S-inverse (S-inv), computer software on BASICA® Version 1.12, to determine the pharmacokinetic parameters. The maximum actarit concentrations (Cmax) and the corresponding peak time (Tmax) were determined by checking the individual drug plasma concentration–time profiles. The elimination rate constant (Kel) was obtained from the least-square fitted terminal log-linear portion of the plasma concentration–time profile. The elimination half-life (t1/2) was calculated as 0.693/Kel. The area under the curve to the last measurable concentration (AUC0–t) was calculated by the linear trapezoidal rule. The area under the curve extrapolated to infinity (AUC0–inf) was calculated as AUC0-t + Ct / Kel, where Ct is the last measurable concentration.
For the purpose of bioequivalence analysis AUC0-t, AUC0-inf and Cmax were considered as primary variables. Bioequivalence of two formulations was assessed by means of an analysis of variance (ANOVA) for crossover design and calculating 90% confidence interval of the ratio of test/reference using log transformed data on a Microsoft excel®. The formulation was considered bioequivalent when the difference between two compared parameters was found statistically insignificant (P > 0.05) and confidence interval for these parameters fell within 80-125%.
RESULTS
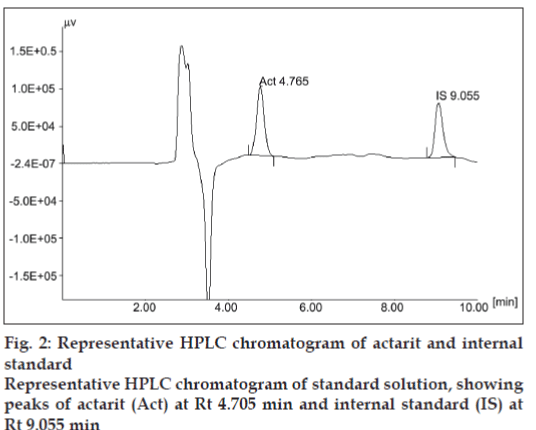
Under the chromatographic conditions employed the sample showed good separation of actarit from the endogenous impurities of plasma. The retention time (Rt) of the actarit and internal standard was found to be 4.76±0.2 min and 9.05±0.3 min, respectively (fig. 2). The results of validation parameters were as follows:
The peaks of actarit and internal standard were well resolved. No endogenous peak from plasma was found to interfere with the elution of either actarit or the internal standard. Selectivity of the method was thus proven by the absence of interfering peaks near the Rt of actarit. Representative chromatograms of human blank plasma; human blank plasma spiked with actarit and internal standard are shown in fig. 3, respectively.
The calibration curve was linear over the actarit working concentration range of 100-4000 ng/ml in human plasma with six-point calibration. The LOQ of actarit in plasma was verified as 100 ng/ml, as this was the lowest concentration assessed at which the accuracy was between 80 and 120%, and precision was within 20%. The LOD was 25 ng/ml at a signalto- noise ratio of 3.
The results for accuracy and precision for actarit quality control standards are presented in Table 1. All the values of accuracy and precision including LOQ fell within the limits considered as acceptable. The recovery of actarit from 1 ml of plasma was measured for the quality control standards are tabulated in Table 2, expressed as a percentage, obtained for both actarit and the internal standard.
| Concentration (ng/ml) | |||
|---|---|---|---|
| 100 | 1000 | 4000 | |
| Intra Day (n=6) | |||
| Mean±SD | 94.67±10.50 | 966.50±34.83 | 4001.50±71.56 |
| % CV | 11.09 | 3.60 | 1.79 |
| % Accuracy | 94.67 | 96.65 | 100.04 |
| Inter Day (n=6) | |||
| Mean±SD | 91.83±11.11 | 979.67±64.96 | 3978.67±104.32 |
| % CV | 12.09 | 6.63 | 2.62 |
| % Accuracy | 91.83 | 97.97 | 99.47 |
The table gives mean and standard deviation (± SD) of concentration found from the quality control samples, calculated from six samples at each of the concentrations mentioned (n=6) along with their coefficient of variation (% CV). The table also gives %accuracy of the method.
Table 1: Accuracy and Precision of the Method for Determining the Concentration of Actarit in Plasma Samples
| Concentration (ng/ml) | |||
|---|---|---|---|
| Actarit | 100 | 1000 | 4000 |
| % recovery | 89.79±3.17 | 91.02±1.77 | 92.60±2.38 |
| (Mean±SD) (n=6) | 3.53 | 1.94 | 2.57 |
| % CV | |||
| Internal Standard | 5 (μg/ml) | ||
| % recovery | 88.02±3.21 | ||
| (Mean±SD) (n=6) | |||
| % CV | 3.65 | ||
The table gives mean and standard deviation (± SD) of the recoveries of actarit at 3 different concentrations i.e. lowest quality control (LQC), median quality control (MQC) and highest quality control (HQC) standards. The table also gives recovery of internal standard.
Table 2: Recoveries of Actarit and Internal Standard from Drug Free Human Plasma
Three freeze–thaw cycles of the quality control standards appeared to have no effect on quantification of the analyte. Quality control samples stored in a freezer at −20° remained stable for at least one month. These studies suggested that human plasma samples containing actarit can be handled under normal laboratory conditions without significant loss of compound [Table 3].
| Number of days stored |
LQC (100 ng/ml) | MQC(1000 ng/ml) | HQC (4000 ng/ml) | |||
|---|---|---|---|---|---|---|
| Mean±SD (n=3) |
% CV | Mean±SD (n=3) |
% CV | Mean±SD (n=3) |
% CV | |
| 3-Freeze thaw studies | 93.33±8.08 | 8.66 | 1053.33±70.24 | 6.67 | 3993.33±250.27 | 6.27 |
| 5 days | 94.33±6.81 | 7.22 | 986.67±65.06 | 6.59 | 3993.33±165.63 | 4.15 |
| 15 days | 92.33±5.51 | 5.97 | 936.67±66.58 | 7.11 | 3890.00±190.00 | 4.88 |
| 30 days | 88.00±7.55 | 8.58 | 910.00±45.83 | 5.04 | 3873.33±145.72 | 3.76 |
The table gives long term stability (30 days) data of actarit in human plasma at 3 different concentrations i.e. lowest quality control (LQC), median quality control (MQC) and highest quality control (HQC) standards and standard deviations (± S.D.) along with their coefficient of variation (% C.V).
Table 3: Stability of Actarit in Human Plasma
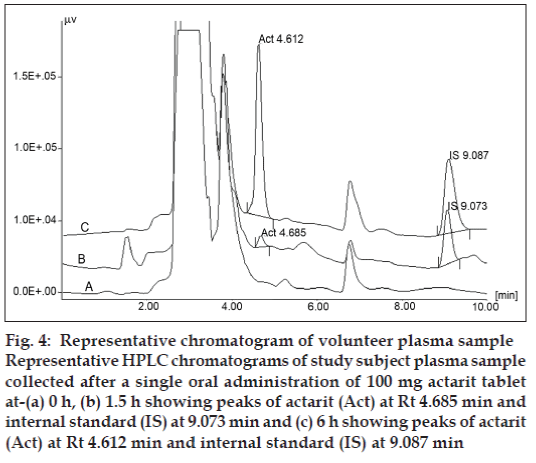
The validated method has been used successfully to quantify the concentration of actarit in human plasma samples after the administration of a single 100 mg oral dose of actarit. The sampling duration was 24 h; however after 6 h actarit was not detectable in the plasma sample by UV detector. Fig. 4 shows the chromatograms of plasma samples obtained from a volunteer at 0, 1.5 and 6 h after dosing.
Fig. 4: Representative chromatogram of volunteer plasma sample Representative HPLC chromatograms of study subject plasma sample collected after a single oral administration of 100 mg actarit tablet at-(a) 0 h, (b) 1.5 h showing peaks of actarit (Act) at Rt 4.685 min and internal standard (IS) at 9.073 min and (c) 6 h showing peaks of actarit (Act) at Rt 4.612 min and internal standard (IS) at 9.087 min
The observed mean maximum plasma concentration (Cmax) was 3371.64±145.18 ng/ml for the reference and 3341.36±236.71 ng/ml for the test. Mean time to achieve maximum plasma concentration (Tmax) was 0.94±0.11 h for the reference and 0.88±0.13 h for the test. The mean value of area under the curve from time zero to the last sampling time (AUC0–t) was 5872.00±343.70 ng.h/ml for the reference and 5750.85±477.77 ng.h/ml for the test, and area under the curve from zero to infinity (AUC0–inf) was 6394.22±460.28 ng.h/ml for the reference and 6449.65±598.65 ng.h/ml for the test. The elimination half-life (t1/2) was 1.76±0.34 h for the reference and 2.13±0.44 h for the test. In addition, the mean ratio of AUC0–t/AUC0–inf was more than 80% in accordance with the Food and Drug Administration Bioequivalence Guideline [7].
The ratio of test/reference (T/R) and 90 percent confidence intervals (90 CIs) for overall analysis were comprised within the range (80–125%). The T/R ratio and 90 CIs log normal transformed were 98.96 and 99.54-100.20% for Cmax, 97.77 and 100.04-101.93% for AUC0–t. The ratio T/R and 90 CIs log normal transformed were 100.68 and 00.61- 101.60% for AUC0–inf. The results demonstrated the bioequivalence of the two formulations of actarit.
Discussion
Actarit, 4-acetylaminophenylacetic acid is an orally active immunomodulator used in the treatment of rheumatoid arthritis. To develop suitable chromatographic conditions, initially pure sample of actarit was used. Actarit was freely soluble in methanol; hence standard solutions were prepared in methanol. The purpose of this paper is to report a simple isocratic chromatographic method to determine actarit for bioequivalence studies.
Preliminary experiments showed that actarit was always eluted out on a regular C-18 column at dead time with solvents like methanol and acetonitrile (increased from 0% to 100%) and over a wide range of pH (2.5-9.5). Hence, chromatographic separation was tried on C8 column. Various proportions of acetonitrile, methanol with acetic acid (0.1-1%) was tried for separation of actarit from probable impurities from plasma along with good peak shape and resolution of actarit and internal standard. It was found that a mixture of methanol and 1% acetic acid (50:50, v/v) delivered at a flow rate of 1 ml/min with detection at 245 nm could achieve our purpose and was finally adopted.
Attempts were made to use tolmetin, dexibuprofen, amtolmetin and coumarin as internal standard. All these compounds except coumarin tried were found to be either overlapping with retention time of actarit (tolmetin) or eluting with plasma impurities (amtolmetin) or the retention time was too high (dexibuprofen) under the optimized chromatographic conditions. Actarit and coumarin showed good resolution with retention times of 4.76±0.2 min and 9.05±0.3 min, respectively under optimized chromatographic conditions. Hence, coumarin was selected as an internal standard.
The sample preparation of actarit was based on simple protein precipitation technique. Actarit is freely soluble in solvents like acetonitrile; methanol etc. and thus initial methods for precipitating proteins were attempted with solvents like methanol and acetonitrile. The method was not specific when protein precipitation was done with either methanol or acetonitrile alone. Although perchloric acid gave cleaner extracts, the recoveries of actarit and internal standard were low. Hence, a mixture of perchloric acid, acetonitrile and methanol was attempted. The protein was precipitated with 1 ml of 10% perchloric acid in acetonitrile and methanol mixture (50:50, v/v) which not only gave cleaner chromatograms but also good recoveries of drug and internal standard. Once the method was developed, validation of the method was done for its selectivity, limit of detection and quantitation, intra-day and inter-day accuracy and precision, linearity, recovery, sensitivity, and stability in plasma. The validation parameters of the method were found to be well within the limits.
Both the formulations were well tolerated by all the study subjects in both periods of the study. No clinical adverse events occurred during the study. Cmax and Tmax were in good agreement with the value reported in the Chinese published literature. Half life of actarit in our study did not agree with reported pharmacokinetic study but was identical between test and reference formulations.
This paper describes a simple, sensitive, selective and rapid method for the determination of actarit in human plasma using high-performance liquid chromatography with ultraviolet detection. The method was successfully applied to a bioequivalence study of actarit 100 mg tablet in Indian healthy male volunteers.
Acknowledgements
The authors acknowledge financial support and gift samples for this work were provided by the Shri Amrut Modi Research Fund (AMRF) and M/s Macleods Pharmaceuticals Ltd, respectively. The help render by Dr. Krishna Iyer in manuscript preparation and the students of Department of Pharmacology, Bombay College of Pharmacy, in conducting the trial, is gratefully acknowledged.
References
- Kawai K, Kobayashi Y, Hirayama M, Shiratori M, SobueG.Suppressive effects of 4-acetylaminophenylacetic acid (actarit)on experimental autoimmune encephalomyelitis in rats.Immunopharmacology 1998;39:127-38.
- Li YH, Li J, Jin Y. Pharmacokinetics and relative bioavailabilityof domestic actarit in healthy volunteers. Chin J Clin Pharmacol2002;18:49-52.
- Fang F, Xu G, Lu B. HPLC Determination of 4-Acetylaminophenylacetic Acid. J LiqChromtogrRelTechnol 2001;24:1021-7.
- Guidance for Industry Bioanalytical Method Validation. Rockville,MD: US Department of Health and Human Services, Food and Drug Administration, Center for Drug Evaluation and Research (CDER).;2001.
- Guidance for Industry Statistical Approaches in Establishing Bioequivalence. Rockville, MD: US Department of Health and HumanServices. Food and Drug Administration, Center for Drug Evaluationand Research. (CDER); 2001.
- Bolton S, editor. Experimental Design in Clinical trial.In:Pharmaceutical Statistics Practical and Clinical Applications. New York: Marcel Dekker Inc.; 1997;80:384-443.
- FDA. Pharmacopoeial Forum, US Department of Health and Human Service, Foodand Drug Administration, May: 1993.


