- *Corresponding Author:
- G. A. Shabir
Oxford Brookes University, School of Life Sciences, Oxford, OX3 0BP, UK
E-mail: gshabir.oxford@yahoo.com
| Date of Submission | 18 January 2010 |
| Date of Revision | 28 August 2010 |
| Date of Acceptance | 18 November 2010 |
| Indian J. Pharm. Sci. 2010, 72 (6): 809-814 |
Abstract
A reversed-phase liquid chromatographic method for the determination of 1,7,7-trimethyl-bicyclo(2,2,1)heptan-2-one in a cream formulation is developed and validated. The separation was achieved using an isocratic mobile phase, on a Lichrosorb C8 column. The calibration curve is linear (r 2 = 0.9999) from 25-175% of the analytical concentration of 1.0 mg/ml. The mean percent standard deviation values for intra-day and inter-day precision studies were <1%. The recovery ranges 99.80-100.06% from a cream formulation. The method can be used reliably in quality control for the analysis of bulk cream samples and final product release.
Keywords
Method validation, pharmaceutical cream formulation, reversed-phase liquid chromatography, 1,7,7-trimethyl-bicyclo(2,2,1)heptan-2-one
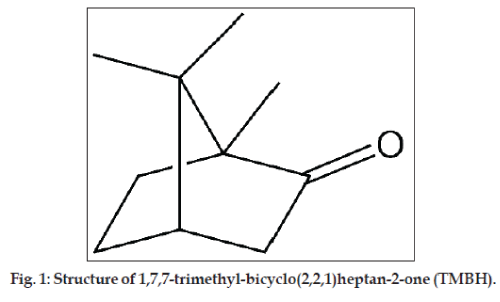
1,7,7-Trimethyl-bicyclo(2,2,1)heptan-2-one (TMBH, fig. 1) is used for its scent, as an embalming fluid and in antiseptic creams as the active ingredient. It is a white transparent waxy crystalline solid with a strong penetrating pungent aromatic odor [1]. It is found in the wood of the TMBH laurel, Cinnamonum camphora, which is a large evergreen tree found in Asia (particularly in Borneo, hence its alternate name); it can also be synthetically produced from oil of turpentine. TMBH is readily absorbed through the skin and produces a feeling of cooling and acts as a slight local anesthetic and antimicrobial agent. Recently, carbon nanotubes were successfully synthesized using TMBH in chemical vapor deposition process [2]. In larger quantities, it is poisonous when ingested and can cause seizures, confusion, irritability, and neuromuscular hyperactivity. Despite the rather low skin absorption it may still lead to hepatotoxicity in extreme cases [3,4]. In 1980, the United States Food and Drug Administration (FDA) set a limit of 11% allowable camphor in consumer products and totally banned products labeled as camphorated oil, camphor oil, camphor liniment, and camphorated liniment (except "white camphor essential oil", which contains no significant amount of camphor). Since alternative treatments exist, medicinal use of TMBH is discouraged by the FDA, except for skin-related uses, such as medicated powders, which contain only small amounts of TMBH. Various analytical procedures for analysis of TMBH with the combination of other compounds including m-cresols [5], menthol [6] and mixtures of TMBH, menthol, and methyl salicylate in ointments [7] using gas chromatography have been reported in the literature. In this work for the first time, a simple, rapid, specific and sensitive Reversed-Phase Liquid Chromatography (RPLC) novel assay method for the determination of TMBH in a pharmaceutical cream formulation is reported. Frequently, RPLC is the analytical method of choice in pharmaceutical analysis because of its specificity (i.e. all the components of a sample are separated from one another before the measurement is made so that its results arise from the analyte and from nothing else). Finally, the developed analytical method was validated to assess the validity of research data means determining whether the method used during the study can be trusted to provide a genuine, account of the intervention being evaluated. As a best practice [8-12] in the subsequent investigation, the new RPLC method was validated [13] using preapproved protocol and a validated LC system.
Methanol (HPLC-grade), 1,7,7-trimethyl-bicyclo(2,2,1) heptan-2-one (96% pure), ammonium formate, and ammonium acetate were obtained from Sigma-Aldrich (Gillingham, UK). Acetic acid (analytical grade) was purchased from BDH (Lutterworth, UK). Distilled water was de-ionised by using a Milli-Q system (Millipore, Bedford, MA).
A Knauer HPLC system (Berlin, Germany), consisting of a vacuum degasser, a Knauer 1000 solvent pump, Knauer 3950 autosampler and a Knauer photodiodearray (PDA) detector 2600, all controlled by a ClarityChrom software, was used. A reversed phase Lichrosorb C8 column (150×4.6 mm, 5 μm particle size) (Jones Chromatography, UK) was used for separation. The mobile phase comprised of a (65:35, v/v) mixture of methanol-water containing 0.1% analytical grade acetic acid (v/v) was used. The flow rate was 1 ml/min, the injection volume was 20 μl, and the temperature was set at 30±0.5°.
TMBH (2.5 g) was accurately weighed and added to a 100 ml volumetric flask before being dissolved in methanol (stock). A 4.0 ml aliquot of stock solution was diluted to 100 ml in mobile phase, yielding a final concentration of 1.0 mg/ml. Standard solutions for the evaluation of TMBH linearity were prepared over a concentration range of 0.25-1.75 mg/ml, to 25, 50, 75, 100, 125, 150, and 175%, in the mobile phase.
An accurately weighed amount (10 g) of sample cream into a 150 ml stopper quick fit flat bottomed flask and 36 ml methanol and 1.0 ml acetic acid were added. The flask was heated on a boiling water bath until the sample cream melted. The solution was then cooled to room temperature. Forty milliliter of de-ionized water was added to the flask. Amount equivalent to 100 mg TMBH from pharmaceutical formulation was transferred to 100 ml volumetric flask and 30 ml mobile phase was added, yielding a final concentration of 1.0 mg/ml. The flask was shaken mechanically for 10 min and the solution was then diluted to volume with mobile phase. The sample was filtered through a sample filtration unit (0.45 μm) and injected into the LC system.
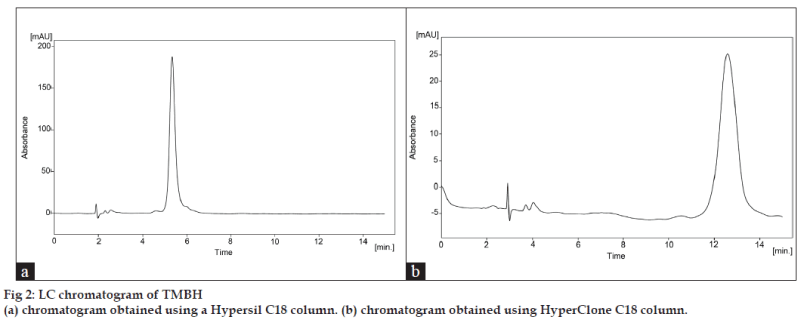
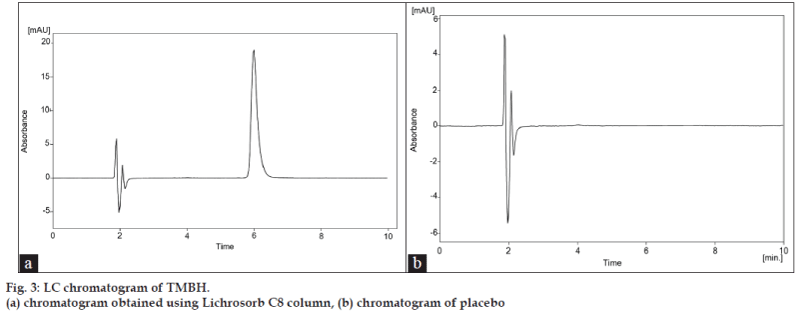
Acetic acid in water, ammonium formate, and ammonium acetate buffers were studied as potential mobile phases but acetic acid was selected because it gave a shorter analysis time and better separation was obtained with the addition of methanol. Initially, three analytical columns were tried in order to reach an acceptable specificity and selectivity for camphor compound. We first exploited Hypersil C18 (250×4.60 mm, 5 μm) and HyperClone C18 (250×4.60 mm, 5μm) phase columns from Phenomenex (Macclesfield, UK). The Hypersil column gave poor separation of camphor peak with retention time of 5.35 min (fig. 2a). The Hyperclone column also gave a poor peak shape with tailed badly and was longer retention time 12.58 min (fig. 2b) for the analyte peak. Shift to the Lichrosorb C8 (150×4.6 mm, 5 μm), column (Jones Chromatography, Hengoed, UK) produced a peak with superior band shape and a column efficiency with shorter retention time (5.97 min) under the same conditions (fig. 3a). The temperature was set at 30±0.5°. The choice of wavelength is essential to accomplish a sensitive chromatographic assay. The optimal wavelength for TMBH detection was established using the scan range of 200 to 400 nm. It was established that 289 nm was the optimal wavelength to maximize the signal. System suitability testing was performed by injecting six replicate injections of a solution containing 1 mg TMBH/ml. The percent relative standard deviation (RSD) of the peak area responses was measured, giving an average of 0.11 (n=6). The tailing factor (T) for each TMBH peak was 1.071, the theoretical plate number (N) was 5615, and the retention time (tR) variation %RSD was < 1% for six injections. The RPLC method met these requirements within the accepted limits [14]. For the determination of method robustness within a laboratory during method development a number of chromatographic parameters were determined, which included flow rate, temperature, mobile phase composition, and columns from different lots, In all cases good separation of TMBH were always achieved, indicating that the method remained selective for TMBH component under the tested conditions.
Samples and standard solutions were chromatographed immediately after preparation and then reassyed after storage at room temperature for 48h. The results given in (Table 1) show that there was no significant change (<1% response factor) in TMBH concentration over this period.
| Validation step | Parameters | Concentration (mg/ml) | Results | Acceptance criteria |
|---|---|---|---|---|
| Standard stability | % change in response factor | 1.0 | 0.12 | X < 2 |
| Sample stability | % change in response factor | 1.0 | 0.14 | X < 2 |
| Linearity1 | Correlation coefficient (r2) | 0.25-1.75 | y = 725.18 × - 91.577 (r2 = 0.9999) | r2 = ≥ 0.999 |
| Repeatability2 | tR (min) %RSD | 1.0 | 0.04 | X < 2 |
| Peak area %RSD | 0.16 | X < 2 | ||
| Intermediate precision3 | Instrument %RSD | 1.0 | 0.26 | X < 2 |
| Analyst %RSD | 0.18 | X < 2 |
1k = 6, n = 3, 2n = 6, 3n = 3.
Table 1: Method validation results.
Linearity was studied using seven solutions in the concentration range 0.25-1.75 mg/ml, 25-175% around the theoretical value (1.0 mg/ml). Solutions corresponding to each concentration level were injected in triplicate and linear regression analysis of the TMBH peak area (y) versus TMBH concentration (x) was calculated. The correlation coefficient (r2 = 0.9999) obtained for the regression line demonstrates that there is a strong linear relationship between peak area and concentration of TMBH (Table 1).
Precision of the method was investigated with respect to repeatability (intra-day precision) and intermediate precision (inter-day variation). Repeatability of the method was evaluated by assaying six replicate injections of the TMBH at 100% of test concentration (1.0 mg/ml). The %RSD of the retention time (min) and relative percent peak area were found to be less than 0.17% (Table 1). Intermediate precision (inter-day variation) was demonstrated by two analysts using two LC systems and evaluating the relative peak area percent data across the two LC systems at three concentration levels (50, 100, and 125%) that cover the assay method range (0.25-1.75 mg/ml). the mean and %RSD across the systems and analysts were calculated from the individual relative percent peak area mean values at the 50%, 100%, and 125% of the test concentration. The %RSD values for both instruments and analysts were 0.26% (Table 1) and illustrated good precision of RPLC method.
The accuracy of the method was evaluated by adding known quantities of TMBH in the cream formulation samples to give a range of TMBH concentration of 75-150% (n=3) of that in a test preparation. These solutions were analyzed and the amount of analyte recovered calculated. The recovery data expressed as an average percent of triplicate injections are presented in (Table 2) and show good recovery of TMBH.
| Sample # | Percent of nominal | Amount of analyte (mg) | Recovery (%, n = 3) |
RSD (%, n = 3) |
|
|---|---|---|---|---|---|
| Added | Recovered | ||||
| 1 | 75 | 0.75 | 0.7502 | 100.02 | 0.12 |
| 2 | 100 | 1 | 0.998 | 99.8 | 0.17 |
| 3 | 150 | 1.5 | 1.501 | 100.06 | 0.14 |
| Mean | 99.96 | ||||
Table 2: Recovery studies of TMBH from sample with known concentration.
Injections of the extracted placebo were performed to demonstrate the absence of interference with the elution of the TMBH. These results demonstrate (fig. 3b) that there was no interference from the other materials in the cream formulation and, therefore confirm the specificity of the RPLC method. The forced degradation studies were also applied to TMBH reference standard at a concentration of 1 mg/ ml to verify that none of the degradation products interfered with quantitation of the drug. Hydrolytic degradation was studied by heating the drug under reflux at 80° in 0.1M hydrochloric acid and 0.1M sodium hydroxide for 4 h. The samples were then cooled to room temperature and neutralized. Oxidative degradation was studied by treating the drug with 3% hydrogen peroxide at room temperature (22±1°) for 4 h. Solutions containing 1 mg/ml of each degraded samples were prepared and injected in triplicate. No significant degradation was observed under any stress conditions studied (Table 3).
| Stress conditions | Sample treatment | tR (min) | Area (mAU s) | Assay (%) |
|---|---|---|---|---|
| Reference standard | Fresh solution | 6.4 | 7921 | 99.98 |
| Acid degradation | 1M HCl at 80° for 4h | 6.398 | 7916 | 99.86 |
| Base degradation | 1M NaOH at 80° for 4h | 6.397 | 7922 | 99.77 |
| Oxidative degradation | 3% H2O2 for 24h | 6.4 | 7911 | 99.68 |
Table 3: Results of the stress conditions experiments.
The limit of detection (LOD) and limit of quantitation (LOQ) of TMBH was determined based on standard deviation (σ) of response and slope (s) [13]. TMBH solutions were prepared in the range 5-250 μg/ml and injected in triplicate. Average peak area of analyte was plotted against concentration. LOD and LOQ were calculated by using the following equations: LOD= (3.3 σ)/s and LOQ = (10 σ)/s. The LOD was determined to be 8.4 μg/ml and LOQ was found to be 76 μg/ml for TMBH with %RSD less than 0.16% for six replicate injections.
To determine the robustness of method, the final experimental conditions were purposely altered and the results were examined. The flow rate was varied by 1±0.2 ml/min. the percentage of organic modifier was varied by 65±5% and temperature was varied by 30±5°. Their effects on the retention time (tR), tailing factor (T), theoretical plate numbers (N) and repeatability of peak areas (n=3) were studied. It can be seen that every employed condition, the chromatographic parameters are in accordance with established value [14,15]. A change of mobile phase composition, flow rate and temperature had no impact on chromatographic performance. The tailing factor for TMBH peak was found to be less than 1.2 and analyte was well separated under all the changes carried out (Table 4). Considering the result of modifications in the system suitability parameters and the specificity of the method, it would be concluded that the method conditions are robust.
| Parameter | Modification | tR (min) | T | N | RSD (%)* |
|---|---|---|---|---|---|
| Mobile phase (Methanol, ±5%) | 60% | 6.405 | 1.018 | 5612 | 0.16 |
| 65% | 6.4 | 1.018 | 5687 | 0.11 | |
| 70% | 6.398 | 1.015 | 5567 | 0.13 | |
| Flow rate (±0.2, ml/min) | 0.8 | 6.408 | 1.018 | 5689 | 0.11 |
| 1 | 6.4 | 1.018 | 5685 | 0.16 | |
| 1.2 | 6.397 | 1.018 | 5681 | 0.11 | |
| Temperature (±5°) | 25 | 6.4 | 1.018 | 5688 | 0.14 |
| 30 | 6.4 | 1.019 | 5687 | 0.12 | |
| 35 | 6.399 | 1.018 | 5653 | 0.13 |
* Peak area (n = 5)
Table 4: Robustness data of RPLC method.
A reversed-phase liquid chromatographic method with UV spectrophotometric detection was developed for the determination of TMBH in pharmaceutical cream formulation. The method was validated and the results obtained were accurate and precise with RSD < 1% in all cases and no significant interfering peaks were detected. The method is specific, simple, selective, robust and reliable for routine use in quality control for analysis of TMBH in bulk samples, raw materials, and final cream product pharmaceutical formulations.
Acknowledgements
We thank Dr. Simon Giles (School of Life Sciences, Oxford Brookes University) for providing materials for the research work.
References
- Mann C, Hobbs JB, Banthorpe DV, Harborne JB. Natural products: Their chemistry and biological significance. Harlow, Essex, England: Longman Scientific and Technical; 1994. p. 309-11.
- Kumar M, Ando Y. Carbon nanotubes from camphor: An environmentfriendlynanotechnolog. J PhysConfSer 2007;61:643-6.
- Martin D, Valdez J, Boren J, Mayersohn M. Dermal absorption of camphor, menthol, and methyl salicylate in humans. J ClinPharmacol2004;44:1151-7.
- Uc A, Bishop WP, Sanders KD. Camphor hepatotoxicity. South Med J 2000;93:596-8.
- Mirza T, Tan SIH. Capillary gas chromatographic assay of camphor and m-cresol in dermatological creams. J Pharm Biomed Anal 1998;17:1427-38.
- Karuza LJ, Folivarski K. Validation of the assay method for camphor and menthol in a herbal drug preparation. J Pharm Biomed Anal 1996;15:419-22.
- Henry SIT, Patricia AK, Petra EP. Gas-liquid chromatographic assay of mixtures of camphor, menthol, and methyl salicylate in ointments, J Chromatogr A 1982;238:241-6.
- Shabir GA, Lough WJ, ShafiqueAA, Bradshaw TK. Evaluation and application of best practice in analytical method validation. J LiqChromatogrRelTechnol 2007;30:311-33.
- Shabir GA. Validation of HPLC methods for pharmaceutical analysis: Understanding the differences and similarities between validation requirements of the US Food and Drug Administration, the U.S. Pharmacopoeia and the International Conference on Harmonization. J Chromatogr A 2003;987:57-66.
- Shabir GA. Step-by-step analytical methods and protocol in the quality system compliance industry. J Validation Technol 2004;10:314-24.
- Shabir GA. A practical approach to validation of HPLC methods under current good manufacturing practices. J Validation Technol2004;10:210-8.
- Shabir GA. HPLC method development and validation for pharmaceutical analysis. PharmaTechnolEur 2004;16:37-49.
- International Conference on Harmonization (ICH). Validation ofanalytical procedures: Text and Methodology, Q2(R1), Geneva, Switzerland, Nov 2005.
- U.S. Pharmacopeia 32, Chromatography, General Chapter (621). Rockville, MD, USA: United StatesPharmacopeal Convention; 2009. p. 1776.
- Reviewer Guidance: Validation of Chromatographic Methods, Food and Drug Administration (FDA). United States: Center for Drug Evaluation and Research (CDER); 1994.


