- Corresponding Author:
- N. Manjunatha
Department of Pharmaceutical Biotechnology, JSS College of Pharmacy, Ooty-643 001, India
Email: nmanjunatha81@yahoo.co.in
| Date of Submission | 03 January 2011 |
| Date of Revision | 09 December 2011 |
| Date of Acceptance | 13 December 2011 |
| Indian J Pharm Sci, 2011, 73 (6): 649-655 |
Abstract
The aim of the study was to formulate and investigate the pharmacokinetic parameters for the tablets of herbal extract of caffeine with comparison to synthetic formulation. The tablets of the aqueous herbal extract of leaves of Camellia sinensis and synthetic caffeine were formulated by wet granulation technique. The HPLC and HPTLC were applied as analytical tools for estimation of caffeine. The batches of formulation (B1 to B7) were subjected for various pre and post-formulation studies. The pharmacokinetic of the batch B5 was assessed in rabbits, and the results were compared to synthetic batch B7. With the suitable pre and post-formulation results, the B5 showed in vitro release of 90.54% of caffeine at the end of 60 min. The release followed first order kinetics and the plot of Higuchi and Peppas confirms anomalous diffusion as the basic mechanism behind the release. B5 revealed nonsignificant mean Cmax, t1/2, and AUC of 1.88 μg/ml, 5.52 h and 9.67 μg.h/ml respectively compared to B7. The study highlights; no significant difference in the pharmacological effect of caffeine when administered in the form of extract. The administration of herbal extract can further provide the other health benefits lacked by synthetic caffeine.
Keywords
Camellia sinensis, pharmacokinetics, synthetic caffeine, tablets
The military personnel, drivers and the others involved in the late-night activities experience a situation of alertness. The consumption of caffeine provides alertness and motivates to work [1]. Caffeine is normally consumed as the daily diet in the form of coffee, tea and other beverages. The potentiality of tea to improve the alertness, vigilance, memory with cognitive functions and state of mood has made it the second most beverage consumed all over the world [1,3-7]. Apart from this, the consumption of tea obtained from leaves of Camellia sinensis (CS) also provides several other health benefits. The tea is widely used in treatment of tumor [8], diabetes [9], HIV-1 infectivity [10], anogentital warts [11], inflammation [12], skin disorders [13], arteriosclerotic [14], asthma [15], and coronary heart disease [16]. Even it is having the antibacterial, antiviral, antiaging [17], and neuroprotective activity [18,19].
One can undergo the therapy of synthetic caffeine to clinch the mood, but he or she cannot gain the other health benefits of tea as given above. As the availability of tea at late nights is negligible for alertness with health benefits, the present study aimed at preparation of tablets of extract of the green tea considering caffeine as a biomarker. The single dose pharmacokinetic (PK) parameters for tablets of extract were determined and compared with that of the synthetic. The study was also focused for any synergistic changes on the kinetic profile of the caffeine as reported the un-fractionated green tea can provide better action in the disease modifying properties [20].
Materials and Methods
The Department of Pharmacognosy, JSS College of Pharmacy, Ooty, examined and authenticated green tea leaves obtained from the local market of Ooty. SD Fine Chemicals supplied synthetic caffeine (SC), lactose (monohydrate), talc, magnesium stearate and methanol (HPLC grade). Signet Chemicals, Mumbai, India, gifted cross carmellose and starch 1500 was purchased from Coloron Asia Pvt. Ltd. All the other chemicals used were of LR grade.
Preparation and Quantification of caffeine in extract by HPTLC
The caffeine extraction was carried out as reported earlier at 95° using water [21].The quantification of caffeine was carried out at λmax of 275 nm (Camag Linomat IV, Switzerland) after development of pre-coated plates of 4×10 cm size (silica gel 60 F 254, E. Merck) as described previously [22].
Compatibility studies
The drug-excepients compatibility study was conducted by Fourier transform infrared (FTIR) spectral studies (FTIR spectrophotometer, Perkin- Elmer-1600) using KBr pellets. All samples were crushed with potassium bromide. The weight ratio of sample and potassium bromide was 2 mg to 300 mg, respectively. Crushed powders were compressed using a hydraulic compactor at approximately 20,000 pounds under vacuum for 3 min. FTIR measurements were performed from 4000 to 400 cm−1 at a resolution of 4 cm−1 [23].
Tablet preparation
Tablets of both SC (7 mg) and the extract (equivalent to 7 mg of caffeine) were compressed (Rotary Tablet Compressor, 10 station, Rimek, Ahmedhabad, India) using 6 mm standard punches by wet granulation technique with varying the process and formulation parameters [24]. All the powder mass was passed through BSS-80 mesh and mixed geographically for 20 min. The sufficient quantity of the granulating agent was added to obtain the cohesiveness and the wet mass was passed through mesh 10. The granules were, dried at 40° for 30 min and passed through mesh #16/22 to separate the fines. The tablets were punched in presence of glidant and lubricant. The Table 1 gives the formulae of batch B5 and B7.
| Ingredients | B5 (mg) | B7 (mg) |
|---|---|---|
| CS extract | Equivalent to 7 mg of caffeine | - |
| SC | - | 7 |
| Lactose | 36 | 225.5 |
| Starch 1500 | 12.5 | 12.5 |
| Croscarmellose | 12.5 | - |
| Magnesium stearate | 2.5 | 2.5 |
| Talc | 2.5 | 2.5 |
| Water | q.s. | q.s. |
| SC - Synthetic caffeine |
Table 1: Formula Of the B5 and B7 Batch
Pre-compression parameters
The granules were studied for angle of repose, bulk and tapped density, compressibility index and drug content. The angle of repose was determined by funnel method using the below formulae where h and r were the height and radius of the powder cone (USP, 2006). The bulk and tap density was determined by taking the known quantity of slightly shaken granules. These granules were introduced to 50ml measuring cylinder to record the bulk density. This was then allowed to fall under its own weight onto a hard surface from the height of 2.5 cm at 2 s interval. The tapping was continued until no further change in volume was observed. The density was calculated based on the weight of powder to volume occupied by it. The compressibility index was calculated using the below formula. Drug content was determined by analyzing the quantity of caffeine extracted into phosphate buffer pH 7.2 from 100 mg of granules. The samples were analyzed spectroscopically at λmax of 275 nm and expressed in terms of percentage. Angle of repose (Δ)=tan-1(h/r); Compressibility index (%) = 100(TDBD)/ TD, Where TD and BD represent tapped and bulk density, respectively [25].
Post-compression parameters
The post-compression parameters like weight variation (n=20), drug content (n=10), friability (n=tablets to whole weight of 6.5 g), disintegration time (n=6) and hardness were determined. The test for post compression parameters except hardness was performed as per IP 2007. The drug content was estimated for individual tablets. The hardness and friability was calculated using Monsanto hardness tester (Cadmach, Ahmedabad, India) and friability testing apparatus (Indian equipments, Mumbai, India). The n represents the number of tablets used for the test.
In vitro drug release
The study was carried for 2 h using USP dissolution apparatus type II (Electrolab, Mumbai, India) at 100 rpm using 900 ml of phosphate buffer pH 7.2 as the media. The temperature of the media was maintained at 37±0.5° throughout the process. At known time interval the samples were withdrawn for analysis (HPLC, Shimadzu-LC 20AD) and replaced with equal quantity of the media to maintain the sink condition (USP-NF24, 2006). The studies were carried thrice for B5 and B7. The data of the in vitro release studies were plotted in various kinetics models like a) zero order (cumulative amount of drug release vs. time); b) first order (log cumulative percentage drug remaining vs. time) c) Higuchi (cumulative percentage of drug release vs. square root of time) and d) Krosmeyer Peppas (log cumulative percentage drug release vs. log time) to study the release behavior [26].
Stability Studies
The accelerated stability studies were carried according to ICH guidelines (Zone IV) at 40°/75% RH for the period of 6 months. At regular time interval, the formulations were, checked for their post-compression parameters and in vitro release studies [27,28].
PK studies
With the prior approval of the ethical committee the single dose PK study was carried out on six healthy rabbits in each batch, three of either sex weighing 1.5±0.2 kg. The dose was calculated based on the body surface area [29]. The animals were fasted overnight prior to the study to avoid any chance of food interaction on the study. The oral dose was given through an intragastric tube with 0.3% w/v CMC suspension. Blood sample (1 ml) was collected in heparinized tubes from the marginal ear vein at 0, 0.25, 0.5, 0.75, 1, 2, 4, 8, 12, and 24 h after the drug administration. The samples were centrifuged at 3500 rpm for 10 min to separate the plasma and they were stored at -20±0.2° until analyzed.
Statistical analysis
Comparison between different groups was performed by One-Way Analysis of Variance (ANOVA) and student-T test using graph pad prism software.
Results
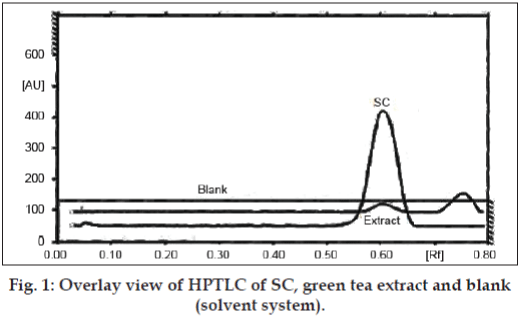
The residue of green tea blend (15 g) was consecutively washed with water (10 ml) and combined with the initial filtrate and was evaporated to dryness at 40° using rotary evaporator. The extract was quantified for the caffeine by HPTLC with comparison with the peak area obtained for 0.5 mg/ml methanolic solution of SC. The application volume of extract and synthetic solution was 5 μl respectively. The fig. 1 displays the overlay view of the HPTLC spectra of extract and SC. The pre-coated plates developed using mobile phase ethyl acetate and methanol (85:15) was scanned by densitometer at wavelength of 275 nm. With the obtained peak area at Rf value of 0.61±0.01 it was estimated that 3.8±0.072% w/w of caffeine is present.
Compatibility, pre and post compression study
The IR peak matching technique was applied for the study of drug-excipients interactions between the selected blend. The results were positive for the further study as all the ingredients were compatible with each other as well as with the extract and the SC.
Various batches of tablets were compressed by wet granulation technique and the Table 2 displays their pre and post-compression parameters. The hardness of all the formulations was greater than 3.05 kg. The angle of repose gives a qualitative assessment of internal and cohesive frictional forces. All the batches had an angle of repose less than 30° indicating good flow potential. The size and shape of the particles reflects the density of the material. The density is directly proportional to the number of spherical particles present whereas inversely to the size of the particles [24]. As the value of compressibility is less than 15% in all the cases except for that of B1, the granules produced the adequate flow and stable packing. Not much difference was observed for the same in case of B2 [30].
| Parameters | B1 | B2 | B3 | B4 | B5 | B6 | B7 |
|---|---|---|---|---|---|---|---|
| AOR (°) | 24.48±0.67 | 23.64±0.87 | 21.47±2.17 | 22.22±0.95 | 20.43±1.04 | 18.15±0.69 | 17.49±0.49 |
| BD (g/cm3) | 0.613±0.03 | 0.678±0.04 | 0.759±0.03 | 0.871±0.03 | 0.849±0.03 | 0.631±0.02 | 0.626±0.02 |
| TD (g/cm3) | 0.737±0.05 | 0.806±0.01 | 0.857±0.03 | 0.976±0.01 | 0.961±0.02 | 0.691±0.01 | 0.690±0.01 |
| CI (%) | 16.33±10.60 | 15.82±6.13 | 11.30±6.81 | 10.74±4.56 | 11.63±3.29 | 8.75±2.19 | 9.19±2.12 |
| Granules DC (%) | 92.04±2.24 | 91.79±0.50 | 92.96±4.05 | 92.58±0.58 | 93.14±0.46 | 99.07±1.29 | 98.53±1.34 |
| AvgWt of Tablet (mg) | 250 ± 7.5% | ||||||
| Tablet DC (%) | 91.97±1.70 | 91.11±1.60 | 90.06±0.76 | 91.76±1.15 | 92.13±1.30 | 98.76±0.77 | 98.87±0.65 |
| Hardness (kg/cm2) | 11.33±0.57 | 6.33±0.57 | 5.66±0.57 | 4.66±0.57 | 4.66±0.57 | 5±0 | 8±0 |
| Friability (%) | Not more than 1% | ||||||
| DT (min) | 124±13.03 | 93.83±12.3 | 36.16±5.70 | 27.66±2.58 | 10.5±2.25 | 1.33±0.25 | 11.58±0.66 |
All the values represents the mean±SD (n=3). AOR indicates Angle of Repose; BD and TD symbolize Bulk and Tap density; CI and DC stands for Carr’s Index and Drug Content respectively. DT stands for Disintegration time. B1 to B7 stands for batches prepared with alteration in process parameters
Table 2: Pre- And Post-Compression Parameters Of The Batches With Standard Deviation
Process and formulation variable study
Initially the B1 containing MCC and starch 1500 has disintegrant and binder respectively at concentration of 5% w/w (each) of tablet weight [31,32] had a disintegration time (DT) of 124±13.03 min. This was too high and out of the limit for a conventional formulation. In B2 the MCC was completely replaced with starch 1500 which reduced the DT to 93.83±12.35 min. For further drop in DT the concentration of the starch 1500 was reduced to 5% w/w of tablet size in B3 and the DT reported was 36.16±5.7 min. The B4 recorded a slight change in DT on addition of cros carmellose sodium [33] at concentration 2% w/w of tablet and increase in concentration to 5% w/w (B5) resulted in suitable formulation that was ideal for conventional oral drug delivery of herbal extract in tablet form. With slight alteration of the formula of the B5 the tablets of the SC were formulated and the DT was within 2 min. (1.33±0.25 min).
In vitro release
The dissolution study was, carried for B5 and B6 as the DT was suitable for the study. The B6 released almost 90% of the drug at the end of 20 min whereas the B5 released more than 70% of drug at the end of 40 min. For the better correlation of the study the super disintegrant was eliminated in the B7 which provided DT of 11.58±0.66 min almost equal to that of B5. The B7 had almost similar results as that of B5.
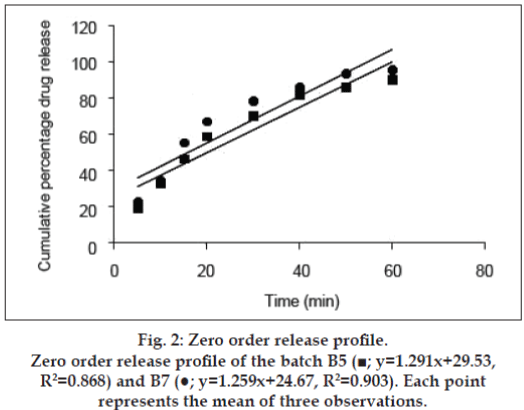
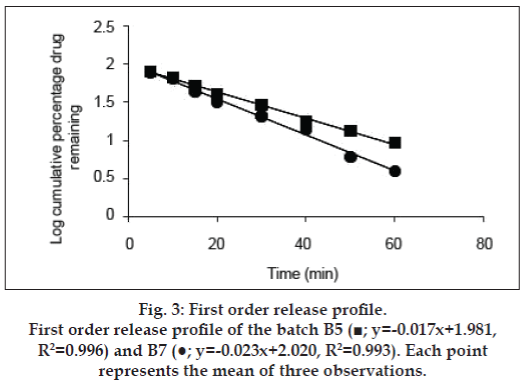
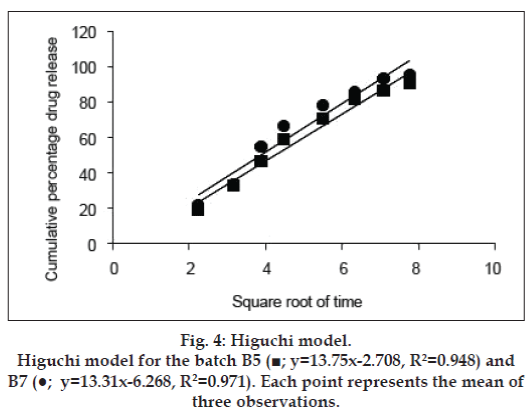
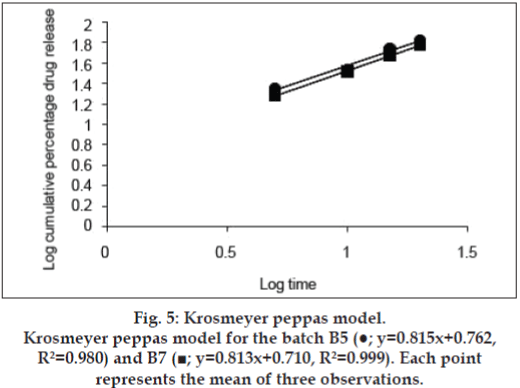
The release kinetics was studied by the application of mathematical models. The zero order describes the system where the drug release rate is independent of its concentration (fig. 2). The first order (fig. 3) describes the release from the system, which is dependent on the concentration. Higuchi model (fig. 4) provides the process of diffusion (Fickian or non- Fickian) whereas Krosmeyer Peppas model (fig. 5) describes the mechanism by which release can occur. Data for the first 60% of drug release was plotted in Korsmeyer Peppas model [34]. The accelerated stability study was carried only for B5 and B7 and found stable throughout the studies with no significant deviations in the results for what it is analysed.
PK parameters and statistical analysis
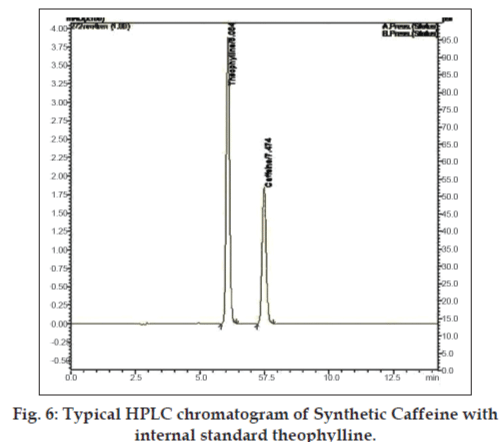
The in vivo PK was carried on six rabbits (3 of either sex) at a dose of 7 mg/kg body weight. The plasma samples were analyzed by reverse phase HPLC (Shimadzu UFLC LC20AD) with chromatographic conditions as methanol:water (65:35) as mobile phase and phenomenex Gemini C18 (250×4.6 mm, i.d. 5μ) as a stationary phase. The flow rate of mobile phase was set at 1 ml/min and the samples were detected by LC solutions as the data station at 272 nm [35,36]. The typical HPLC chromatogram of the caffeine with internal standard is given in fig. 6. The quantification of the chromatogram was performed using peak area ratios (response factor) of the drug to the internal standard. Table 3 provides the various PK parameters estimated for batch B5 and B7 by PK1 and PK2 software. The one way ANOVA applied for all the case studies resulted, the p value of 0.9316 and the average of the case studies were again applied to student-T test which reported the p value as given in Table 3.
| PK parameters | B5 | B7 | P | Significance |
|---|---|---|---|---|
| value | ||||
| Cmax (µg/ml) | 1.88±0.27 | 1.99±0.38 | 0.2844 | Ns |
| Half life (h) | 5.52±1.49 | 5.38±1.43 | 0.8645 | Ns |
| AUC0-24(µg.h/ml) | 9.67±2.93 | 9.74±2.62 | 0.9694 | Ns |
All the values represents the mean±SD (n=6). PK stands for Pharmacokinetic and Ns for non-significant.
Table 3: Comparison Of Pk Parameters Of B5 And B7 Batch By Student T Test
Discussion
The aqueous extraction of CS was carried for not more than 10 min to prevent the degradation of the other major catechins (epicatechin, epicatechin gallate and epigallocatechin etc) which provide the additional health benefits as discussed earlier. Perva- Uzunalic et al., showed that the aqueous extraction of CS yield better caffeine extractive value based on which the effect of other solvents for extraction was not studied [21]. The FTIR spectra of the SC revealed the predominant bonds at wave number 1703, 3112, 2953, 1236 and 1024, and 1657 cm-1 for C=O (s), =C-H (w), C-H (w), C-N (w) and C=N (w) respectively. Mohammed MJ and his team also observed same results for pure caffeine [37]. The same results were also observed for the extract [38] and the blend of the excipients containing SC and extract confirming the presence of caffeine and absence of any interaction of it with the excipients.
The preparation of tablets involves two basic techniques a) wet compression and b) direct compression. The techniques have their own advantages and disadvantages. The limits of direct compression like isolation, low dissolution potential, and poor compression of API made us to opt wet compression [39]. Apart from this wet granulation has several leeway like better flow property, reduced air entrapment and cross contamination, improved surface hydrophilic and cohesion at and later to compaction [40]. The excipients used in this study are commonly used in the granulation process to obtain tablets. The MCC is used as disintegrant, Starch 1500 as binder, lactose as filler, croscarmellose as super disintegrant, talc and magnesium stearate as glidant and lubricant with water as the granulating fluid. In the process of product development, some of the chemicals were omitted and added.
The disintegration time for a tablet is dependent upon its moisture sorption. The replacement of MCC with starch improves the disintegration time as the starch has strong affinity to the water molecules because of the presence of abundance hydroxyl groups and the glucose monomers than MCC [41-43]. The intake of high moisture content may result in strong cohesion between the particles, which may delay the disintegration time affecting the rate of dissolution [44]. Thus, in the B3, the concentration of the starch 1500 was decreased with increase in lactose ratio. Increase in lactose concentration can also decrease the disintegration time as it can produce a large number of small particles due to its nature of creating fragments [45,46]. With all these changes and irrespective of hardness, the tablets were still out of limit for disintegration time, which may be because of formation of paste in contact with test fluid (distilled water). The paste may resist the test fluid to enter the core of the tablet gradually reducing its disintegration time and in all the cases discussed above the tablets disintegrated from the surface with maintenance of its shape. Kurita et al also observed the same results [47]. Thus, the super disintegrant croscarmellose was, added at concentration of 2% and even Parmar reported the formulations with starch 1500 need separate disintegrating reagent [48]. The above concentration was not sufficient enough hence increased to 5% to get the results within limits of standards (IP 2007). Application of the same formulae to the SC aided to immediate release formulation (B6) rather than a conventional as there was no formation of pasty layer in presence of test fluid so the disintegrants was eliminated in B7. The dissolution data obtained for B5 and B7 produced the curvilinear plot when fit to zero order kinetics model suggesting that the release process is dependent on the amount of the drug available for dissolution and diffusion. The first, Higuchi and Krosmeyer models were also plotted to confirm the same. The release of the drug was best explained by first order followed by Higuchi model. The regression coefficient with high linearity (Higuchi model) indicates that the diffusion is the dominant mechanism involved in the release of the drug. To confirm the mechanism, the data was fitted to Krosmeyer Peppas model. The high slope value of the model indicates that diffusion is not only the process of drug release. It appears to indicate a combination of diffusion and erosion so called anomalous diffusion. The relative complexity of this formulation and its components indicates more than one process is involved in drug release.
The PK parameters of caffeine for both the extract and the synthetic formulation were evaluated directly after oral administration to rabbits. The study was carried to evaluate the difference in the PK parameters between the two formulations. The PK study of the extract formulations was studied on the same animals by providing the lag time of 2 weeks which may nullify the effect of subjects.
The one way ANOVA applied to study the difference of variance reported the non significance among the cases and was further confirmed by student-t test with the P value greater than 0.05. Plasma concentration and biopharmaceutical parameters for the tablets of batch B5 and B7 are summarized in Table 3. The formulations were stable even after 6 months with all the results lying in the range discussed earlier.
With the no significance of the PK parameters we conclude that it is better to administer the CS extract rather than SC as it provides the other health benefits discussed earlier. As the therapeutic efficacy is directly dependent on the PK parameter, we also conclude that formulations are significantly equivalent with no synergistic action on efficacy in case of extract. As it is difficult to formulate the tablets of human dose of CS extract because of its high dose size, study on altered dosage form is required along with its bioequivalent studies.
Acknowledgements
The authors acknowledge the All India Council for Technical Education, India for the financial assistance to carry the above work under the scheme of National Facilities in Engineering and Technology with Industrial Collaboration with Apex Laboratories Limited, Chennai, India.
References
- Smith A. Effects of caffeine on human behaviour. Food ChemToxicol 2002;40:1243-55.
- Yang CS, Wang ZY. Tea and cancer. J Natl Cancer Inst 1993;85:1038-49.
- Graham DM. Caffeine-its identity, dietary sources, intake and biological effects. Nutr Rev 1978;36:97-102.
- Johnson LC, Spinweber CL, Gomez SA. Benzodiazepines and caffeine: Effect on daytime sleepiness, performance, and mood. Psychopharmacology (Berl) 1990;101:160-7.
- Walsh JK, Muehlbach MJ, Humm TM, Dickins QS, Sugerman JL, Schweitzer PK. Effect of caffeine on physiological sleep tendency and ability to sustain wakefulness at night. Psychopharmacology 1990;101:271-3.
- Zwyghuizen-doorenbos A, Roehrs TA, Lipschutz L, Timms V, Roth T. Effects of caffeine on alterness. Psychopharmacology 1990;100:36-9.
- Brice C, Smith A. The effects of caffeine on simulated driving, subjective alertness and sustained attention. Hum Psychopharmacol 2001;16:523-31.
- Johnson JJ, Bailey HH, Mukhtar H. Green tea polyphenols for prostate cancer chemoprevention: A translational perspective. Phytomedicine 2010;17:3-13.
- Iso H, Date C, Wakai K, Fukui M, Tamakoshi A; JACC Study Group. The relationship between green tea and total caffeine intake and risk for self-reported type 2 diabetes among Japanese adults. Ann Intern Med 2006;144:554-62.
- Nance CL, Siwak EB, Shearer WT. Preclinical development of the green tea catechin, epigallocatechingallate, as an HIV-1 therapy. J Allergy ClinImmunol 2009;123:459-65.
- Tatti S, Swinehart JM, Thielert C, Tawfik H, Mescheder A, Beutner KR. Sinecatechins, a defined green tea extract, in treatment of external anogenital warts: a randomized controlled trail. ObstetGynecol 2008;111:1371-9.
- Mutoh M, Takahashi M, Fukuda K, Komatsu H, Enya T, Matsushima-Hibiya Y, et al. Suppression by flavonoids of cyclooxygenase-2 promoter-dependent transcriptional activity in colon cancer cells: structure-activity relationship. Jpn J Cancer Res 2000;91:686-91.
- Hsu S, Bollag WB, Lewis J, Huang Q, Singh B, Sharawy M, et al. Green tea polyphenols induce differentiation and proliferation in epidermal Keratinocytes. J PharmacolExpTher 2003;306:29-34.
- Yang TT, Koo MW. Inhibitory effect of chinese green tea on endothelial cell-induced LDL Oxidation. Atherosclerosis 2000;148:67-73.
- Huerta C, Lanes SF, García-Rodríguez LA. Respiratory medications and the risk of cardiac arrhythmias. Epidemiology 2005;16:360-6.
- Cheng TO. All teas are not created equal: The chinese green tea and cardiovascular health. Int J Cardiol 2006;108:301-8.
- Hara-Kudo Y, Yamasaki A, Sasaki M, Okubo T, Minai Y, Haga M, et al. Antibacterial action on pathogenic bacterial spore by green tea catechins. J Sci Food Agric 2005;85:2354-61.
- Friedman M. Overview of antibacterial, antitoxin, antiviral, and antifungal activities of tea flavonoids and teas. MolNutr Food Res 2007;51:116-34.
- Zaveri NT. Green tea and its polyphenoliccatechins: Medicinal uses in cancer and noncancer applications. Life Sci 2006;78:2073-80.
- Koo MWL, Cho CH. Pharmacological effects of green tea on the gastrointestinal system. Eur J Pharmacol 2004;500:177-85.
- Perva-Uzunalic A, Skerget M, Knez Z, Weinreich B, Otto F, Gruner S. Extraction of active ingredients from green tea (Camellia sinensis): Extraction efficiency of major catechins and caffeine. Food Chem 2006;96:597-605.
- Abourashed EA, Mossa JS. HPTLC determination of caffeine in stimulant herbal products and power drinks. J Pharm Biomed Anal 2004;36:617-20.
- Fukuda M, Peppas NA, McGinity JW. Properties of sustained release hot-melt extruded tablets containing chitosan and xanthan gum. Int J Pharm 2006;310:90-100.
- Banker GS, Anderson NR. Tablets. In: Lachman L, Liebermann HA, Kanig JL, editors. The Theory and Practice of Industrial Pharmacy. 3rd ed. Bombay: Varghese Publishing House; 1987, p. 293-345.
- Staniforth JN, Aulton ME. Powder flow. In: Aulton ME, editor. Aulton’s Pharmaceutics: The Design and Manufacture of Medicines. 3rd ed. New York: Churchill Livingstone; 2007, P. 168-79.
- Shoaib MH, Tazeen J, Merchant HA, Yousuf RI. Evaluation of drug release kinetics from ibuprofen matrix tablets using HPMC. Pak J Pharm Sci 2006;19:119-24.
- Sane RT. Standardization, Quality control and GMP’s for herbal drugs. IDMA Bull 2002;33:162-8.
- Mazzo DJ. International Stability Testing. 1st ed. Illinois: Interpharm Press; 1999.
- Ghosh, MN. Fundamentals of Experimental Pharmacology. 3rd ed. Kolkata: Hilton and Company; 2005.
- Marshall K. Compression and Consolidation of Powdered Solids. In: Lachman L, Lieberman HA, Kanig JL, editors. The Theory and Practice of Industrial Pharmacy. 3rd ed. Bombay: Varghese Publishing House; 1987, p. 113-70.
- Galichet LY. Cellulose, Microcrystalline. In: Rowe RC, Sheskey PJ, Owen SC, editors. Handbook of pharmaceutical excipients. 1st ed. London: Pharmaceutical press; 2006, p. 132-5.
- Kibbe AH. Starch, pregelatinized. In: Rowe RC, Sheskey PJ, Owen SC, editors. Handbook of Pharmaceutical Excipients. 1st ed. London: Pharmaceutical press; 2006, p. 731-3.
- Guest RT. Croscarmellose Sodium. In: Rowe RC, Sheskey PJ, Owen SC, editors. Handbook of Pharmaceutical Excipients. 1st ed. London: Pharmaceutical press; 2006, p. 211-3.
- Merchant HA, Shoaib HM, Tazeen J, Yousuf R. Once daily tablet formulation and in vitro release evaluation of cefpodoxime using hydroxypropyl methylcellulose: A technical note. AAPS PharmSciTech 2006;7:78.
- Chen Q, Guo Z, Zhao J. Identification of green tea’s (Camellia sinensis (L.)) quality level according to measurement of main catechins and caffeine contents by HPLC and support vector classification pattern recognition. J Pharm Biomed Anal 2008;48:1321-5.
- Sharma V, Gulati A, Ravindranath SD, Kumar V. A simple and convenient method for analysis of tea biochemicals by reverse phase HPLC. J Food Comp Anal 2005;18:583-94.
- Mohammed MJ, Al-Bayati FA. Isolation, identification and purification of caffeine from Coffeaarabica L. and Camellia sinensis L.: A combination antibacterial study. Int J Green Pharm 2009;3:52-7.
- Silverstein RM, Bassler GC, Morill TC. Spectrometric identification of organic compounds. 4th ed. New York: John Wiley and Sons Inc; 1981.
- Gohel MC, Jogani PD. A review on co-processed directly compressible excipients. J Pharm PharmSci 2005;8:76-93.
- Lachman L, Liebermann HA. The Theory and Practice of Industrial Pharmacy. New Delhi: CBS Publishers and Distributors Pvt. Ltd; 2009.
- Blair TC, Buckton G, Beezer AE, Bloomfield SF. The interaction of various types of microcrystalline cellulose and starch with water. Int J Pharm 1990;63:251-7.
- Emshanova SV, Zuev AP, Sadchikova NP, Tyulyaev II, Tarasova EN. Composition and technology of tinidazole core tablets. Pharm Chem J 2004;38:11.
- Zografi G, Kontny MJ, Yang AY, Brenner GS. Surface area and water vapor sorption of macrocrystalline cellulose. Int J Pharm 1984;18:99-116.
- Zhang Y, Law Y, Chakrabarti S. Physical properties and compact analysis of commonly used direct compression binders. AAPS PharmSciTech 2003;4:1-11.
- Mohapatra A, Parikh RK, Gohel MC. Formulation, development and evaluation of patient friendly dosage forms of metformin, Part I: Orally disintegrating tablets. Asian J Pharm 2008;2:167-71.
- Van der VoortMaarschalk K, Bolhuis GK. Improving properties of materials for direct compression. Pharm TechnolEur 1998;10:28-36.
- Kurita T, Miyagishima A, Nozawa Y, Sadzuka Y, Sonobe T. A dosage design of mitomycin C tablets containing finely powdered green tea. Int J Pharm 2004;275:279-83.
- Parmar J, Rane M. Tablet formulation design and manufacture: Oral immediate release application. Pharma Times 2004;41:21-9.
