- *Corresponding Author:
- G. U. Sailor
Bhagwan Mahavir College of Pharmacy, Bhagwan Mahavir University, BMEF Campus, Surat, Gujarat, India
E-mail: sailorgirish@gmail.com
| Date of Received | 28 October 2020 |
| Date of Revision | 03 February 2021 |
| Date of Acceptance | 12 March 2021 |
| Indian J Pharm Sci 2021;83(2):204-218 |
This is an open access article distributed under the terms of the Creative Commons Attribution-NonCommercial-ShareAlike 3.0 License, which allows others to remix, tweak, and build upon the work non-commercially, as long as the author is credited and the new creations are licensed under the identical terms
Abstract
Berberine is an isoquinoline alkaloid possesses multitude of biological effects. However, quaternary amine cation of berberine causes poor water solubility, resulting in low bioavailability which limits its pharmacological purpose. The aim of this study was to prepare and optimize berberine loaded solid lipid nanoparticle and to evaluate its pharmacokinetic and antihyperlipidemic activity. The solid lipid nanoparticles were prepared by solvent injection method and 32 full factorial design was used to study the effect of concentration of polyvinyl alcohol (X1) and amount of lipid (X2) on particle size (Y1) and entrapment efficiency (Y2). The formulation was optimized using desirability function and evaluated for physicochemical, morphological, in vitro drug release and in vivo pharmacokinetic study. In vivo antihyperlipidemic activity of the formulation was also studied using high fat diet induced hyperlipidemia model. The formulation optimized by validated experimental design comprise of 1 % w/v polyvinyl alcohol, 279 mg lipid (stearic acid) to achieve particle size of 395 nm with 82.44 % entrapment efficiency. In vitro release study of berberine loaded solid lipid nanoparticle showed an initial burst release followed by slow and continuous release. Berberine loaded solid lipid nanoparticle also showed 4.13 folds improvement in relative bioavailability compared to Berberine suspension. Furthermore, Berberine loaded solid lipid nanoparticle ameliorate the levels of total cholesterol (-41 %), TG (-49 %), lipoprotein cholesterol-C (-80 %) and high-density lipoprotein cholesterol(+119 %) compared to hyperlipidemic control and also found to be better than pure drug. The prepared berberine loaded solid lipid nanoparticle are successful drug delivery system demonstrating its effectiveness in controlling hyperlipidemia due to the improved bioavailability of berberine.
Keywords
Design of experiment, berberine, factorial design, solid lipid nanoparticles, antihyperlipidemic activity
In today’s world, people’s living standards improved which leads to the change in the food habit with major portion occupied by food with high fat. Regular intake of high fat food elevates the levels of total cholesterol and triglycerides resulted in fat accumulation, hyperlipidemia and obesity. Hyperlipidemia is a key risk factor for atherosclerosis and cardiovascular disease which is chiefly responsible for worldwide[1,2]. Nowadays, due to the advancement of technology, isolation of medicinally important constituents tested for therapeutic effect instead of conventional traditional medicine. Several phytoconstituents, functional food and dietary supplements have already been evaluated for their antihyperlipidemic[3-7].
Berberine (BER) is a quaternary isoquinoline alkaloid obtained from various plants of Berberis species. It has been historically used as an anti-diarrheal, antiprotozoal, and antimicrobial agent in Ayurvedic and Chinese medicine[8]. It also possesses multitude of biological effects, including anti-inflammatory, antidiabetic, lipid peroxidation, and neuroprotective activity[9-12]. Additionally, it is also found to be beneficial against number of disease condition such as hyperlipidemia, obesity, polycystic ovary syndrome, metabolic syndrome, fatty liver disease, coronary artery disease[13,14]. However, quaternary amine cation of BER causes poor water solubility[15] and P-glycoprotein (Pgp) efflux drastically reduce its transport[16,17], resulting in low oral bioavailability (<1 %)[18,19] which limits its pharmacological purpose. Moreover, intramuscular and intravenous administration may lead to risk of adverse reactions, such as drug rash and anaphylactic shock[20]. Hence, development of novel dosage form of BER is essential to solve these problems which facilitate clinical applications. Recently lipid-based formulations are widely used for the oral administration of phyto-constituents. Nevertheless, lipid-based formulation can also be formulated in different dosage form like self-emulsifying systems, multiple emulsions, microemulsions, liposomes, and solid lipid nanoparticles (SLN)[21,22]. Among these, SLN has gained significant interest as they are made up of physiologically compatible and biodegradable lipids. These are submicron particulate drug delivery system with a size range of 10-1000 nm and comprise of solid lipid matrix capable of incorporating lipophilic and hydrophilic drugs. SLN combine the advantages of lipid emulsion systems and polymeric nanoparticle systems while overcoming the temporal and in vivo stability issues that plague the aforementioned approaches. Utilizing biological lipids is theorized to minimize carrier cytotoxicity and more controlled drug release due to increased mass transfer resistance[23]. Thus, present work was undertaken to prepare BER loaded SLN to improve its absorption and thereby its bioavailability. Additionally, Design of Experiment (DoE) approach like 32 full factorial designs was utilize to minimize the number of trials for optimization of formulation. Lastly, high fat diet induced hyperlipidemic rat model was employed to evaluate in vivo antihyperlipidemic activity of optimized formulation.
Materials and Methods
Materials
BER was purchased from Yucca Enterprises, Mumbai. Stearic acid (SA), polyvinyl alcohol (PVA) (Mw 13000-23000, 87-89 % hydrolyzed) and analytical solvent such as methanol, chloroform, dichloromethane was procured from Loba Chemie Pvt. Ltd., Mumbai. Dialysis bag (MW cut-off =12000-14000) used for in vitro drug release was obtained from Himedia laboratories, Mumbai.
Preparation of SLN:
The SLN was prepared using solvent injection method[24]. The lipid (SA) and 20 mg drug (BER) were dissolved in 5 ml organic solvent mixture composed of dichloromethane and methanol (2:3). The aqueous phase was prepared by adding appropriate quantity of PVA into distilled water preheated at 40° and gradually heat the solution up to 85° with constant stirring until PVA is dissolve completely. The organic phase was injected drop wise into this aqueous phase (50 ml). The dispersion was continuously stirred at 1500 RPM for 2 h at room temperature (25°) and kept overnight for complete evaporation of organic solvents. Finally, the dispersion was filtered with a filter paper (Whatman Grade 6, 3 μm pore size) to remove any excess lipid and filtrate (SLN suspension) was used as such for further analysis.
Experimental design
32 full factorial design:
The SLN prepared by solvent injection method were optimized using 32 full factorial design. The concentration of PVA (X1) and amount of lipid (X2) were selected as independent variables while particle size (Y1) and entrapment efficiency (EE) (Y2) were selected as dependent variables (Table 1). The obtained response value for all nine factorial batches were evaluated using Design Expert software (Design Expert® 10.0.1.0, Stat-Ease, Minneapolis, USA). Analysis of variance (ANOVA) was used to validate design. Contour plot and three dimensional (3D) response surface plots were constructed to establish the understanding of relationship of variables and its interaction.
Batch |
Independent variables | Dependent variables | ||||
|---|---|---|---|---|---|---|
| X1 (% w/v) | X2 (mg) | Y1 (nm) |
Y2 (%) |
|||
| Coded value |
Actual value |
Coded value |
Actual value |
|||
| BN1 | -1 | 0.25 | -1 | 200 | 584 | 51.31 |
| BN2 | 0 | 0.625 | -1 | 200 | 413 | 64.73 |
| BN3 | 1 | 1 | -1 | 200 | 377 | 73.18 |
| BN4 | -1 | 0.25 | 0 | 300 | 732 | 74.86 |
| BN5 | 0 | 0.625 | 0 | 300 | 495 | 78.45 |
| BN6 | 1 | 1 | 0 | 300 | 417 | 83.98 |
| BN7 | -1 | 0.25 | 1 | 400 | 867 | 75.28 |
| BN8 | 0 | 0.625 | 1 | 400 | 536 | 77.84 |
| BN9 | 1 | 1 | 1 | 400 | 432 | 81.46 |
X1 indicates: PVA concentration; X2, amount of lipid; Y1, particle size; Y2, % entrapment efficacy. Constant factors: Drug, 20 mg; organic phase volume, 5 ml; aqueous phase volume, 50 ml; steering speed, 1500 RPM; temperature, 25 °C
Table 1: 32 Full Factorial Design Layout with Coded and Actual Factors and Their Corresponding Responses
Optimization using desirability function:
All the responses were simultaneously optimized by a desirability function using Design-Expert® software. In the desirability function approach, the formulations were optimized by keeping the X1 and X2 within the range used in present work while Y1 at minimum and Y2 at maximum. On the basis of these assigned goals software determines the possible formulation composition with desirability value. Overlay plot was generated to identify the design space for desired responses. The suggested formulation was prepared and evaluated for various responses, considered as optimized batch (OB).
Checkpoint analysis:
Three formulations (VB1-VB3) were randomly selected from design space shown in overlay plot and prepared. These check point formulations were evaluated for responses to check the validity of polynomial equation and experimental design. The predicted and observed response of OB and validation batch was compared and percentage prediction error was calculated using eqn 1, to confirm the validity of design for optimization. Bias(%)=PV-OV/PV×100 (1), where PV=Predicted value and OV=Observed value.
Characterization of optimized formulation Total drug content:
Drug content was estimated by dissolving 1 ml BERSLN suspension in methanol (10 ml). The quantity of BER in each sample was estimated by measuring the absorbance of the clear supernatant at absorption maxima (λmax) of 350 nm using Ultra-Violet (UV) spectrophotometer (1800, Shimadzu Corporation, Kyoto, Japan)[25,26]. Total drug content for triplicate estimation was calculated.
EE and drug loading (DL):
The formulation was centrifuged at 16000 rpm for 30 min at 0° using Remi cooling centrifuge (Remi Instruments, Mumbai, India). The supernatant (0.1 ml) was diluted up to 10 ml with methanol and free drug content was determined by UV spectrophotometer[27,28]. The percentage EE and percentage DL were calculated using eqn 2 and 3 respectively, which are as follows: EE(%)=Total drug(assay)-Free drug/Total drug×100 (2), DL(%)=Total drug-Free drug/Total lipid×100 (3)
Particle size, poly-dispersity index and zeta potential analysis:
The particle size, poly-dispersity index (PDI) and surface charge (zeta potential) of the SLN formulations were determined by photon correlation spectroscopy using Zetatrac (Microtrac Inc., USA).
Fourier transform infrared (FTIR) spectroscopy and X-ray diffraction (XRD):
The drug and excipient compatibility study were performed using FTIR spectrophotometer (IRAffinity-1, Shimadzu corporation, Kyoto, Japan). The FTIR spectra of pure drug and physical mixture of drug (BER) plus excipients (PVA, SA) were derived. The results were observed for any probable change in frequency of characteristics peaks of pure drug due to interaction with formulation excipients.
XRD study was done to check the crystalline properties of formulation using X-ray diffractometer. The analysis of BER, PVA, SA and BER-SLN was performed at ambient temperature. The sample was filled in a copper holder and exposed to Cu K-α radiation (40 KV×40 mA) in X-ray diffractometer (Xpert PRO MPD, Panalytical, Netherland). The sample was scanned between the angular ranges of 5-40° two theta.
Surface morphology:
The shape and surface morphology of optimized formulation was observed by scanning electron microscopy (Zeiss Ultra 55 SEM, Carl Zeiss, Germany). Briefly, sample was suspended in distilled water and the dispersion was mounted on a metal strip. The sample was dried and examined under different magnification. The images obtained were recorded.
In vitro drug release:
Dialysis bag methods were used for studying in vitro release study. The suspension equivalent to 0.5 mg BER (1.25 ml) was dispersed in phosphate buffer pH 6.8 and filled into dialysis bag (molecular weight cutoff, 12000-14000 Da). The bag was closed at both sides and immersed in the 900 ml of dissolution medium (phosphate buffer pH 6.8) with continuous stirring (100 rpm, 37±0.2°)[29]. In time points, 2 ml sample was withdrawn for 24 h and replaced by same amount of fresh dissolution medium. The amount of BER in samples was determined by UV spectrophotometer after suitable dilution. The data of in vitro drug release were fitted to different kinetic models to determine the mechanism of drug release.
Animal
The study was approved by Institutional Animal Ethics Committee (IAEC) and all the animal experiments and protocols were performed according to the Committee for the Purpose of Control and Supervision of Experiments on Animals (CPCSEA) guideline. The experiment was carried out on healthy adult Albino Wistar rats weighing 200-250 g of either sex. Rats will be housed in polypropylene cages, maintained under standardized condition (12 h light/dark cycle, 24°, 35 to 60 % humidity) and will be allowed free access to standard rat pellet and purified drinking water.
Experimental protocol:
Thirty male Wistar Albino rats weighing 220-240 g was fasted overnight for at least 12 h, with free access to water, and randomly divided into two groups for oral administration. The BER suspension and BER-SLN was administered by oral gavage at a dose of 50 mg/kg suspended in 0.5 % w/v sodium carboxymethyl cellulose (CMC). The dose of the BER was decided on the basis of previous study[30]. The rats were anaesthetized using mild ether anesthesia and blood samples were collected by inserting temporary cannula in lateral tail vein[31,32]. Sparse sampling techniques (Table 2) with subgroup of 3 animals (n=3/sampling time)[33] was used to collect the blood at alternate time interval of 0.25, 0.5, 1, 1.5, 2, 4, 6, 8, 12 and 24 h. The blood (0.2 ml) was collected into a 2 ml heparinized micro centrifuge tubes and centrifuged at 5000 rpm for 10 min at 4° to separate the plasma. The supernatant plasma was collected and stored at -20° for further analysis.
| Group (Treatment) |
Rat Sub group | Time point (h) | |||||||||
|---|---|---|---|---|---|---|---|---|---|---|---|
| 0.25 | 0.5 | 1 | 1.5 | 2 | 4 | 6 | 8 | 12 | 24 | ||
| Group-I (BER Suspension) |
1-3 | x | x | ||||||||
| 4-6 | x | x | |||||||||
| 7-9 | x | x | |||||||||
| 10-12 | x | x | |||||||||
| 13-15 | x | x | |||||||||
| Group-II (BER-SLN) |
1-3 | x | x | ||||||||
| 4-6 | x | x | |||||||||
| 7-9 | x | x | |||||||||
| 10-12 | x | x | |||||||||
| 13-15 | x | x | |||||||||
x indicates the time point for 0.2 ml blood collection from retro-orbital plexus of rat eyes
Table 2: Sparse Sampling Technique Protocol for Collection of Blood Samples at Different Time Intervals
Sample treatment procedure:
BER was extracted from plasma by protein precipitation method. Briefly, 100 μl of the rat plasma sample was extracted with 100 μl acetonitrile and thoroughly vortexed (Macro Scientific Work Pvt Ltd, Delhi, India) for 1 min. Then, the mixture was centrifuged (Sorvall ST 8R, Thermo Scientific, USA) at 5000 RPM at 4° for 15 min. The obtained supernatant was collected and under a gentle stream of nitrogen. The residue was reconstituted in 200 μl of the High performance liquid chromatography (HPLC) mobile phase and an aliquot of 20 μl was injected into the HPLC system. The calibration curve was prepared I similar manner by adding 20 μl BER standard solutions (10 -1000 ng/ml) into rat blank plasma (100 μl).
Bioanalytical method:
The analysis of samples for BER content was performed as per the previously validated HPLC method at 350 nm[34]. The HPLC system (UFLC, Shimadzu Corporation, Kyoto, Japan) equipped with binary pump LC-20 AD pump, manual injector and SPD M 20A photodiode array (PDA) detector. The mobile phase consisted of acetonitrile/0.05 M KH2PO4/triethylamine (50:50:0.5, v/v/v). Separation was achieved by a reverse phase column, Enable C18 G (250×4.6 mm, 5 μm) with a flow rate of 1.0 ml/min.
Pharmacokinetic study:
Various pharmacokinetic parameters like AUC0-24, Cmax, Tmax, t1/2, MRT for BER-SLN and BER-suspension calculated by non-compartmental estimation using the PK solver 2.0 adds-in for Microsoft excel[35]. The maximum plasma concentration (Cmax) and the time to reach maximum plasma concentration (Tmax) were obtained directly from plasma concentration-time curve. Area under curve AUC0-24 h was the area under the plasma concentration-time curve from time 0 to final observed concentration time point 24 h upon oral administration. Other pharmacokinetic parameters, such as biological half-life (t1/2) and mean residence time (MRT) were also calculated. The relative bioavailability (F) was calculated by the following eqn[36,37]. Relative Bioavailability(F)=AUCtest/AUCReference×100 (4)
Antihyperlipidemic activity:
Twenty-four Wistar rats of either sex (200-250 g) were divided into four groups (n=6). Group I received 0.5 % CMC (1 ml/kg, p.o) along with standard rat pellet serve as a normal control. Group II received high fat diet (HFD) composed of standard rat pellet (73 % w/w), coconut oil (25 % w/w) and cholesterol (2 % w/w)[38,39] serve as a HFD control. Group III and IV were treated with pure BER suspension (50 mg/kg, p.o) and optimized BERSLN (equivalent to 50 mg/kg BER, p.o) respectively along with HFD. The dose of BER was selected on the basis of previous study[30]. All the test formulations were administered as a suspension in 0.5 % CMC and will be prepared freshly each time. HFD was given once daily for group II, III and IV for 14 days. Treatment was given orally, 2 h after the administration of HFD once daily for 14 d[40]. At the end of the study, blood samples (0.5 ml, once) were withdrawn from retro orbital plexus. The biochemical parameters such as serum lipid level like total cholesterol (TC), triglyceride (TG), high-density lipoprotein cholesterol (HDL-C) and lowdensity lipoprotein cholesterol (LDL-C) level was were estimated by standard diagnostic kit (SPAN Diagnostic and Crest Biosystem, India).
Statistical analysis
The experimental data for pharmacokinetic study and antihyperlipidemic study were expressed as the mean±SD. Statistical significance between more than two groups was tested using one-way ANOVA followed by the Tukey’s multiple comparisons test at 95 % confidence interval while two group comparison in pharmacokinetic data were performed using student t-test. Calculations were done using Graphpad Prism® software. The significance level was set at p<0.05 for all tests.
Stability study:
The optimized formulation was also evaluated for stability study as per International Council for Harmonisation guidelines. The formulation was kept in screw capped glass container at refrigerated condition 2-8°, at room temperature 25°± 2° (60 %±5 % RH) and at an elevated temperature 40°±2° (75 %±5 % RH) for a period of 30 d. The samples were analysed for physical appearance, drug content and in vitro drug release at regular interval of 15 d.
Results and Discussion
SLN have emerged as a safe and effective drug delivery system offers several advantages like drug targeting, biocompatibility, preventing the drug degradation, devoid of organic solvent, accommodation of hydrophilic and lipophilic drug. SLN were formulated to overcome limitation associated with phyto constituents with proven therapeutic potentials and can augment its bioavailability. The solvent injection method is a wellestablished technique modified from solvent diffusion techniques. The BER-SLN was successfully prepared by solvent injection techniques using SA as a lipid, PVA as a stabilizer. The mixture of dichloromethane and methanol was used for solubilisation of drug as well as lipid in same solvent. The advantages of this method are avoidance of high pressure homogenization, easy handling and less time consuming techniques without use of sophisticated equipment[24,41].
In this study, SA used as a lipid matrix due to its thermal stability (m.p., 69°) at body temperature, and its biocompatibility and biodegradable characteristics. This property offers strong interaction with hydrophobic drugs results in high EE and stable core of lipids. PVA serve as a stabilizer in prepared SLN are absorbed around the emulsion droplet, form due to the dispersion of lipid phase which results in the formation of droplet in spontaneous manner. The lipid along with drug will get precipitate out due to decrease in solubility at the droplet interface.
The purpose of the full factorial design was to identify and quantify the effect of independent variables on the dependent variables. The three level two factor design is an effective approach for investigating variables at different levels with a limited number of experimental runs. The choice of independent variables was based on previous studies that showed the influence of PVA and SA on the lipid nanoparticle characterization[25,42,43]. Nine formulations were formulated by varying amount of PVA and SA, an independent variable, based on the 32 full factorial design. The particle size and EE were found to be in the range of 377 to 867 nm and 51.31 % to 83.98 %, respectively (Table 1). All formulations had low values of polydispersity (0.157-0.426) indicating the uniformity of particle size.
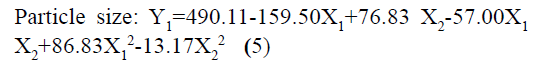
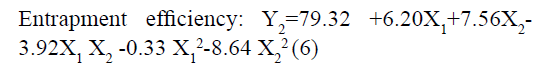
The responses observed for factorial batches were simultaneously fitted to linear, cubic and quadratic models using Design Expert® software. The software recommended that the best-fitted model was quadratic for response Y1 (R2=0.9965, Adjusted R2=0.9905) and Y2 (R2=0.9839, Adjusted R2=0.9571) (Table 3). In this model along with main effect of independent variables, interaction and quadratic effect on dependent variables are also evaluated which can be explained by polynomial eqn 5 and 6.
| Source | SD | R2 | Adjusted R2 | Predicted R2 | PRESS |
|---|---|---|---|---|---|
| For Y1: PS | |||||
| Linear | 69.75 | 0.8656 | 0.8208 | 0.6515 | 75719.22 |
| 2FI | 56.92 | 0.9254 | 0.8807 | 0.7457 | 55255.57 |
| Quadratic | 16.03 | 0.9965 | 0.9905 | 0.9579 | 9145.29 |
| Cubic | 7.33 | 0.9998 | 0.9980 | 0.9549 | 9801.00 |
| For Y2: % EE | |||||
| Linear | 6.02 | 0.7247 | 0.6329 | 0.3174 | 539.89 |
| 2FI | 5.59 | 0.8025 | 0.6840 | 0.1606 | 663.94 |
| Quadratic | 2.06 | 0.9839 | 0.9571 | 0.8138 | 147.25 |
| Cubic | 1.30 | 0.9979 | 0.9830 | 0.6116 | 307.21 |
SD indicates: standard deviation; R2, regression coefficient; 2FI, two factor interaction; PRESS, predicted residual error sum of squares; Y1, particle size; Y2, % entrapment efficacy
Table 3: Model Summary Statistics for Responses
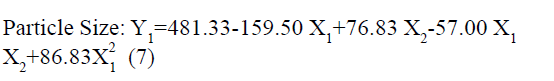
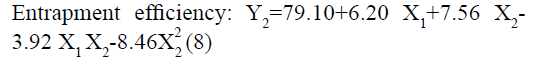
The positive coefficients of model terms in polynomial equation indicate a favourable effect on the responses, while negative sign of coefficient indicates an unfavourable effect on the responses. The statistical validity of each term in polynomial equation was tested using ANOVA with a corresponding p value (Table 4). The results show that two model term b22 (p value: 0.3295) for Y1 and b11 (p value: 0.8362) for Y2 was insignificant and suggest the necessary model reduction to improve the model. Hence, the reduced polynomial equations for Y1 (7) and Y2 (8) were generated by omitting the least contributing model terms and tested by F statistics in portions (Table 5) to determine whether the coefficient b22 for Y1 and b11 for Y2 contributes significant information for the prediction of responses or not[44].
| Response | Model type | Model term | |||||
|---|---|---|---|---|---|---|---|
| b0 | b1 | b2 | b12 | b11 | b22 | ||
| Y1: PS | FM | 490.11 | -159.5 | 76.83 | -57 | 86.83 | -13.17 |
| p-value | 0.0007 | 0.0002 | 0.0013 | 0.0057 | 0.0046 | 0.3295 | |
| RM | 481.33 | -159.5 | 76.833 | -57 | 86.833 | - | |
| Y2: EE | FM | 79.315 | 6.195 | 7.56 | -3.922 | -0.328 | -8.463 |
| p-value | 0.006 | 0.0051 | 0.0029 | 0.0318 | 0.8361 | 0.0101 | |
| RM | 79.096 | 6.195 | 7.56 | -3.9225 | - | -8.463 | |
Y1 indicates: , particle size; Y2, % entrapment efficacy; FM, full model; RM, reduced model; b, coefficient of model term in polynomial equation
Table 4: Results of P Value and Regression Coefficients for Responses
| Source | SS | df | MS | F Value | p-value (Prob>F) |
R2 | Adj R2 | Pred R2 | F statistic | |
|---|---|---|---|---|---|---|---|---|---|---|
| Y1: PS | ||||||||||
| Regression | FM | 216500 | 5 | 43296.89 | 168.45 | 0.0007 | 0.9965 | 0.9905 | 0.9579 | FCalc=1.348 FTab=6.61 DF=(1,5) α =0.05 |
| RM | 216100 | 4 | 54034.43 | 193.35 | <0.0001 | 0.9949 | 0.9897 | 0.9662 | ||
| Residual | FM | 771.11 | 3 | 257.04 | ||||||
| RM | 1117.83 | 4 | 279.46 | |||||||
| Y2: % EE | ||||||||||
| Regression | FM | 778.21 | 5 | 155.64 | 36.66 | 0.0068 | 0.9839 | 0.9571 | 0.8138 | FCalc=0.049 FTab=6.61 DF=(1, 5) α =0.05 |
| RM | 777.99 | 4 | 194.50 | 60.07 | 0.0008 | 0.9836 | 0.9673 | 0.8138 | ||
| Residual | FM | 12.74 | 3 | 4.25 | ||||||
| RM | 12.95 | 4 | 3.24 | |||||||
SS indicates: sum of squares; df, degrees of freedom; MS, mean of squares; F, Fischer's ratio; R2, regression coefficient; FM, full model; RM, reduced model; FTab, table value of F; FCalc, calculated value of F
Table 5: Calculations for Testing the Model in Portions
Generally, the model is significant for “probability>F” less than 0.05, while model is not significant for “probability>F” greater than 0.05. The smaller p value and larger F-value were desired for more significant corresponding coefficients[45]. The model F-value of 168.45 (p<0.05) for Y1 and 36.66 (p<0.05) for Y2 indicates the model is significant. The resulted R2 for Y1=0.9949 and Y2=0.9836, indicates good correlation. Further Adj-R2 of 0.9905 and Pred-R2 of 0.9579 for Y1 and for Y2 Adj-R2 of 0.9571 and Pred-R2 of 0.8138, were in reasonable agreement, i.e. difference is less than 0.2, indicating that the data were described adequately by the mathematical model. Additionally, the results shows that table value of F for α= 0.05 is equal to 6.61 (df = 1, 5) while the calculated value of F (Y1, FCalc=1.348; Y2, FCalc=0.049) is less than the table value (FTab=6.61) indicated that that the interaction term b22 for Y1 and b11 for Y2 does not contribute significantly to the prediction of responses and therefore can be omitted from the full model. Furthermore, the reduced model showed higher F-value for Y1 (193.35) and Y2 (60.07) compared to full model confirm the validity of reduced model. The p value for reduced model was also less as compared to the full model, which favours the reduced model for optimization of formulation.
In addition, the polynomial equation can also predict the influence of independent variables on responses. The quadratic eqn 7 for Y1 shows that the PVA concentration (X1) has largest coefficient. It indicated that the PVA concentration (X1) was the most influential factor and had a significant and negative effect on Y1 while for Y2, PVA concentration (X1) and amount of lipid (X2) both have significant positive.
The obtained results can be observed visually in the contour plots and surface plots. Response surface graph of Y1 (fig. 1) shows the decrease in particle size with increase in PVA concentration with fixed quantity of lipid. The effect is primarily ascribed to the enhanced interface stabilization in external aqueous phase. However certain study reported that this phenomenon continues up to certain extent of PVA concentration, above which, increase in viscosity reduce the net shear stress required for droplet break down, leading to increase in the particle size[41,46-48]. In this study, higher level of PVA concentration able to maintain the high shear stress which reduces the particle size. In addition, reduce particle size also increase the surface area of particle that increase the possibility drug attachment to surface and increase the entrapment efficiency.

Figure 1: Contour plot (A) and its Response surface (B) shows effect of X1 and X2 on particle size (Y1) and Entrapment efficiency
Conversely, increase in particle size and EE due to increase in amount of lipid (Y2) as shown in fig. 1 may be explained in terms of enhancement of viscosity of organic phase resulted in resistance alongside the shear force during emulsification. Similarly, increase in the viscosity of organic phase hindered the diffusion of drug to aqueous phase and thereby increase the entrapment efficiency. Furthermore, increase particle size reduces the diffusional drug loss from nanoparticle and increase the drug content[49-51].
The optimization process was performed to develop desirable product by setting the Y1 at minimum and Y2 at maximum while X1 and X2 within the range. The software suggested that X1=0.99 %, X2 =279 mg would yield the desire response, Y1=403.90 nm and Y2= 83.98 %, with 0.972 desirability (D) value (fig. 2). Apart from this numerical optimization method, graphical optimization using response overlay plots were also constructed to visualize optimum value of formulation variables (fig. 3). The overlay plot yellow region represents design space, the common area for exploration of desirable response. However, due to the experimental error uncertainty was found in design space and which is not constant. Therefore, tolerance interval was set at 0.99 with 95 % confidence interval to further improve the design space[52]. These refinements reduce the risk of future batch to produce inconsistence response throughout including boundary of the design space.

Figure 2: Contour plot for overall desirability of SLN as a function of X1 and X2

Figure 3: Overlay plot showing a location of optimized formulation (OB) and Validation batch formulation (VB1-VB3) in design space
Validation of experimental design and polynomial equations were performed by check point analysis. For that, one OB suggested by software based on desirability value and three formulations (VB1-VB3) were randomly selected from the design space in overlay plot were prepare to evaluate the responses (fig. 3). A low value of percentage prediction error (<10 %) in case of OB and check point batches (VB1- VB3) depicted that there was reasonable agreement in predicted and experimental values (Table 6). These results suggest the success of experimental design along with desirability approach for the evaluation and optimization of formulation.
| Batch | Independent Variables | Particle size (Y1) (nm) | Entrapment efficiency (Y2) (%) | |||||
|---|---|---|---|---|---|---|---|---|
| X1 (% w/v) | X2 (mg) | Observed | Predicted | Prediction error (%) | Observed | Predicted | Prediction error (%) | |
| OB | 0.99 | 279 | 395 | 404 | 2.23 | 82.44 | 83.98 | 1.83 |
| VB1 | 0.77 | 222 | 409 | 390 | -4.87 | 67.45 | 71.66 | 5.74 |
| VB2 | 0.41 | 243 | 571 | 539 | -5.94 | 71.64 | 67.09 | -6.78 |
| VB3 | 0.40 | 357 | 627 | 672 | 6.70 | 76.93 | 78.28 | 3.00 |
X1 indicates: PVA concentration (%); X2, amount of lipid (mg); Y1, particle size (nm); Y2, % entrapment efficacy
Table 6: Checkpoint Batch with their Predicted and Observed Value of Responses
Total drug content of optimized formulation was found to be 19.03±0.27 mg indicates smaller amount of drug loss during the preparation of formulation. It may be explained by low aqueous solubility of BER leads to decrease in drug loss during the preparation of formulation.
Drug can be incorporated into SLN by several ways like adsorbed on surface, entrapped in lipid matrix, encapsulated in inner core. As explained in contour plot and 3D surface graph, both independent variables significantly affect entrapment efficiency. PVA is a polymer responsible for particle coating and viscosity. The OB shows highest amount of PVA which cause increase in viscosity of external phase. It facilitates higher amount of drug to incorporate into lipid matrix. The EE of OB was found to be 82.44±2.03 % while DL was 5.67±0.21%. The higher EE may be due to the drug dissolved in lipid matrix remained associated with matrix[53].
Particle size is a key factor that may influence the fate of nanoparticles in the biological system[54]. Photon correlation spectroscopy is the most widely used method for the particle size measurement of SLN.
The optimized formulation OB shows particle size of 395±17.15 nm and 0.0852±0.0112 polydispersity index (fig. 4). The polydispersity index is a sign of homogeneity of size distribution. The particle size of OB indicates that the present method can able to produce the particle in nanometer range. Zeta potential is also an important factor that may influence the stability and in vivo behaviour of SLN[55]. The formulation shows negative zeta potential of -18.30±0.14 mV which may be due to the SA[56]. The higher values of zeta potential enhance the stability of SLN by increasing the repulsion of particle, and thereby preventing aggregation[55].

Figure 4: Particle size of optimized BER-SLN
FTIR study of drug loaded formulation, plain drug, PVA and SA was used to check the interaction and DL in formulation. Fig. 5 illustrated that the characteristic peak of BER 1505.21 cm-1 (aromatic C=C stretching), peak at 1277 cm-1 and 1231 cm-1 (C-O-C stretching), 3554 cm-1 and 3400 cm-1 (C-H stretching) and 3203 cm-1 and 3188 cm-1 (aromatic C-H stretching) has disappear after formulate into SLN indicate the entrapment of drug in lipid matrices. Additionally, PVA peak at 2882 cm-1and 2782 cm-1 (C-H stretching), band appear above 3650 cm-1 (O-H stretching) and 1444 cm-1 (C=O stretching) has also disappear in SLN indicate that no strong chemical interaction occurred between the drug and excipients.

Figure 5: FTIR study of BER, PVA, SA and BER-SLN
The solid state of lipid particles affects the release properties of SLN. XRD is the widely used techniques for determination of crystallinity and polymorphic behaviour of the component of SLN which helps to determine whether a drug will be expelled or firmly incorporated during storage[57]. Fig. 6 shows the XRD patterns of BER, BER-SLN, SA and PVA, The XRD patterns of BER showed the sharp peaks at a different diffraction angle reveal that the drug is present in crystalline form. Similarly, crystalline peak was also observed for SA. However, XRD pattern of BER-SLN showed the diminished peaks of SA indicate reduction in crystallinity, and no characteristic sharp peaks of drug indicate the conversion of crystalline form of drug to amorphous form in SLN. These results confirm the successful wrapping of drug in lipid carrier.

Figure 6: XRD of BER, PVA, SA and BER-SLN
Surface morphology:
SLN were found to be spherical in shape with different size particles as revealed by SEM study (fig. 7).

Figure 7: SEM of BER-SLN
Generally, spherical particle has smallest specific surface area and hence are stabilized with small amount of surfactant. In addition, spherical particles provide controlled release of incorporated drugs due to the longest diffusion pathway[58].
The in vitro release study shows that more than ~60 % of BER was released from BER-SLN while BER suspension shows ~90 % release during the first 4 h followed by slow and continuous release for drug up to 24 h (fig. 8). These may be due to the existence of unincorporated drug in the outer phase and drug adsorbed on surface cause burst release initially which is followed by slow diffusion of encapsulated drug through the lipid matrix[59,60]. These in vitro drug release data were fitted in to Zero order, First order, Higuchi and Korsmeyer-Peppas model to determine the kinetics and mechanism of drug release. Results showed that the data were best fitted in Korsmeyer-Peppas model (R2=0.9719±0.0032) (Table 7). The value of release exponent “n” was found to be 0.2733±0.0064, suggesting Fickian transport mechanism. In this kind of transport, the flux is the rate at which the material diffuses away from the interface[61]. Drug release from SLN is dependent on the diffusion of the drug molecule through lipid matrix and in vivo degradation of lipid matrix.
| Kinetic model | R2 | n | k |
|---|---|---|---|
| Zero order | -1.0947 | - | 5.625 |
| First order | 0.6988 | - | 0.252 |
| Higuchi | 0.6002 | - | 23.776 |
| Korsmeyer-Peppas | 0.9736 | 0.273 | 40.891 |
Table 7: Drug Release Kinetic Modeling of Optimized Batch

Figure 8: In vitro drug release from BER-SLN and BER suspension
The HPLC methods used for estimation of BER showed retention time of 6.374 min. The calibration graph for BER in plasma was linear over the range of 10-700 ng/ ml. The data for calibration graph of BER in plasma by HPLC was fitted to a linear equation Y=83.53X+10.79 with correlation coefficient of R2=0.997, which indicated the linearity of the plot. These results were found to be in compliance with the previously validated bioanalytical method[34].
The single oral dose (50 mg/kg) bioavailability study of BER suspension and BER- SLN are shown fig. 9, Table 8. In this study sparse sampling techniques was utilized to collect the blood of subgroup animal on alternate time interval. Generally, the animal’s physiological limitation obliged the blood sampling methods and for the repeat blood collection at short intervals recommended volume of blood is <1 % of total body weight (0.25 ml) in 24 h. The sampling technique used in present study significantly reduces the number of samples as well as volume of blood from collected from each animal[62].
| Pharmacokinetic parameters | BER suspension | BER-SLN |
|---|---|---|
| Cmax(ng/ml) | 66.88±2.15 | 192.32±5.25* |
| Tmax (h) | 2 | 2 |
| AUC0-24 | 335.39 ± 42.64 | 1321.16±107.81* |
| t1/2 (h) | 2.35 ± 0.86 | 5.71 ± 1.46* |
| MRT (h) | 4.41 ± 0.55 | 8.02 ± 1.21* |
| Relative Bioavailability (F) | --- | 413.69 |
Data were expressed as mean±SD; p<0.05 indicates statistically significant compared with BER suspension
Table 8: Pharmacokinetic Parameters for Single Dose Oral Bioavailability of Plain Ber, Sln

Figure 9: Pharmacokinetic (PK) profiles of BER in rat plasma after oral administration BER-SLN and BER suspension (mean ± SD, n=3/time point)
The mean plasma drug concentration vs. time profile for single oral administration of BER suspension and BER-SLN were shown in fig. 9 and Table 8 shows the calculated pharmacokinetic parameters. The Cmax for BER-SLN (192.32±5.25 ng/ml) was found to be significantly (p<0.05) higher (2.87 fold) than BER suspension (66.88±2.15 ng/ml). Tmax for BER-SLN and BER suspension were found to be 2 h and may be attributed to initial burst release of BER from SLN. Furthermore, the half-life (t1/2) and MRT value of BER-SLN was found to be nearly double compared to BER suspension, which may be due to sustained and complete release of BER from SLN and supported by in vitro release profile. In addition, AUC0-24 for BERSLN (1321.16±107.81 ng h/ml) were found to be significantly (p<0.05) higher than BER suspension (335.39±42.64 ng h/ml). This indicated that BERSLN could improve the bioavailability of BER by 3.94 fold compared to BER suspension. The reason for this improvement in bioavailability may be due to the ability of lipid-based formulations to reach the oral lymphatic region after absorption and reaching to systemic circulation[21,63-65]. Thus, lipid-based formulations could play important role in enhancement of its bioavailability.
The antihyperlipidemic activity of BER-SLN and pure drug (BER) were evaluated in high fat diet induced hyperlipidemic rats. Generally, the consumption of high fat and cholesterol diet affect the lipid profile in plasma. Several studies also confirm that the high fat diet composed of saturated fatty acid (coconut oil) with cholesterol often been used to induce hyperlipidemia in animal models due to abnormal lipid metabolism[39,66-68]. It is also important to note that coconut oil alone does not cause hyperlipidemia without cholesterol supplement[69]. In this study, high fat diet (coconut oil and cholesterol) was administered for 14 d to rats for the induction of hyperlipidemia. Hyperlipidemia was confirmed from increased in TC (+105 %; p<0.0001), TG (+107 %; p<0.0001), LDL-C (+172 %; p<0.0001) and decreased in level of HDL-C (-169 %; p<0.0001), in rats that consumed HFD for 14 d compared to control. However, treatment with BER-SLN significantly reversed the levels of TC (-41 %; p<0.05), TG (-49 %; p<0.0001), LDL-C (-80 %; p<0.0001) and HDL-C (+119 %; p<0.0001) compared to HFD control. BER suspension treatment also show alteration in the level of TC (-21 %; p<0.05), TG (-21 %; p<0.05), LDL-C (-16 %; ns) and HDL-C (+58 %; p<0.05) compared to HFD control (fig. 10). These findings suggest that the prepared BER-SLN was more efficient in controlling hyperlipidemia as compared to BER suspension. These can be attributed to enhance bioavailability of lipid based formulation via various mechanism such as modification of drug release, interaction with enterocyte based transport processes and stimulation of lymphatic transport[65] which was also supported by in vivo pharmacokinetic study. Thus, BER-SLN can be exploited as an antihyperlipidemic therapeutic agent or adjuvant in existing therapy.

Figure 10: Effect of BER-SLN on lipid levels of high-fat diet induced hyperlipidemic rats. Value are expressed as mean±SD of six Rats. NS denoted non-significant, * (p≤0.05) and *** (p≤0.001) denotes value deviate significantly compared to HFD control
The results of the stability study revealed that the formulation remains stable at different condition of temperature and relative humidity (RH) for 1 mo (Table 9). The in vitro release study shows close resembles with initial formulation (fig. 11). These results indicated that the BER-SLN could potentially be exploited as a delivery system with improved drug ee and controlled drug release.
| No of Days | 2-8º (Subfreezing Temperature) |
25º± 2º/60 % RH±5 % RH | 40ºC ± 2ºC/75 %±5 % RH | |||
|---|---|---|---|---|---|---|
| Physical Appearance | Drug Content (mg) | Physical Appearance | Drug Content (mg) | Physical Appearance | Drug Content (mg) | |
| 0 | No Change | 19.034±0.16 | No Change | 19.034±0.16 | No Change | 19.034±0.09 |
| 15 | No Change | 19.018±0.06 | No Change | 19.018±0.05 | No Change | 19.005±0.04 |
| 30 | No Change | 19.018±0.06 | No Change | 19.012±0.05 | No Change | 18.983±0.03 |
Data was expressed as mean± SD(n=3)
Table 9: Stability Study of Optimized Formulation

Figure 11: In vitro drug release of optimized formulation kept at stability condition (A) 2-8º (B) 25º±2º 60 % RH±5 % RH and (C) 40º±2º 75 % ±5 % RH
In summary, the BER-SLN prepared by solvent injection method and optimized by full factorial design can able to release the drug in sustained manner. The BERSLN can also able to improve the relative bioavailability of BER by more than 3.94-fold compared to BER suspension. Moreover, the BER-SLN was more efficient in controlling hyperlipidemia by alleviation of lipid markers in hyperlipidemic rats supports the findings of bioavailability. Thus, BER-SLN could be a potential drug delivery system to enhance the hyperlipidemic effect and benefiting the patients by avoiding repeated and high dose administration.
References
- Mensink RP, Aro A, Den Hond E, German JB, Griffin BA, ten Meer H-U, et al. PASSCLAIM - Diet-related cardiovascular disease. Eur J Nutr 2003;42(1):16-27.
- Nelson RH. Hyperlipidemia as a Risk Factor for Cardiovascular Disease. Prim Care 2013;40(1):195-211.
- Bursill CA, Roach PD. A green tea catechin extract upregulates the hepatic low-density lipoprotein receptor in rats. Lipids 2007;42(7):621-7.
- Chen Z-Y, Jiao R, Ma KY. Cholesterol-lowering nutraceuticals and functional foods. J Agric Food Chem 2008;56(19):8761-73.
- Calpe-Berdiel L, Escolà-Gil JC, Blanco-Vaca F. New insights into the molecular actions of plant sterols and stanols in cholesterol metabolism. Atherosclerosis 2009;203(1):18-31.
- Cho KW, Kim YO, Andrade JE, Burgess JR, Kim Y-C. Dietary naringenin increases hepatic peroxisome proliferators-activated receptor α protein expression and decreases plasma triglyceride and adiposity in rats. Eur J Nutr 2011;50(2):81-8.
- Berrougui H, Grenier G, Loued S, Drouin G, Khalil A. A new insight into resveratrol as an atheroprotective compound: inhibition of lipid peroxidation and enhancement of cholesterol efflux. Atherosclerosis 2009;207(2):420-7.
- Birdsall TC, Kelly GS. Berberine: therapeutic potential of an alkaloid found in several medicinal plants. Altern Med Rev 1997;2(2):94-103.
- Liu X, Li G, Zhu H, Huang L, Liu Y, Ma C, et al. Beneficial effect of berberine on hepatic insulin resistance in diabetic hamsters possibly involves in SREBPs, LXRα and PPARα transcriptional programs. Endocr J 2009;57(10):881-93.
- Lee I-A, Hyun Y-J, Kim D-H. Berberine ameliorates TNBS-induced colitis by inhibiting lipid peroxidation, enterobacterial growth and NF-κB activation. Eur J Pharmacol 2010;648(1):162-70.
- Wu M, Wang J, Liu L-t. Advance of studies on anti-atherosclerosis mechanism of berberine. Chin J Integr Med 2010;16(2):188-92.
- Zhou J, Zhou S. Berberine regulates peroxisome proliferator-activated receptors and positive transcription elongation factor b expression in diabetic adipocytes. Eur J Pharmacol 2010;649(1):390-7.
- Cordell GA, Quinn-Beattie ML, Farnsworth NR. The potential of alkaloids in drug discovery. Phytother Res. 2001;15(3):183-205.
- Kong W, Wei J, Abidi P, Lin M, Inaba S, Li C, et al. Berberine is a novel cholesterol-lowering drug working through a unique mechanism distinct from statins. Nat Med 2004;10(12):1344-51.
- https://go.drugbank.com/drugs/DB04115.
- Zhang X, Qiu F, Jiang J, Gao C, Tan Y. Intestinal absorption mechanisms of berberine, palmatine, jateorhizine, and coptisine: involvement of P-glycoprotein. Xenobiotica 2011;41(4):290-6.
- Shan Y-Q, Ren G, Wang Y-X, Pang J, Zhao Z-Y, Yao J, et al. Berberine analogue IMB-Y53 improves glucose-lowering efficacy by averting cellular efflux especially P-glycoprotein efflux. Metabolism 2013;62(3):446-56.
- Zuo F, Nakamura N, Akao T, Hattori M. Pharmacokinetics of berberine and its main metabolites in conventional and pseudo germ-free rats determined by liquid chromatography/ion trap mass spectrometry. Drug Metab Dispos 2006;34(12):2064-72.
- Liu Y-T, Hao H-P, Xie H-G, Lai L, Wang Q, Liu C-X, et al. Extensive intestinal first-pass elimination and predominant hepatic distribution of berberine explain its low plasma levels in rats. Drug Metab Dispos 2010;38(10):1779-84.
- Tan W, Li Y, Chen M, Wang Y. Berberine hydrochloride: anticancer activity and nanoparticulate delivery system. Int J Nanomed 2011;6:1773.
- Holm R, Porter CJH, Müllertz A, Kristensen HG, Charman WN. Structured triglyceride vehicles for oral delivery of halofantrine: examination of intestinal lymphatic transport and bioavailability in conscious rats. Pharm Res 2002;19(9):1354-61.
- Kalepu S, Manthina M, Padavala V. Oral lipid-based drug delivery systems-an overview. Acta Pharm Sin B 2013;3(6):361-72.
- Bunjes H, Drechsler M, Koch MHJ, Westesen K. Incorporation of the model drug ubidecarenone into solid lipid nanoparticles. Pharm Res 2001;18(3):287-93.
- Schubert MA, Müller-Goymann CC. Solvent injection as a new approach for manufacturing lipid nanoparticles–evaluation of the method and process parameters. Eur J Pharm Biopharm 2003;55(1):125-31.
- Singh S, Dobhal AK, Jain A, Pandit JK, Chakraborty S. Formulation and evaluation of solid lipid nanoparticles of a water soluble drug: zidovudine. Chem Pharm Bull 2010;58(5):650-5.
- Mujtaba MA. Development and Validation of UV-Spectrophotometric Methods for the Determination of Berberine in Polymeric Nanoparticles. Adv Sci Eng Med 2019;11(12):1273-8.
- Muthu MS, Singh S. Studies on biodegradable polymeric nanoparticles of risperidone: in vitro and in vivo evaluation. Nanomed 2008;3(3):305-19.
- Parveen R, Ahmad FJ, Iqbal Z, Samim M, Ahmad S. Solid lipid nanoparticles of anticancer drug andrographolide: formulation, in vitro and in vivo studies. Drug Dev Ind Pharm 2014;40(9):1206-12.
- D’Souza S. A review of in vitro drug release test methods for nano-sized dosage forms. Adv Pharm 2014;2014:304757.
- Li X-X, Li C-B, Xiao J, Gao H-Q, Wang H-W, Zhang X-Y, et al. Berberine Attenuates Vascular Remodeling and Inflammation in a Rat Model of Metabolic Syndrome. Biol Pharm Bull 2015;38(6):862-8.
- https://nc3rs.org.uk/rat-temporary-cannula-non-surgical-updated
- Lee G, Goosens KA. Sampling blood from the lateral tail vein of the rat. JoVE. 2015(99):e52766-e.
- Harstad E, Andaya R, Couch J, Ding X, Liang X, Liederer BM, et al. Balancing blood sample volume with 3Rs: implementation and best practices for small molecule toxicokinetic assessments in rats. ILAR J 2017;57(2):157-65.
- Gui SY, Wu L, Peng DY, Liu QY, Yin BP, Shen JZ. Preparation and evaluation of a microemulsion for oral delivery of berberine. Pharmazie 2008;63(7):516-9.
- Zhang Y, Huo M, Zhou J, Xie S. PKSolver: An add-in program for pharmacokinetic and pharmacodynamic data analysis in Microsoft Excel. Comput Methods Programs Biomed 2010;99(3):306-14.
- Burra M, Jukanti R, Janga KY, Sunkavalli S, Velpula A, Ampati S, et al. Enhanced intestinal absorption and bioavailability of raloxifene hydrochloride via lyophilized solid lipid nanoparticles. Adv Powder Technol 2013;24(1):393-402.
- Ahuja BK, Jena SK, Paidi SK, Bagri S, Suresh S. Formulation, optimization and in vitro and in vivo evaluation of febuxostat nanosuspension. Int J Pharm 2015;478(2):540-52.
- Guido S, Joseph T. Effect of chemically different calcium antagonists on lipid profile in rats fed on a high fat diet. Ind J Exp Biol 1992;30(4):292-4.
- Zulet MA, Barber A, Garcin H, Higueret P, Martinez JA. Alterations in carbohydrate and lipid metabolism induced by a diet rich in coconut oil and cholesterol in a rat model. J Am Coll Nutr 1999;18(1):36-42.
- Saravanan M, Pandikumar P, Prakash Babu N, Ignacimuthu S. Antihyperlipidemic activity of Ichnocarpus frutescens in triton WR-1339-induced and high-fat diet animals. Pharm Biol 2011;49(10):1074-81.
- Duong V-A, Nguyen T-T-L, Maeng H-J. Preparation of Solid Lipid Nanoparticles and Nanostructured Lipid Carriers for Drug Delivery and the Effects of Preparation Parameters of Solvent Injection Method. Molecules 2020;25(20):4781.
- Kumar S, Randhawa JK. Solid lipid nanoparticles of stearic acid for the drug delivery of paliperidone. RSC Adv 2015;5(84):68743-50.
- Mohanty B, Majumdar DK, Mishra SK, Panda AK, Patnaik S. Development and characterization of itraconazole-loaded solid lipid nanoparticles for ocular delivery. J Pharm Dev Technol 2015;20(4):458-64.
- Mendenhall W, Sincich T. A second course in statistics : regression analysis. 7 ed. Frenches Forest, NSW: Pearson; 2020.
- Archdeacon TJ. Correlation and regression analysis: a historian's guide. 1 ed: Univ of Wisconsin Press; 1994.
- Chorny M, Fishbein I, Danenberg HD, Golomb G. Lipophilic drug loaded nanospheres prepared by nanoprecipitation: effect of formulation variables on size, drug recovery and release kinetics. J Control Release 2002;83(3):389-400.
- Zweers MLT, Grijpma DW, Engbers GHM. The preparation of monodisperse biodegradable polyester nanoparticles with a controlled size. J Biomed Mater Res B Appl Biomater 2003;66(2):559-66.
- Budhian A, Siegel SJ, Winey KI. Haloperidol-loaded PLGA nanoparticles: systematic study of particle size and drug content. Int J Pharm 2007;336(2):367-75.
- Sharma N, Madan P, Lin S. Effect of process and formulation variables on the preparation of parenteral paclitaxel-loaded biodegradable polymeric nanoparticles: A co-surfactant study. Asian J Pharm Sci 2016;11(3):404-16.
- Bhalekar M, Upadhaya P, Madgulkar A. Formulation and characterization of solid lipid nanoparticles for an anti-retroviral drug darunavir. Appl Nanosci 2017;7(1):47-57.
- Kushwaha AK, Vuddanda PR, Karunanidhi P, Singh SK, Singh S. Development and Evaluation of Solid Lipid Nanoparticles of Raloxifene Hydrochloride for Enhanced Bioavailability. Biomed Res Int 2013;2013:584549.
- Zacour BM, Drennen Iii JK, Anderson CA. Development of a fluid bed granulation design space using critical quality attribute weighted tolerance intervals. J Pharm Sci 2012;101(8):2917-29.
- Müller RH, Mäder K, Gohla S. Solid lipid nanoparticles (SLN) for controlled drug delivery- a review of the state of the art. Eur J Pharm Biopharm 2000;50(1):161-77.
- Maherani B, Arab-Tehrany E, Kheirolomoom A, Reshetov V, Stebe MJ, Linder M. Optimization and characterization of liposome formulation by mixture design. Analyst 2012;137(3):773-86.
- Mishra V, Bansal KK, Verma A, Yadav N, Thakur S, Sudhakar K, et al. Solid Lipid Nanoparticles: Emerging Colloidal Nano Drug Delivery Systems. Pharmaceutics 2018;10(4):191.
- Derkani MH, Fletcher AJ, Fedorov M, Abdallah W, Sauerer B, Anderson J, et al. Mechanisms of Surface Charge Modification of Carbonates in Aqueous Electrolyte Solutions. Colloid Interface 2019;3(4):62.
- Souto EB, Mehnert W, Müller RH. Polymorphic behaviour of Compritol® 888 ATO as bulk lipid and as SLN and NLC. J Microencapsul 2006;23(4):417-33.
- Shah R, Eldridge D, Palombo E, Harding I. Lipid Nanoparticles: Production, Characterization and Stability. 1 ed: Springer International Publishing; 2015:97.
- Esmaeili F, Hosseini-Nasr M, Rad-Malekshahi M, Samadi N, Atyabi F, Dinarvand R. Preparation and antibacterial activity evaluation of rifampicin-loaded poly lactide-co-glycolide nanoparticles. Nanomed 2007;3(2):161-7.
- Misra R, Acharya S, Dilnawaz F, Sahoo SK. Sustained antibacterial activity of doxycycline-loaded poly (D, L-lactide-co-glycolide) and poly (ε-caprolactone) nanoparticles. Nanomed 2009;4(5):519-30.
- Colombo P, Santi P, Bettini R, Brazel C, Peppas N. Drug release from swelling controlled systems. In: Wise DL, editor. Handbook of Pharmaceutical Controlled Release Technology. New York: CRC Press; 2000;183-209.
- Diehl KH, Hull R, Morton D, Pfister R, Rabemampianina Y, Smith D, et al. A good practice guide to the administration of substances and removal of blood, including routes and volumes. J Appl Toxicol. 2001;21(1):15-23.
- Hauss DJ. Oral lipid-based formulations: enhancing the bioavailability of poorly water-soluble drugs: CRC Press; 2007.
- Porter CJH, Trevaskis NL, Charman WN. Lipids and lipid-based formulations: optimizing the oral delivery of lipophilic drugs. Nat Rev Drug Discov 2007;6(3):231-48.
- Chakraborty S, Shukla D, Mishra B, Singh S. Lipid-an emerging platform for oral delivery of drugs with poor bioavailability. Eur J Pharm Biopharm 2009;73(1):1-15.
- Nicolosi RJ, Stucchi AF, Kowala MC, Hennessy LK, Hegsted DM, Schaefer Inc EJ. Effect of dietary fat saturation and cholesterol on LDL composition and metabolism. In vivo studies of receptor and nonreceptor-mediated catabolism of LDL in cebus monkeys. Arteriosclerosis 1990;10(1):119-28.
- Hu FB, Manson JE, Willett WC. Types of dietary fat and risk of coronary heart disease: a critical review. J Am Coll Nutr 2001;20(1):5-19.
- Fernandez ML, West KL. Mechanisms by which dietary fatty acids modulate plasma lipids. J Nutr 2005;135(9):2075-8.
- Castillo M, Hortal JH, Gil-Villarino A, Luque P, Iglesias J, Garci´a-Peregri´n E. Differential effects of dietary fat on chick plasma and liver composition and HMG-CoA reductase activity. J Nutr Biochem 1999;10(4):198-204.