- *Corresponding Author:
- K. P. Bhusari
Department of Pharmaceutical Chemistry
Sharad Pawar College of Pharmacy
Wanadongri, Hingna Road
Nagpur-441 110, India
E-mail: seemadhole@gmail.com
| Date of Submission | 06 April 2009 |
| Date of Revision | 30 July 2009 |
| Date of Acceptance | 22 August 2009 |
| Indian J Pharm Sci, 2009, 71 (5): 505-508 |
Abstract
Two methods for simultaneous estimation of hydrochlorothiazide and olmesartan medoxomil in combined tablet dosage form have been developed. The first method is the application of Q-analysis method (absorbance ratio), which involves the formation of Q-absorbance equation at 264 nm (isobestic point) and at 271 nm, the maximum absorption of hydrochlorothiazide. The linearity ranges for hydrochlorothiazide and olmesartan medoxomil were 2.5-22.5 μg/ml and 4-36 μg/ml, respectively. The second method is based on the derivative spectrophotometric method at zero crossing wavelengths. The linearity ranges for hydrochlorothiazide and olmesartan medoxomil were 2.5-20 μg/ml and 4-32 μg/ml, respectively. The accuracy of the methods were assessed by recovery studies and was found to be 100.45% ±0.4215 and 100.24% ±0.3783 for absorbance ratio method and 99.39% ±0.221 and 99.72% ±0.11 for first derivative method, for hydrochlorothiazide and olmesartan medoxomil, respectively. These methods are simple, accurate and rapid, those require no preliminary separation and can therefore be used for routine analysis of both drugs in quality control laboratories.
Keywords
Derivative and Q-analysis spectrophotometric methods, hydrochlorothiazide, olmesartan medoxomil
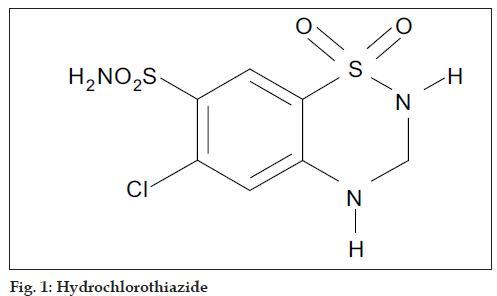
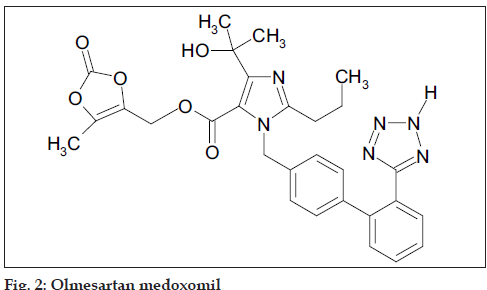
Hydrochlorothiazide (HCTZ), chemically 6-chloro-3,4- dihydro-2H-1,2,4-benzothiadi- azine-7-sulphonamide- 1,1-dioxide, is a diuretic and antihypertensive drug, which inhibits the reabsorption of sodium and calcium at the beginning of distal convoluted tubules. The chemical structure of HCTZ is shown in fig. 1. The typical dose of HCTZ is 12.5 mg per day [1-5]. Literature survey revealed that HPLC, HPTLC and spectroscopic methods have been reported for its determination in combination with other drugs [6-17]. Olmesartan medoxomil (OLME), chemically (5-methyl-2-oxo-1,3-dioxolen-4-yl)methyl-4-(1- hydroxyl-1-methylethyl)-2-propyl-1- [4-{2-(tetrazol-5- yl)-phenyl}-phenyl]methylimidaz-ole-5-carboxylate is a prodrug used as antihypertensive, which blocks the vasoconstrictor effect of angiotensin-II by selectively blocking the binding of angiotensin-II to the AT1 receptor in vascular smooth muscle [18-21]. Literature survey reveals that capillary zone electrophoresis method is reported for its estimation alone and HPTLC method has been reported for its estimation in combination with HCTZ [22,23]. The dose of OLME is 20 mg daily and its structure is shown in fig. 2. A combination of drugs, HCTZ (12.5 mg) and OLME (20 mg) in tablet formulation is available commercially (Olmezest-H 20, Sun Pharmaceutical Industries Ltd., Mumbai, India). However, no spectrophotometric method has yet been reported for simultaneous estimation of HCTZ and OLME. Hence, an attempt has been made to develop and validate, in accordance with ICH guidelines, a simple, precise, accurate and economical spectrophotometric method for quantitative analysis of HCTZ and OLME in combined tablets [24,25].
Materials and Methods
Pharmaceutically pure sample of HCTZ and OLME were obtained as generous gifts from Golden Cross Pvt. Ltd., Daman, India and MSN Laboratories Pvt. Ltd., Medak, India, respectively. Methanol AR grade (Merck Ltd., Mumbai, India) was used as solvent in the study. Double beam UV/Vis spectrophotometer, Shimadzu model 1601 with a pair of 10 mm matched quartz cells was used to measure absorbance of the resulting solution.
Preparation of standard stock solution
Accurately, 50 mg each of HCTZ and OLME was weighed separately and transferred to two different 50 ml volumetric ß ask. Each drug was dissolved in methanol and volume was made up to the mark with methanol. The standard stock solution (1000 µg/ml) were further diluted separately to obtain working standard solution of concentration 7.5 µg/ml of HCTZ and 12.0 µg/ml of OLME.
Study of spectra and selection of wavelengths
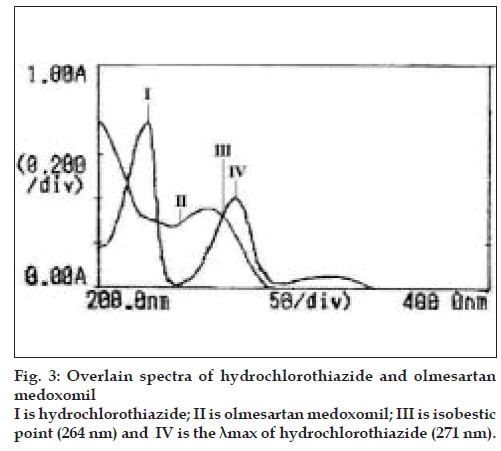
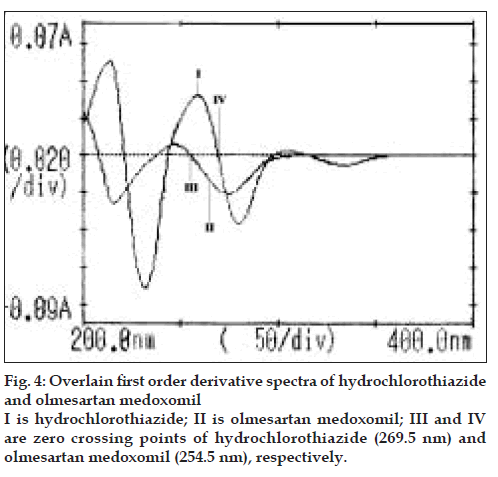
Each working standard solution was scanned between the range 200-400 nm in 1 cm cell against blank. The zero and first order derivative absorption spectra were recorded. Two wavelengths were selected from the overlain zero order spectra (fig. 3), 264 nm (Isobestic point) and 271 nm (λmax of HCTZ) for formation of Q-absorbance equation. The peak amplitude of first derivative spectra (fig. 4) was measured at 254.5 nm and 269.5 nm for HCTZ and OLME, respectively.
Procedure for analysis of tablet formulation
Twenty tablets were accurately weighed and average weight was calculated. The tablets were triturated to a fine powder. An accurately weighed quantity of powder equivalent to 60 mg of OLME was dissolved in methanol and volume was made up to 50 ml. The solution was filtered through Whatmann filter paper No. 41 and aliquot portion of filtrate was diluted to produce solution of 7.5 μg/ml of HCTZ and 12 μg/ml of OLME. The absorbance of sample solution was measured at selected wavelengths and the concentrations of the two drugs were estimated using absorbance ratio and first order derivative methods. The analysis procedure was repeated six times and the results are depicted in Table 1.
| Drugs | Q-analysis method% ±SD (n=6) | First order derivative method% ±SD (n=6) |
|---|---|---|
| HCTZ | 100.23±0.360 | 99.86±0.428 |
| OLME | 100.34±0.416 | 99.90±0.486 |
SD is standard deviation. HCTZ is hydrochlorothiazide and OLME is olmesartan medoxomil.
Table 1: Results of Analysisof Tablet Formulation
Results and Discussion
In quantitative estimation of two components by Q-analysis method, absorbances were measured at the isobestic wavelength and maximum absorption wavelength of one of the two drugs. From overlain spectra of HCTZ and OLME (fig. 3), absorbances were measured at the selected wavelengths i.e., 264 nm (isobestic point) and at 271 nm, the maximum absorption of HCTZ. The absorptivity coefficients of each drug at both wavelengths were determined. The concentration of each drug in laboratory mixture and tablet formulation was determined by substituting the absorbance and absorptivity coefficients in the following sets of equations, Cx= Qm-Qy/Qx-Qy×A/ Ax1 (Eqn. 1) and Cy= Qm-Qx/Qy-Qx×A/Ay1 (Eqn. 2), where, Cx is the concentration of HCTZ, Cy is the concentration of OLME, Qm is the ratio of absorbance of sample at selected wavelengths, Qx is the ratio of absorptivity coefficients of HCTZ, Qy is the ratio of absorptivity coefficients of OLME, Ax1 is absorptivity coefficient of HCTZ at 264 nm, Ay1 is absorptivity coefficient of OLME at 264 nm.
Upon examining the first derivative spectra of the two drugs (fig. 4), it can be noticed that HCTZ can be determined at 254.5 nm where OLME has no contribution and OLME can be determined at 269.5 nm where HCTZ shows a zero crossing. The concentrations of drugs were determined from the standard calibration curve of HCTZ and OLME, respectively by interpolation method. A= 0.0028c+0.0009, r= 0.9977 (λ= 254.5nm) (Eqn. 3) and A= 0.0016c+0.0002, r= 0.9998 (λ= 269.5nm) (Eqn. 4), where, c is the concentration in µg/ml, A is the peak amplitude of the first derivative curves at 254.5 nm and 269.5 nm for HCTZ and OLME respectively, r is correlation coefficient. The peak amplitude of first derivative spectra was measured at 254.5 nm and 26.5 nm for HCTZ and OLME, respectively. The amount of the two drugs was calculated from the computed regression Eqns. 3 and 4. The results are depicted in Table 1.
The methods were validated with respect to linearity, limit of detection (LOD), limit of quantification (LOQ), precision, accuracy and ruggedness. To study accuracy of the developed methods, recovery studies were carried out using standard addition method at three different levels. Percent recovery and low relative standard deviation value shows accuracy of the spectrophotometric methods. For precision of methods, the relative standard deviation for six replicates of sample solution was less than 2%, which met the acceptance criteria established for spectrophotometric methods. Ruggedness of the proposed method was determined by analysis of sample solution prepared by proposed methods between different days and analysts. The percent relative standard deviation reported was found to be less than 2% showed ruggedness of the spectrophotometric methods. The results obtained are summarized in Tables 2 and 3.
| Method | Spike level(μg/ml) | Percent recovery% ± SD (n=6) | ||
|---|---|---|---|---|
| HCTZ | OLME | HCTZ | OLME | |
| I | 1.5 | 2.4 | 100.40±0.420 | 100.19±0.371 |
| II | 1.5 | 2.4 | 99.18±0.211 | 99.84±0.112 |
| I | 3.0 | 4.8 | 100.28±0.463 | 99.88±0.391 |
| II | 3.0 | 4.8 | 99.36±0.312 | 99.62±0.231 |
| I | 4.5 | 7.2 | 100.35±0.388 | 100.28±0.360 |
| II | 4.5 | 7.2 | 99.62±0.201 | 99.71±0.099 |
Method I is the Q-analysis method and Method II is the first order derivative. HCTZ is hydrochlorothiazide and OLME is olmesartan medoxomil
Table 2: Results of Recovery Studies In Tablet Formulation
| Parameters | Absorbance ratio method | First order derivative method | ||
|---|---|---|---|---|
| HCTZ | OLME | HCTZ | OLME | |
| Slope | 0.081 | 0.0325 | 0.0028 | -0.0016 |
| Intercept | 0.0149 | 0.0038 | 0.00009 | 0.0002 |
| Correlation coefÞcient | 0.9997 | 0.9998 | 0.9997 | 0.9997 |
| Linearity range | 2.5-22.5 µg/ml | 4-36 µg/ml | 2.5-20 µg/ml | 4-32 µg/ml |
| LOD(μg/ml) | 0.58 | 0.61 | 0.6 | 0.7 |
| LOQ(μg/ml) | 0.95 | 1.2 | 0.9 | 1.1 |
| Precision (% RSD) | 0.359 | 0.414 | 0.416 | 0.483 |
| Intra day (n=3) %± SD | 100.33±0.088 | 100.63±0.121 | 99.70±0.711 | 99.62±0.705 |
| Inter day (n=3) %± SD | 99.78±0.224 | 99.23±0.297 | 100.22±0.890 | 100.23±0.761 |
| Different analyst (n=3) %± SD | 100.83±0.030 | 100.26±0.064 | 99.64±0.442 | 99.61±0.457 |
LOD is limit of detection; LOQ is limit of quantification; % RSD is percentage relative standard deviation. HCTZ is hydrochlorothiazide and OLME is olmesartan medoxomil.
Table 3: Validation Parameters
The proposed UV spectrophotometric methods are a simple, accurate, precise, rapid and economical for the simultaneous estimation of HCTZ and OLME in tablet dosage form. The proposed methods use inexpensive reagents, solvents and instruments that are available in laboratories. Hence, these methods can be conveniently adopted for the routine analysis in quality control laboratories.
Acknowledgements
Authors are thankful to the Manager, Golden Cross Pvt. Ltd., Daman, India and MSN Lab. Pvt. Ltd., Medak, India, respectively for providing the gift samples of drugs and also thankful to Principal, Sharad Pawar College of Pharmacy, Nagpur, India for providing experimental facilities for this work.
References
- Indian Pharmacopoeia, Vol. 1, Government of India, Ministry of wealth and family welfare. New Delhi: The Controller of Publication; 1996. p. 370-2.
- British Pharmacopoeia, Vol. 1, Department of Health and Social Services for Northern Ireland, London: Stationery Publications; 1998.1727-8.
- The United State Pharmacopoeia 24 and National Formulary 19, Asian ed. Rockville MD: United State Pharmacopoeial Convention Inc; 2000.820-1.
- Budavari S. The merck index: An encyclopedia of chemicals, drugs and biologicals, 13th ed. Merck Research Laboratories, Whitehouse Station, NJ: Merck and Co. Inc.; 2001. p. 854.
- Sweetman SC. Martindale: The complete drug reference. 33rd ed. London: The Pharmaceutical Press; 2002. p. 907.
- Pawar S, Phadke M, Jadhav V. Simultaneous spectrophotometric estimation of Lisinopril and Hydrochlorothiazide tablet using a stability indicating RP-HPLC method. Indian Drugs 2006;43:429-32.
- Suhagia BN, Shah RR, Pate DM. Development of RP-HPLC method for Losartan potassium and Hydrochlorothiazide. Indian J Pharm Sci 2005;67:37-42.
- Jain SK, Jain D, Tiwari M, Chaturvedi SC. Simultaneous spectrophotometric estimation of Propanolol and Hydrochlorothiazide in formulation. Indian J Pharm Sci 2002;64:267-76.
- Prasad CVN, Parihar C, Sunil K, Parimoo P. Simultaneous determination of amiloride HCl, hydrochlorothiazide and atenolol in combined formulations by derivative spectroscopy. J Pharm Biomed Anal 1998;17:877-84.
- Hillaert S, Grauwe KD, Bossche WD. Simultaneous determination of hydrochlorothiazide and several inhibitors of angiotensin-converting enzyme by capillary electrophoresis. J Chromatogr A 2001;924:439-49.
- Gindy A, Ashour A, Fattah LA, Shabana MM. Application of LC and HPTLC−densitometry for simultaneous determination of benazepril hydrochloride and hydrochlorothiazide. J Pharm Biomed Anal 2001;25:171-9.
- Saglik S, Sagirli O, Atmaca S, Erosy L. Simultaneous determination of fosinopril and hydrochlorothiazide in tablets derivative spectrophotometric and high-performance liquid chromatographic method. Anal Chim Acta 2001;427:253-7.
- Erk N. Analysis of binary mixtures of losartan potassium and hydrochlorothiazide by using high-performance liquid chromatography, ratio derivative and compensation technique. J Pharm Biomed Anal 2001;24:603-11.
- Dinc E, Baleanu D. Spectrophotometric quantitative determination of cilazapril and hydrochlorothiazide in tablets by chemometric method. J Pharm Biomed Anal 2002;30:715-23.
- Takubo T, Okada H, Ishii M, Hara K, Ishii Y. Sensitive and selective liquid chromatography-electrospray ionization tandem mass spectrometry analysis of hydrochlorothiazide in rat plasma. J Chromatogr B 2004;806:199-203.
- Razak OA. Electrochemical study of hydrochlorothiazide and its determination in urine and tablets. J Pharm Biomed Anal 2004;34: 433-40.
- Lusina M, Cindric T, Tomaic J, Peko M, Pozaic L, Musulin N. Stability study of losartan/hydrochlorothiazide tablets. Int J Pharm 2005;291: 127-37.
- Tripathi KD. Essentials of medical pharmacology. 5th ed. New Delhi: Jaypee Brothers, Medical Publishers; 2005. p. 528-32.
- Budavari S. The Merck Index: An encyclopedia of chemicals, drugs and biologicals, 13th ed. Merck research laboratories, Whitehouse Station, NJ: Merck and Co. Inc.; 2001. p. 1223-4.
- Puchler K, Laeis P, Stumpe KO. A comparison of the efficacy and safety of the oral angiotensin II antagonist Olmesartan medoxomil with those of atenolol inpatients with moderate to severe hypertension under continuous treatment with hydrochlorothiazide. J Pharm Biomed Anal 2001;19:153-9.
- Krentz R, Bolbrinker J, Huber M. Pharmacokinetic of Olmesartan medoxomil plus Hydrochlorothiazide combination in healthy subjects. Clin Drug Invest 2006;26: 29-34.
- Celebier M, Altinoz S. Development of a CZE method for the determination of Olmesartan medoxomil in tablets. Chromatographia 2007;66:929-33.
- Shah NJ, Suhagia BN, Shah RR, Patel NM. Development and validation of a simultaneous HPTLC method for the estimation of olmesartan medoxomil and hydrochlorothiazide in tablet dosage form. J Pharm Sci 2007;69:834-6.
- ICH guidelines Q2B validation of analytical procedures: Methodology International Conference on Harmonization, Geneva, March 1996.
- Beckett AH, Stanlake JB. Practical Pharmaceutical Chemistry. 4th ed. Part 2, New Delhi: CBS Publishers and Distributors; 1997. p. 282-99.


