- *Corresponding Author:
- Nongzhang Xu
Department of Pharmacy, Sijing Hospital of Songjiang District, Songjiang, Shanghai 201601, China
E-mail: Long1983805@126.com
| This article was originally published in a special issue, “Emerging Therapeutic Interventions of Biopharmaceutical Sciences” |
| Indian J Pharm Sci 2024:86(3) Spl Issue “363-371” |
This is an open access article distributed under the terms of the Creative Commons Attribution-NonCommercial-ShareAlike 3.0 License, which allows others to remix, tweak, and build upon the work non-commercially, as long as the author is credited and the new creations are licensed under the identical terms
Abstract
Cytokine-induced apoptosis inhibitor 1 is a protein involved in controlling apoptosis and programmed cell death. The role of cytokine-induced apoptosis inhibitor 1 against lipopolysaccharide-induced myocardial damage remains unclear. The research aimed to assess cytokine-induced apoptosis inhibitor 1 protective function against lipopolysaccharide-induced myocardial damage and the mechanism underlying it. In vivo and in vitro sepsis models were developed using lipopolysaccharide-induced male C57BL/6 mice and H9c2 cardiomyocytes. Our study found that lipopolysaccharide-induced myocardial tissue in mice decreased cytokine-induced apoptosis inhibitor 1 expression while elevating interleukin-1 beta, interleukin-6, and tumor necrosis factor-alpha levels. Moreover, cytokine-induced apoptosis inhibitor 1 was also decreased in the lipopolysaccharide-induced H9c2 cardiomyocytes. Overexpression of cytokine-induced apoptosis inhibitor 1 in the lipopolysaccharide+LV-cytokine-induced apoptosis inhibitor 1 group cells inhibited cell proliferation, the apoptotic rate, cellular reactive oxygen species, and oxidative stress. The cytokine-induced apoptosis inhibitor 1 overexpression also remarkably attenuated the release of inflammatory cytokines. Furthermore, cytokine-induced apoptosis inhibitor 1 overexpression potentially increases silent information regulator 1 expression and suppresses thioredoxin interacting protein, NOD-like receptor protein 3 and caspase-1 p10 protein expressions in the lipopolysaccharide+LV-cytokine-induced apoptosis inhibitor 1 group cells. These findings indicate that cytokine-induced apoptosis inhibitor 1 potentially improves lipopolysaccharide-induced myocardial injury by attenuating silent information regulator 1-dependent NOD-like receptor protein 3 inflammasome activation, providing a therapeutic strategy to prevent and treat lipopolysaccharide -induced myocardial injury.
Keywords
Cytokine, apoptosis, lipopolysaccharide, myocardial injury, NOD-like receptor, cardiac dysfunction
Myocardial damage is a critical component of sepsis-related multi organ failure. According to recent reports, 20 %-60 % of patients with sepsis have sepsis-related myocardial damage and cardiac disorders[1,2]. Patients with sepsis accompanied by cardiac damage had a greater death risk than those without it[3]. However, the only therapeutic options for this fatal disease are supportive treatments. Therefore, it is critical to identify methods to reduce myocardial damage during sepsis.
Various mechanisms are involved to play a role in the development of sepsis-induced myocardial damage and cardiac dysfunction, including oxidative stress injury, persistent inflammatory responses, autonomic nervous system dysregulation, and mitochondrial dysfunction, with excessive inflammation being significant[4-6]. Pyroptosis is a sort of death caused by inflammation. Pyroptosis has an impact on the development of sepsis and its associated organ dysfunction, including sepsis-induced cardiac failure[7-10]. It has been shown to be predominantly induced by the formation and inflammasome activation[11]. The inflammasome known as NOD-Like Receptor Protein 3 (NLRP3), which belongs to the NOD-Like Receptor (NLR) group, is commonly thought to be critical in the development of sepsis-induced cardiac damage[10,12]. When activated, NLRP3 binds caspase-1 to generate inflammasomes and activates caspase-1, which increases Interleukin-1 Beta (IL-1β) maturation and release into the extracellular domain, triggering an inflammatory response[13]. Furthermore, Silent Information Regulator 1 (SIRT1), a Nicotinamide Adenine Dinucleotide (NAD+)-dependent deacetylase that modulates protein activities, has inhibited NLRP3 inflammasome activation[14,15]. Therefore, stimulation of SIRT1-dependent pathways has emerged as a possible therapeutic method for treating Lipopolysaccharide (LPS)-induced myocardial damage.
The Cytokine-Induced Apoptosis Inhibitor 1 (CIAPIN1) gene produces the CIAPIN1 protein, which may be detected in the mitochondria, nucleus, and cytoplasm[16,17]. Anamorsin, or CIAPIN1, is an anti-apoptotic protein with no sequence resemblance to members of the B-cell lymphoma -2 (Bcl-2) or caspase protein families. It highly regulates RAS signaling pathways and has a role in maintaining fetal hepatic hematopoiesis[18]. CIAPIN1 is physiologically expressed in various organs, notably those that regenerate or proliferate.
It may serve as an indication of prognosis, diagnosis, and therapeutic target in a variety of human malignancies[19]. CIAPIN1 expression has been associated with an oncogene or tumor suppressor in various solid malignancies[19]. However, its expression level, biological function, and mechanism in LPS-induced myocardial injury have yet to be fully understood. Therefore, this research aimed to examine the effects of CIAPIN1 on LPS-induced myocardial damage and the precise underlying molecular mechanism.
Materials and Methods
Animals:
We procured male C57BL/6 mice, (8-10) w old, from Shanghai SLAC Laboratory Animal Co., Ltd. The mice were housed in surroundings free of particular infections, controlled at humidity 50 %-60 % at air and 22°-24° temperature on a 12 h light-dark cycle. The mice were given full access to food and water. The ethics committee of our hospital approved all animal experimental procedures.
Animal experiments:
The experiment used sixteen mice allocated randomly into two distinct groups. The mice received an intraperitoneal administration of LPS (10 mg/kg, L2630, Sigma) or an equivalent amount of 0.9 % saline solution. After 24 h, the mice were anaesthetized through the injection of pentobarbital sodium and subsequently euthanized. The blood and ventricular myocardium were harvested.
Immunohistochemistry (IHC) analysis:
An IHC examination was conducted on the myocardial tissue samples obtained from mice. The tissue sections were overnight incubated at 4° with primary antibodies targeting CIAPIN1 (dilution 1:100; catalogue number ab154904, Abcam). The slides were then treated with a secondary antibody produced in goats against rabbit immunoglobulins for 1 h at ambient temperature before being stained with 3, 3′-Diaminobenzidine (DAB). Sections were imaged on a microscope.
Cell culture:
H9c2 rat cardiomyocytes were grown in a Dulbecco’s Modified Eagle’s Medium (DMEM) culturing medium containing 10 % Fetal Bovine Serum (FBS) and antibiotics (streptomycin/penicillin). To generate an in vitro model of septic cardiomyopathy, we used 0, 0.5, 1, 2.5, 5, and 10 μg/ml doses of LPS in H9c2 cells for 24 h.
Lentiviral packaging and transduction:
To overexpress the CIAPIN1 gene in H9c2 cells, human CIAPIN1-complementary Deoxyribonucleic Acid (cDNA) sequences were cloned into lentiviral vector pCDH-CMV (LM-8070, LMAI Bio) and packaged in 293T cells. We were grown transfected cells at 37° for 48 h to generate lentiviral particles. To increase the expression of CIAPIN1, we transfected H9c2 cells with the lentiviral particles and grown for 48 h. We then selected the stable clones and grown in a culturing medium containing puromycin (1 μg/ml) and were evaluated using Western blot analysis.
Cell grouping:
After transfection with pCDH-CMV-CIAPIN1 (LV-CINPIN1) and pCDH-CMV-GFP (LV-con), using Lipofectamine 3000 for (6-8) h, the H9c2 cells were injected with 5 μg/ml LPS for further 24 h. Cells were grouped into the control group, treated with saline; the LPS group, treated with LPS (5 μg/ml); the LPS+LV-control group, transfected with pCDH-CMV-GFP and treated with LPS (5 μg/ml) and LPS+LV-CINPIN1 group, transfected with pCDH-CMV-CIAPIN1 and treated with LPS (5 μg/ml).
3,4, (5-Dimethylthiazol-2-yl)-2,5 Diphenyl Tetrazolium Bromide (MTT) assay:
We plated H9c2 cells on 96-well culture plates at 1×10⁴ per well density. The cells were then subjected to MTT solution (1 mg/ml, M1020, Solarbio, Beijing, China) for 4 h at 37°. Formazan crystals were solubilized with 100 μl of Dimethyl Sulfoxide (DMSO) in each well. The plate was assessed at 570 nm using a microplate reader.
Cell apoptosis:
The Annexin V-Fluorescein Isothiocyanate (FITC) test kit (CA1020, Solarbio, Beijing, China) was used to assess the apoptotic rate. We have grown H9c2 cells in a 24-well plate and seeded 5×10⁴ cells/well. Subsequently, we treated the cells and incubated them for 48 h. The cells were removed using trypsin and subsequently incubated at room temperature for 15 min with Annexin FITC and Propidium Iodide (PI). The apoptotic rate was estimated by flow cytometry.
Intracellular Reactive Oxygen Species (ROS) level evaluation:
We used Dihydroethidium (DHE); (Beyotime; Cat., no: S0063) staining to measure the cellular ROS level. Intracellular superoxide anions dehydrate DHE to form ethidium, which subsequently binds to Ribonucleic Acid (RNA) or DNA within living cells and emits red fluorescence. The red fluorescence intensity is related to the amount of intracellular superoxide generated. H9c2 cells were seeded in 24-well plates at a density of 1×10⁵ per well. DHE (10 m) was then introduced into the cells and agitated for 30 min at 37° before being treated with 100 nM Selenium (Se) and 200 mM Homocysteine (Hcy) for 24 h. In subsequent therapy, the fluorescence of the cells was examined with a fluorescent microscope at 200X magnification after washing with Phosphate-Buffered Saline (PBS).
Measurement of oxidative stress indicators:
The cardiac fibroblasts were homogenized (10 %, w/v) for measuring oxidative stress biomarkers. The cell lysate was then frozen at -80° in the refrigerator. A commercial kit was used to assess Malondialdehyde (MDA) (S0131S, Beyotime, Shanghai, China), Superoxide Dismutase (SOD) (S0109, Beyotime), and Catalase (CAT) (S0051, Beyotime) activities, and a previously described procedure was utilized to determine the degree of oxidative stress[20].
Cellular immunofluorescence:
The method of immunofluorescence was executed in accordance with the established protocol[21]. Fibroblasts of the cardiac origin in mice were retrieved from cryosections. Following a series of three rinses in PBS, the specimens were treated with Terminal Deoxynucleotidyl Transferase dUTP Nick End Labeling (TUNEL) (C1086, Beyotime) and 4,6-Diamidino-2-Phenylindole (DAPI) (S0063, Beyotime) and subsequently observed using an inverted microscope (IX51, Olympus, Japan).
Measurement of inflammatory cytokines:
The inflammatory cytokines levels in H9c2 cells lysate were assessed using an Enzyme-Linked Immunosorbent Assay (ELISA). Supernatants were collected after various treatments, and (IL-1β, MLB00C), IL-6 (IL-6, M6000B), and Tumor Necrosis Factor-Alpha (TNF-α) (TNF-α, MTA00B) levels were evaluated using ELISA kits (R&D Systems Inc, Minneapolis, Minnesota, United States of America (USA)). The amount of cytokines was represented in pg/ml.
Real-Time quantitative Polymerase Chain Reaction (RT-qPCR):
H9c2 cells’ total RNA was isolated via the TRIzol method (Invitrogen) and employed as templates (1 μg) for cDNA synthesis utilizing a PrimeScript RT Reagent kit (TaKaRa Bio Inc, Dalian, China). RT-qPCR analysis was conducted using a Takara SYBR Green RT-qPCR kit on an applied Biosystems 7500 real-time PCR system (California, USA), with Glyceraldehyde 3-Phosphate Dehydrogenase (GAPDH) serving as an endogenous control. The PCR primer sequences utilized in the study are presented in Table 1. The RT-qPCR conditions comprised a 7 min denaturation step at 95°, followed by 40 cycles of 15 s at 95° and 1 min at 60°. The relative messenger RNA (mRNA) expression levels were determined using the 2-ΔΔCt method[22].
| Genes | Forward primer (5′-3′) | Reverse primer (5′-3′) |
|---|---|---|
| Mouse CIAPIN1 | GGAGTTTGGGATCTCCCCTG | ACCCGACAGAATGACATCGAA |
| Mouse IL-1β | CAGGATGAGGACATGAGCACC | CTCTGCAGACTCAAACTCCAC |
| Mouse TNF-α | ATGAGAAGTTCCCAAATGGCC | TCCACTTGGTGGTTTGCTACG |
| Mouse IL-6 | GGAAATCGTGGAAATGAG | GCTTAGGCATAACGCACT |
| Rat IL-1β | CCTGTGTGATGAAAGACGG | TATGTCCCGACCATTGCTG |
| Rat TNF-α | CCGATTTGCCATTTCATACC | TCACAGAGCAATGACTCCAA |
| Rat IL-6 | GTTGCCTTCTTGGGACTGAT | TACTGGTCTGTTGTGGGTGG |
| Mouse GAPDH | ACTCCACTCACGGCAAATTC | TCTCCATGGTGGTGAAGACA |
Table 1: List of Oligonucleotide Sequences used in this Study
Western blotting:
We used Radio-Immunoprecipitation Assay (RIPA) lysis buffer to extract total protein and measured protein concentration with a Bicinchoninic Acid (BCA) protein assay kit (Beyotime Biotechnology, China). Subsequently, we used 10 % Sodium Dodecyl Sulphate-Polyacrylamide Gel Electrophoresis (SDS-PAGE) to separate protein samples (50 μg) and then transferred them to the Polyvinylidene Difluoride (PVDF) membranes. The membranes underwent blocking with 5 % low-fat milk and were then exposed to primary antibodies targeting CIAPIN1 (1:500, GTX111212, rabbit polyclonal, GeneTex), SIRT1 (1:500, sc-74465, mouse monoclonal, Santa Cruz), TXNIP (1:500, ab188865, rabbit monoclonal, Abcam), NLRP3 (1:500, ab263899, rabbit monoclonal, Abcam), and caspase-1 p10 (1:500, sc-392736, mouse monoclonal, Santa Cruz). The membranes were treated with Horseradish Peroxidase (HRP)-linked secondary antibodies. GAPDH (1:2000, ab8245, mouse monoclonal, Abcam) was used as an internal control. The bands were observed using Electrochemiluminescence (ECL) (Thermo, Waltham, Massachusetts, USA) and analyzed with ImageJ software.
Statistical analysis:
Data were presented as mean±Standard Deviation (SD) for quantitative variables and number (%) for category variables. All statistical analyses were done using Statistical Package for the Social Sciences (SPSS) Software 20.0 (SPSS Inc., Chicago, Illinois, USA). Quantitative data were examined using the student t-test, while categorical data were evaluated using the Chi-square (χ2) test. Pearson correlation was used to investigate the relationships between CIAPIN1 and clinical markers. In cell experiments, the one-way Analysis of Variance (ANOVA) was employed to determine differences between three or more groups, followed by the Bonferroni post hoc test. A statistically significant difference was defined as p<0.05.
Results and Discussion
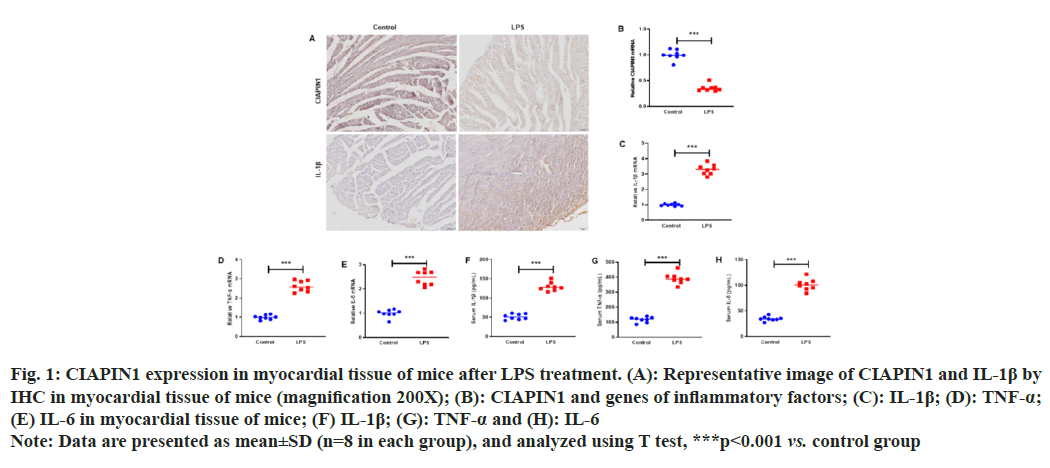
To investigate the expression of CIAPIN1 in LPS-induced myocardial tissue of mice, mice were intraperitoneally injected with LPS (10 mg/kg). After 24 h, the mice were anesthetized by pentobarbital sodium injection and sacrificed to obtain myocardial tissue. IHC analysis was carried out to examine the expression of CIAPIN1 and IL-1β in the myocardial tissue of mice. The results showed that CIAPIN1 expression was decreased, whereas IL-1β increased in LPS-induced myocardial tissue, and the same trends of CIAPIN1 and IL-1β expressions were observed in the RT-qPCR analysis (fig. 1A and fig. 1B). In addition, the genes of inflammatory factors, such as IL-1β, TNF-α and IL-6 expressions, were raised in the myocardial tissue of mice (fig. 1C-fig. 1E). Furthermore, ELISA was carried out to measure the serum concentrations of IL-1β, TNF-α and IL-6. The results showed increased IL-1β, TNF-α and IL-6 expression in plasma serum (fig. 1F-fig. 1H).
Fig. 1: CIAPIN1 expression in myocardial tissue of mice after LPS treatment. (A): Representative image of CIAPIN1 and IL-1β by
IHC in myocardial tissue of mice (magnification 200X); (B): CIAPIN1 and genes of inflammatory factors; (C): IL-1β; (D): TNF-α;
(E) IL-6 in myocardial tissue of mice; (F) IL-1β; (G): TNF-α and (H): IL-6
Note: Data are presented as mean±SD (n=8 in each group), and analyzed using T test, ***p<0.001 vs. control group
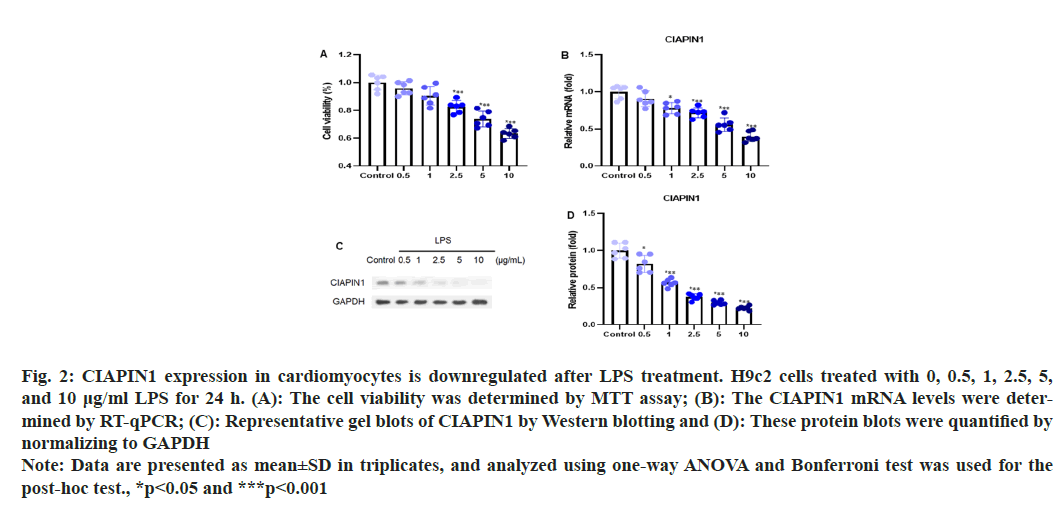
To investigate the expression of CIAPIN1 in cardiomyocytes induced by LPS, the H9c2 cells were treated with different doses of LPS (0, 0.5, 1, 2.5, 5, and 10 μg/ml) for 24 h. Cell viability was assessed through an MTT assay, which showed no adverse effects on the cells as seen in fig. 2A. The levels of CIAPIN1 mRNA were evaluated by RT-qPCR analysis. The results demonstrated that the expression of CIAPIN1 mRNA levels was decreased with increasing LPS doses (fig. 2B). Further, the Western blot analysis was performed to estimate the expression pattern of CIAPIN1 with several LPS doses and observed CIAPIN1 expression was gradually reduced with increasing LPS doses (fig. 2C). The consistent results were found after quantification of the protein blots (fig. 2D).
Fig. 2: CIAPIN1 expression in cardiomyocytes is downregulated after LPS treatment. H9c2 cells treated with 0, 0.5, 1, 2.5, 5,
and 10 μg/ml LPS for 24 h. (A): The cell viability was determined by MTT assay; (B): The CIAPIN1 mRNA levels were determined
by RT-qPCR; (C): Representative gel blots of CIAPIN1 by Western blotting and (D): These protein blots were quantified by
normalizing to GAPDH
Note: Data are presented as mean±SD in triplicates, and analyzed using one-way ANOVA and Bonferroni test was used for the
post-hoc test., *p<0.05 and ***p<0.001
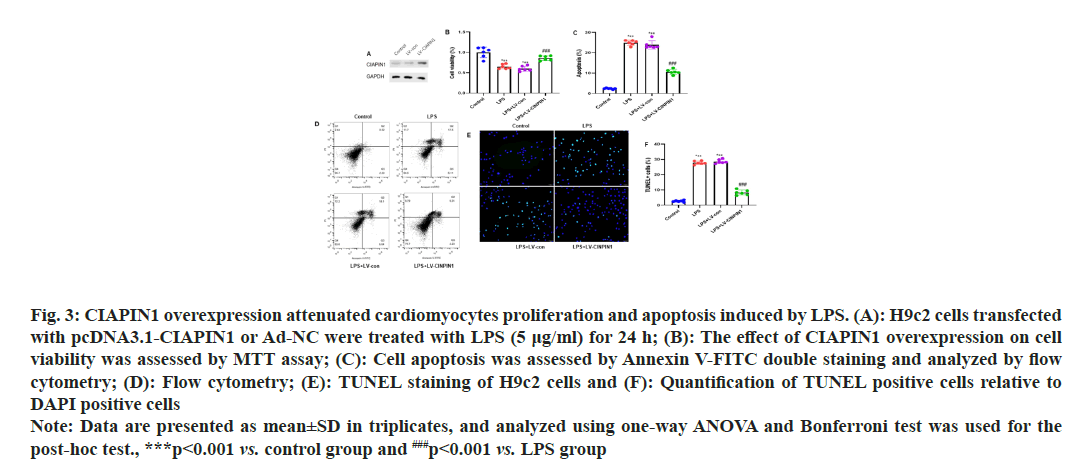
To evaluate the CIAPIN1 levels in the H9c2 cells after transfection with pcDNA3.1-CIAPIN1 or Ad-NC. We transfected H9c2 cells with pcDNA3.1-CIAPIN1 or Ad-NC and performed Western blot analysis. The results showed that pcDNA3.1-CIAPIN1 expression increased compared to Ad-NC (fig. 3A). H9c2 cells were modified with pcDNA3.1-CIAPIN1 or Ad-NC and then exposed to LPS (5 μg/ml) for 24 h. To determine the impact of CIAPIN1 overexpression on cell viability, an MTT assay was performed, and no adverse effects were observed on infected cells (fig. 3B). Annexin V-FITC double staining was used to assess cell apoptosis and then analyzed using flow cytometry. The sum of early apoptotic cells (lower right quadrant) and late apoptotic cells (upper right quadrant) was calculated to determine the apoptotic rate. The results demonstrated that the apoptotic rate was inhibited in transfected cells with pcDNA3.1-CIAPIN1 group cells (fig. 3C and fig. 3D).
Fig. 3: CIAPIN1 overexpression attenuated cardiomyocytes proliferation and apoptosis induced by LPS. (A): H9c2 cells transfected
with pcDNA3.1-CIAPIN1 or Ad-NC were treated with LPS (5 μg/ml) for 24 h; (B): The effect of CIAPIN1 overexpression on cell
viability was assessed by MTT assay; (C): Cell apoptosis was assessed by Annexin V-FITC double staining and analyzed by flow
cytometry; (D): Flow cytometry; (E): TUNEL staining of H9c2 cells and (F): Quantification of TUNEL positive cells relative to
DAPI positive cells
Note: Data are presented as mean±SD in triplicates, and analyzed using one-way ANOVA and Bonferroni test was used for the
post-hoc test., ***p<0.001 vs. control group and ###p<0.001 vs. LPS group
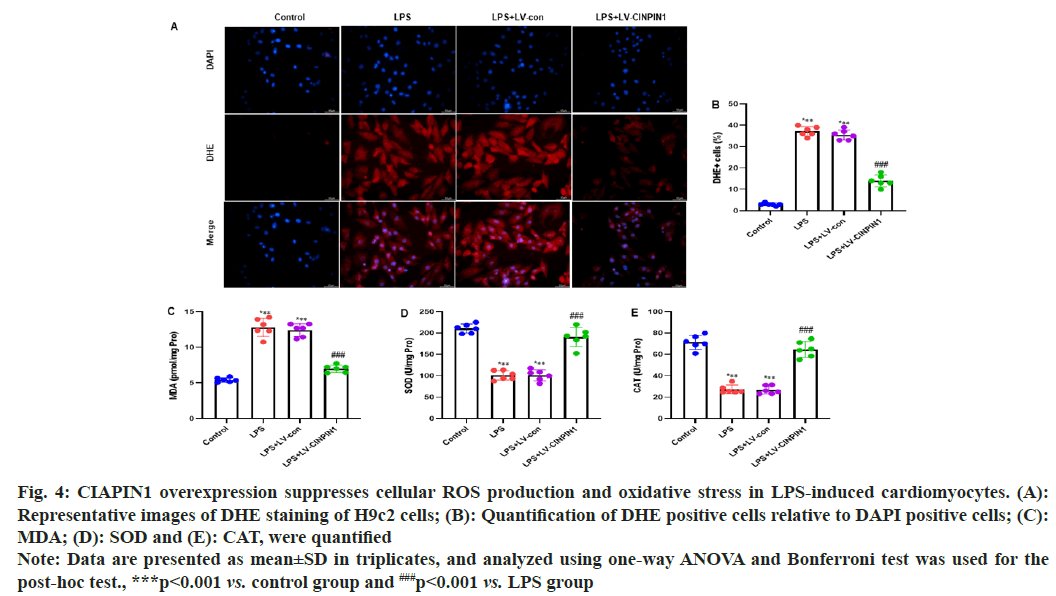
TUNEL staining of H9c2 cells showed significantly reduced expression of the LPs+LV-CIAPIN1 group, and the same trends were observed after quantification of the TUNEL staining cells (fig. 3E and fig. 3F). To study the impact of CIAPIN1 overexpression on cellular ROS production in LPS-induced cardiomyocytes, DHE staining of H9c2 cells was carried out. The results showed that LPS and LPS+LV-control groups of cells raised the cellular ROS production. In contrast, the LPS+LV-CIAPIN1 group potentially reduced it (fig. 4A). After quantification of DHE-positive cells relative to DAPI-positive cells, we observed the same consistent results (fig. 4B). Further, we investigated the effect of CIAPIN1 overexpression on oxidative stress in LPS-induced cardiomyocytes; we performed the colorimetric method to determine oxidative stress indicators in the lysate of H9c2 cells, and the levels of MDA, SOD and CAT. The results demonstrated that LPS and LPS+LV-control groups of cells increased the level of MDA while decreasing the levels of SOD and CAT. On the other hand, opposite levels of MDA, SOD, and CAT were observed for the LPS+LV-CIAPIN1 group (fig. 4C-fig. 4E).
Fig. 4: CIAPIN1 overexpression suppresses cellular ROS production and oxidative stress in LPS-induced cardiomyocytes. (A):
Representative images of DHE staining of H9c2 cells; (B): Quantification of DHE positive cells relative to DAPI positive cells; (C):
MDA; (D): SOD and (E): CAT, were quantified
Note: Data are presented as mean±SD in triplicates, and analyzed using one-way ANOVA and Bonferroni test was used for the
post-hoc test., ***p<0.001 vs. control group and ###p<0.001 vs. LPS group
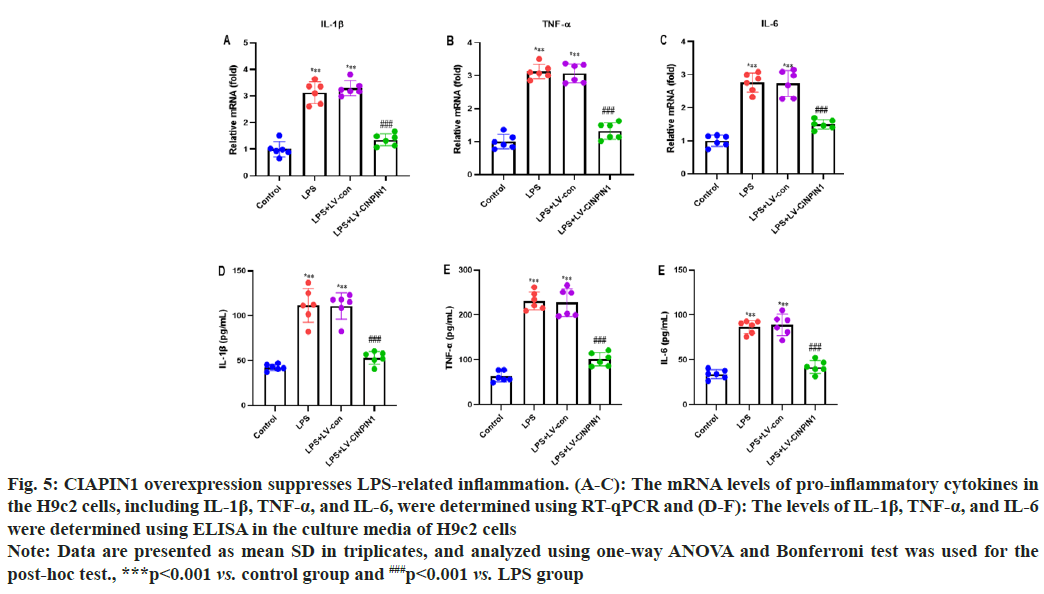
We performed the RT-qPCR and ELISA analysis to evaluate the potential impact of CIAPIN1 overexpression on LPS-induced inflammation in the H9c2 cells. The mRNA levels of pro-inflammatory cytokines in the H9c2 cells, including IL-1β, TNF-α, and IL-6, were determined using RT-qPCR. Our data showed that LPS and LPS+LV-control groups of cells enhanced the levels of IL-1β, TNF-α, and IL-6. In contrast, the LPS+LV-CIAPIN1 group significantly decreased it (fig. 5A-fig. 5C). In addition, IL-1β, TNF-α, and IL-6 levels were determined using ELISA in the culture media of H9c2 cells. The results demonstrated that LPS and LPS+LV-control groups of cells increased the levels of IL-1β, TNF-α, and IL-6. On the other hand, the LPS+LV-CIAPIN1 group potentially reduced it (fig. 5D-fig. 5F).
Fig. 5: CIAPIN1 overexpression suppresses LPS-related inflammation. (A-C): The mRNA levels of pro-inflammatory cytokines in
the H9c2 cells, including IL-1β, TNF-α, and IL-6, were determined using RT-qPCR and (D-F): The levels of IL-1β, TNF-α, and IL-6
were determined using ELISA in the culture media of H9c2 cells
Note: Data are presented as mean±SD in triplicates, and analyzed using one-way ANOVA and Bonferroni test was used for the
post-hoc test., ***p<0.001 vs. control group and ###p<0.001 vs. LPS group
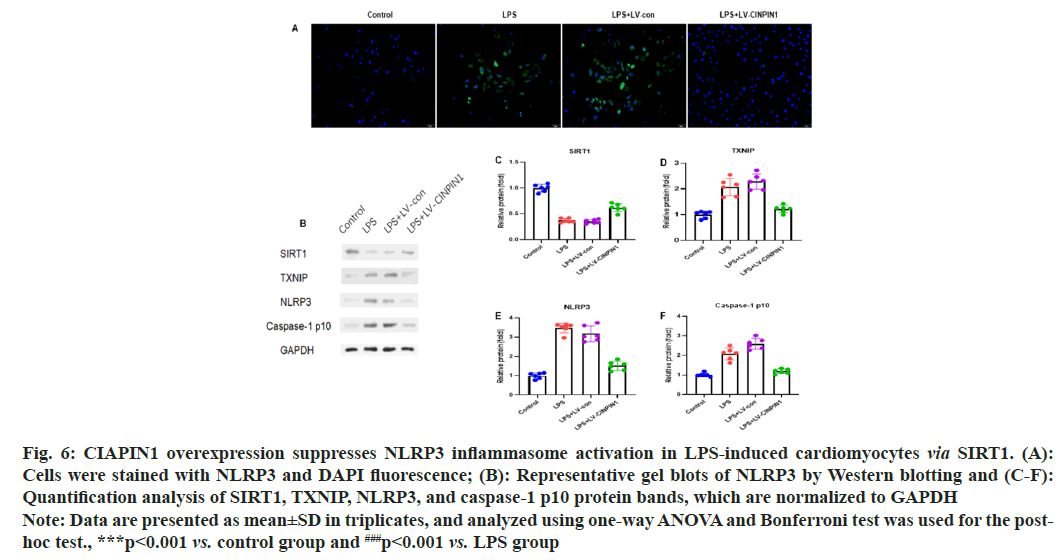
To examine the potential effect of CIAPIN1 overexpression on NLRP3 inflammasome activation in LPS-induced cardiomyocytes via SIRT1, the H9c2 cells were stained with NLRP3 and DAPI fluorescence. The cytoplasm green fluorescence showed high expression of NLRP3 protein in the LPS+LV-CIAPIN1 group compared with LPS and LPS+LV-control groups of cells (fig. 6A). Further, we carried out the Western blot analysis to see the effect of CIAPIN1 overexpression on NLRP3 inflammasome activation in LPS-induced cardiomyocytes via SIRT1. The results demonstrated that SIRT1 expression was increased in the LPS+LV-CIAPIN1 group than LPS and LPS+LV-control groups of cells. On the other hand, TXNIP, NLRP3, and caspase-1 p10 protein expressions were decreased in the LPS+LV-CIAPIN1 group than LPS and LPS+LV-control groups of cells (fig. 6B). Moreover, quantification analysis of SIRT1, TXNIP, NLRP3, and caspase-1 p10 protein blots were showed the same trends of expression patterns (fig. 6C-fig. 6F).
Fig. 6: CIAPIN1 overexpression suppresses NLRP3 inflammasome activation in LPS-induced cardiomyocytes via SIRT1. (A):
Cells were stained with NLRP3 and DAPI fluorescence; (B): Representative gel blots of NLRP3 by Western blotting and (C-F):
Quantification analysis of SIRT1, TXNIP, NLRP3, and caspase-1 p10 protein bands, which are normalized to GAPDH
Note: Data are presented as mean±SD in triplicates, and analyzed using one-way ANOVA and Bonferroni test was used for the
post-hoc test., ***p<0.001 vs. control group and ###p<0.001 vs. LPS group
The present research investigated the potential impact of CIAPIN1 on LPS-induced myocardial injury. The results showed that CIAPIN1 attenuated in the LPS-induced myocardial tissue of mice. In LPS-induced H9c2 cardiomyocytes, CIAPIN1 expression is downregulated. Overexpression of CIAPIN1 inhibits proliferation and apoptosis in cardiomyocytes. In addition, overexpression of CIAPIN1 reduced cellular ROS generation and oxidative stress in LPS-induced cardiomyocytes. Moreover, CIAPIN1 overexpression reduced inflammation produced by LPS. Furthermore, CIAPIN1 overexpression inhibited NLRP3 inflammasome activation in LPS-induced cardiomyocytes via SIRT1. Therefore, the study results demonstrated that CIAPIN1 could protect against LPS-induced myocardial injury.
CIAPIN1 is a regulatory molecule found on the long arm of chromosome 16. Shibayama et al.[18], identified it as a rat sarcoma signal transduction pathway component, distinct from apoptotic B cell lymphoma 2 or the cysteine-dependent aspartate-directed protease family. CIAPIN1 is abundantly distributed throughout healthy fetal and adult tissues and in differentiated and metabolically active tissue[17]. However, investigations have revealed that its expression is suppressed in some malignant tissues, including gastric cancer and clear cell renal cell carcinoma[23,24]. Our previous research identified that CIAPIN1 levels were down regulated in sepsis patients and were shown to be highly related to clinic pathological indicators of sepsis patients. However, in this current research, mice were intraperitoneally injected with LPS (10 mg/kg) to evaluate the expression of CIAPIN1 in LPS-induced myocardial tissue of mice. We found that CIAPIN1 expression was decreased in the myocardial tissue of mice.
Sepsis-induced myocardial damage and cardiac dysfunction are thought to be caused by a variety of processes, with inflammation being a key factor. During the pathogenic phase of sepsis, immune cells create large quantities of inflammatory cytokines. Inflammatory cytokines can induce neutrophils to enter the myocardium, impede β-adrenergic signaling, disrupt energy metabolism, alter calcium homeostasis, and drive excess nitric oxide generation, resulting in myocardial damage and reduced contractility[25-27]. Myocardial cells, like immune cells, release inflammatory factors, including IL-1β and TNF-α when stimulated by LPS[27]. These cytokines interact with one another to produce positive feedback loops, exacerbating inflammatory responses and causing heart dysfunction. Furthermore, data suggests that decreasing inflammatory responses might alleviate sepsis-induced cardiac injury[28]. However, our research found that LPS induced cardiac tissue damage, resulting in elevated levels of IL-1β, TNF-α, and IL-6 in plasma and equivalent mRNA levels in cardiomyocytes. However, in the LPS+LV-CIAPIN1 group, these pathological alterations were reduced, showing that CIAPIN1 improved myocardial damage via anti-inflammatory impacts.
NLRP3 mediates innate immune protection against pathogenic infections[9]. The NLRP3 inflammasome has been linked to a variety of heart conditions, including myocardial infarction, sepsis-induced myocardial dysfunction, diabetic cardiomyopathy, and cardiac ischemia-reperfusion damage[10,28]. The NLRP3 inflammasome comprises caspase-1 apoptosis-associated speck-like protein (ASC) and NLRP3. The NLRP3 inflammasome activates caspase-1 clusters, which then become active. Activated caspase-1 promotes the maturation of IL-1β. It was shown that inhibiting NLRP3 inflammasome activation in cardiac tissue might reduce sepsis-induced myocardial damage and cardiac dysfunction[29]. Therefore, the activity of the NLRP3 inflammasome in cardiomyocytes was investigated further. In addition, SIRT1 has inhibited NLRP3 inflammasome activation[15]. However, our present research showed that SIRT1 expression was increased in the LPS+LV-CIAPIN1 group while TXNIP, NLRP3, and caspase-1 p10 protein expressions were decreased. The results suggest that CIAPIN1 overexpression inhibited NLRP3 inflammasome activation in LPS-induced cardiomyocytes via SIRT1.
Our study has several limitations. Our study employed a preventative procedure rather than a curative one. We also needed to build up a positive control group. Future studies should include the therapy methodology and positive control group to create a solid foundation for the practical use of CIAPIN1 in the treatment of sepsis-induced cardiac damage.
CIAPIN1 may alleviate LPS-induced myocardial damage and cardiac dysfunction by reducing NLRP3 inflammasome activation, providing an effective approach for treating and preventing myocardial injury in sepsis.
Author’s contributions:
Nongzhang Xu designed the project, supervised the project, and revised the manuscript. Lin Chen and Jianwei Wan performed experiments and wrote the first draft of the manuscript. Cuihong Wang helped perform the experiments, collect data, analyzed the data and performed statistical analysis. Lin Chen and Jianwei Wan have contributed equally to this work.
Funding:
This study was supported by Shanghai Pudong New Area Health System Discipline Leader Training Program (PWRd2022-13).
Conflict of interests:
The authors declared no conflict of interests.
References
- Charpentier J, Luyt CE, Fulla Y, Vinsonneau C, Cariou A, Grabar S, et al. Brain natriuretic peptide: A marker of myocardial dysfunction and prognosis during severe sepsis. Crit Care Med 2004;32(3):660-5.
[Crossref] [Google Scholar] [PubMed]
- Vieillard-Baron A, Caille V, Charron C, Belliard G, Page B, Jardin F. Actual incidence of global left ventricular hypokinesia in adult septic shock. Crit care Med 2008;36(6):1701-6.
[Crossref] [Google Scholar] [PubMed]
- Jeong HS, Lee TH, Bang CH, Kim JH, Hong SJ. Risk factors and outcomes of sepsis-induced myocardial dysfunction and stress-induced cardiomyopathy in sepsis or septic shock: A comparative retrospective study. Medicine 2018;97(13):e0263.
[Crossref] [Google Scholar] [PubMed]
- Cimolai MC, Alvarez S, Bode C, Bugger H. Mitochondrial mechanisms in septic cardiomyopathy. Int J Mol Sci 2015;16(8):17763-78.
[Crossref] [Google Scholar] [PubMed]
- Essandoh K, Yang L, Wang X, Huang W, Qin D, Hao J, et al. Blockade of exosome generation with GW4869 dampens the sepsis-induced inflammation and cardiac dysfunction. Biochim Biophys Acta 2015;1852(11):2362-71.
[Crossref] [Google Scholar] [PubMed]
- Neri M, Riezzo I, Pomara C, Schiavone S, Turillazzi E. Oxidative-nitrosative stress and myocardial dysfunctions in sepsis: Evidence from the literature and postmortem observations. Mediators Inflamm 2016;2016.
[Crossref] [Google Scholar] [PubMed]
- Cheng KT, Xiong S, Ye Z, Hong Z, Di A, Tsang KM, et al. Caspase-11 mediated endothelial pyroptosis underlies endotoxemia-induced lung injury. J Clin Invest 2017;127(11):4124-35.
[Crossref] [Google Scholar] [PubMed]
- Ye Z, Zhang L, Li R, Dong W, Liu S, Li Z, et al. Caspase-11 mediates pyroptosis of tubular epithelial cells and septic acute kidney injury. Kidney Blood Press Res 2019;44(4):465-78.
[Crossref] [Google Scholar] [PubMed]
- Li CG, Zeng QZ, Chen MY, Xu LH, Zhang CC, Mai FY, et al. Evodiamine augments NLRP3 inflammasome activation and anti-bacterial responses through inducing α-tubulin acetylation. Front Pharmacol 2019;10:290.
[Crossref] [Google Scholar] [PubMed]
- Yang C, Xia W, Liu X, Lin J, Wu A. Role of TXNIP/NLRP3 in sepsis-induced myocardial dysfunction. Int J Mol Med 2019;44(2):417-26.
[Crossref] [Google Scholar] [PubMed]
- Franchi L, Muñoz-Planillo R, Núñez G. Sensing and reacting to microbes through the inflammasomes. Nat Immunol 2012;13(4):325-32.
[Crossref] [Google Scholar] [PubMed]
- Wang Z, Hu W, Lu C, Ma Z, Jiang S, Gu C, et al. Targeting NLRP3 (nucleotide-binding domain, leucine-rich-containing family, pyrin domain-containing-3) inflammasome in cardiovascular disorders. Arterioscler Thromb Vasc Biol 2018;38(12):2765-79.
[Crossref] [Google Scholar] [PubMed]
- Lamkanfi M, Dixit VM. Mechanisms and functions of inflammasomes. Cell 2014;157(5):1013-22.
[Crossref] [Google Scholar] [PubMed]
- Fu Y, Wang Y, Du L, Xu C, Cao J, Fan T, et al. Resveratrol inhibits ionising irradiation-induced inflammation in MSCs by activating SIRT1 and limiting NLRP-3 inflammasome activation. Int J Mol Sci 2013;14(7):14105-18.
[Crossref] [Google Scholar] [PubMed]
- Peng Z, Zhang W, Qiao J, He B. Melatonin attenuates airway inflammation via SIRT1 dependent inhibition of NLRP3 inflammasome and IL-1β in rats with COPD. Int Immunopharmacol 2018;62:23-8.
[Crossref] [Google Scholar] [PubMed]
- Chua-On D, Proungvitaya T, Techasen A, Limpaiboon T, Roytrakul S, Wongkham S, et al. High expression of apoptosis-inducing factor, mitochondrion-associated 3 (AIFM3) in human cholangiocarcinoma. Tumour Biol 2016;37(10):13659-67.
[Crossref] [Google Scholar] [PubMed]
- Hao Z, Li X, Qiao T, Du R, Zhang G, Fan D. Subcellular localization of CIAPIN1. J Histochem Cytochem 2006;54(12):1437-44.
[Crossref] [Google Scholar] [PubMed]
- Shibayama H, Takai E, Matsumura I, Kouno M, Morii E, Kitamura Y, et al. Identification of a cytokine-induced antiapoptotic molecule anamorsin essential for definitive hematopoiesis. J Exp Med 2004;199(4):581-92.
[Crossref] [Google Scholar] [PubMed]
- Li X, Wu K, Fan D. CIAPIN1 as a therapeutic target in cancer. Exp Opin Ther Targets 2010;14(6):603-10.
[Crossref] [Google Scholar] [PubMed]
- MA J, Zhang W, Chen H, Jiang Y, Tu P, Ding H. The protective effects of echinacoside on oxidative stress injury in vascular dementia rats. Chin Pharmacol Bull 2014:638-41.
- Li L, Hou X, Xu R, Liu C, Tu M. Research review on the pharmacological effects of astragaloside IV. Fundam Clin Pharmacol 2017;31(1):17-36.
[Crossref] [Google Scholar] [PubMed]
- Zhu X, Zhang X, Gu W, Zhao H, Hao S, Ning Z. ANGPTL4 suppresses the profibrogenic functions of atrial fibroblasts induced by angiotensin II by up-regulating PPARγ. Iran J Basic Med Sci 2023;26(5):587.
[Crossref] [Google Scholar] [PubMed]
- Li X, Hao Z, Fan R, Zou X, Jin H, Pan Y, et al. CIAPIN1 inhibits gastric cancer cell proliferation and cell cycle progression by downregulating cyclyin D1 and upregulating p27. Cancer Biol Ther 2007;6(10):1539-45.
[Crossref] [Google Scholar] [PubMed]
- He L, Wang H, Jin H, Guo C, Xie H, Yan K, et al. CIAPIN1 inhibits the growth and proliferation of clear cell renal cell carcinoma. Cancer Lett 2009;276(1):88-94.
[Crossref] [Google Scholar] [PubMed]
- Alves-Filho JC, de Freitas A, Spiller F, Souto FO, Cunha FQ. The role of neutrophils in severe sepsis. Shock 2008;30(7):3-9.
[Crossref] [Google Scholar] [PubMed]
- de Montmollin E, Aboab J, Mansart A, Annane D. Bench-to-bedside review: β-adrenergic modulation in sepsis. Crit Care 2009;13(5):230.
[Crossref] [Google Scholar] [PubMed]
- Drosatos K, Lymperopoulos A, Kennel PJ, Pollak N, Schulze PC, Goldberg IJ. Pathophysiology of sepsis-related cardiac dysfunction: Driven by inflammation, energy mismanagement, or both? Curr Heart Fail Rep 2015;12:130-40.
[Crossref] [Google Scholar] [PubMed]
- Yang L, Zhang H, Chen P. Sulfur dioxide attenuates sepsis-induced cardiac dysfunction via inhibition of NLRP3 inflammasome activation in rats. Nitric Oxide 2018;81:11-20.
[Crossref] [Google Scholar] [PubMed]
- Wu D, Shi L, Li P, Ni X, Zhang J, Zhu Q, et al. Intermedin 1-53 protects cardiac fibroblasts by inhibiting NLRP3 inflammasome activation during sepsis. Inflammation 2018;41:505-14.
[Crossref] [Google Scholar] [PubMed]
