- *Corresponding Author:
- Chandana Sengupta
Division of Pharmaceutical Chemistry, Department of Pharmaceutical Technology, Jadavpur University, Kolkata-700 032,India
E-mail: csgjupt@yahoo.com
| Date of Submission | 16 November 2004 |
| Date of Revision | 13 July 2005 |
| Date of Acceptance | 1 March 2006 |
| Indian J Pharm Sci, 2006, 68 (2): 199-204 |
Abstract
The aim of the study was to investigate the antiperoxidative potential of ascorbic acid on cisplatin-induced lipid peroxidation, using some common laboratory markers. Goat liver was used as the lipid source. This in vitro evaluation was done by measuring the malondialdehyde, 4-hydroxy-2-nonenal, reduced glutathione, and nitric oxide content of tissue homogenates. The results suggest that cisplatin could induce lipid peroxidation to a significant extent, and it was also found that ascorbic acid has the ability to suppress the drug-induced toxicity.
Biological membranes are a rich source of polyunsaturated fatty acids that are susceptible to lipid peroxidation, in the presence of metal ions and other prooxidants [1]. Lipid peroxidation is the introduction of a functional group containing two catenated oxygen atoms O-O into unsaturated fatty acids, in a free radical mediated chain reaction [2]. Free radicals are constantly being generated in the body through various mechanisms, and are also being removed by endogenous antioxidant defence mechanisms that act by scavenging free radicals, decomposing peroxides, and/or binding with pro-oxidant metal ions [3]. Lipid peroxidation leads to generation of peroxides and hydroperoxides, that can decompose to yield a wide range of cytotoxic products, most of which are aldehydes, as exemplified by malondialdehyde, 4-hydroxynonenal, etc [4]. Lipid peroxidation has been related to the pathophysiology of several diseases like joint injury in rheumatoid patients [5], some pulmonary and hepatic diseases [6], cancer [3], and toxicity of some drugs e.g. cardiotoxicity of doxorubicin [7], etc. So the balance between the pro-oxidant and antioxidant is very important for the survival. All antioxidants generally influence the redox status, thereby protecting cells against reactive oxygen species (ROS) under certain circumstances, while promoting ROS generation in others [8]. The cell damage through free radical mediated reactions can be protected by enzymatic and nonenzymatic defence mechanisms [9]. There are also reports that antioxidant vitamins may be helpful in preventing the onset or progression of cardiovascular diseases [10], cancer [11], disabling eye disease [12], etc. So the antioxidant defence is an important factor for the prevention of oxidative damage. In case of reduced or impaired defence mechanism, and excess generation of free radicals that are not counter balanced by endogenous antioxidant defence, exogenously administered antioxidants have proven helpful to overcome oxidative damage.
Cisplatin is a well-known anticancer drug that causes cumulative toxicity to normal tissues. It has been suggested that cisplatin damages normal cells by causing oxidative stress, but it is not known whether it can induce similar damage to tumor cells [13]. It has been also seen that patients treated with cisplatin, develop a decline in renal function. The mechanisms by which cisplatin produces renal injury, are not well understood, but it has been suggested that free radical-catalyzed lipid peroxidation can induce apoptosis or necrosis, leading to renal injury [14], and it is due to oxidative stress that an imbalance between free-radical-generating cisplatin and the radical-scavenging system is created [15].It has also reported that ascorbic acid suppresses the cisplatin- toxicity on blood platelets [16].
In the ongoing search of the present authors, for antioxidants that may reduce drug induced lipid peroxidation [17-25], the present work deals with in vitro evaluation of antiperoxidative potential of ascorbic acid, which can prevent cisplatin induced lipid peroxidation.
Materials and Methods
The study had been performed on goat (capra capra) liver, using some common laboratory markers of lipid peroxidation, like measurement of the malondialdehyde (MDA), 4-hydroxy-2-nonenal (4-HNE), reduced glutathione (GSH), and the nitric oxide (NO) content of the tissue. Goat liver was selected because of its easy availability and close similarity to the human liver, in its lipid profile [26].
Preparation of tissue homogenate
Goat liver was collected in a sterile vessel containing phosphate buffer (pH 7.4) solution. After draining the buffer solution as completely as possible, the liver was immediately ground to make a tissue homogenate (1g/ml), using freshly prepared phosphate buffer (pH 7.4). The homogenate was divided into four equal parts, which were then treated differently as mentioned below.
Incubation of tissue homogenate with drug and/or antioxidant
The tissue homogenate was divided into four parts of 50 ml each. The first portion was kept as control (C), while the second portion was treated with drug (D), at a concentration of 0.0244 mg/g tissue homogenate. The third portion was treated with drug and antioxidant (DA), and the fourth one was treated with antioxidant alone, at a concentration of 0.1666 mg/g tissue homogenate. After treatment with drug and/or antioxidant, the liver homogenates were shaken for 1 h, and incubated below 20° for 4 h for further study.
Estimation of malondialdehyde (MDA) level from tissue homogenate
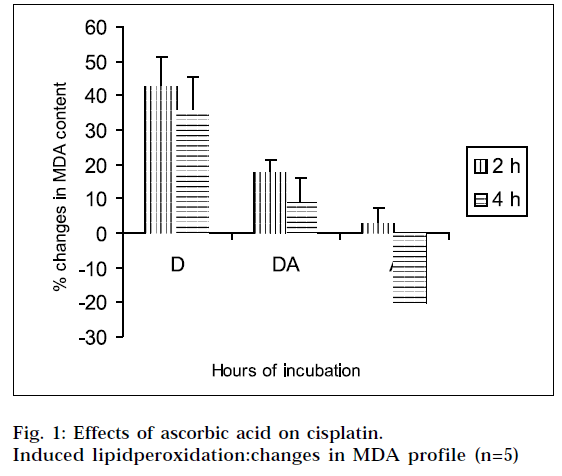
The extent of lipid peroxidation was measured in terms of MDA content, using the thiobarbuturic acid (TBA) method.27 The estimation was done at 2h, and 4 h of incubation, and repeated in five animal sets. In each case, three samples of 2.5 ml of incubation mixture, were treated with 2.5 ml of 10% trichloroacetic acid (TCA), and centrifuged at 3000 rpm for 30 min, to precipitate protein. Then 2.5 ml of the filtrate was treated with 5 ml of 0.002 (M) TBA solution, and the volume was made up to 10 ml with distilled water. The mixture was heated on a boiling water bath for 30 min, the tubes were cooled to room temperature, and the absorbance was measured at 530 nm against a TBA blank (prepared from 5 ml of TBA solution and 5 ml of distilled water), using wpa lightwave diode array spectrophotometer (version 2.3). The values were determined from the standard curve, which was constructed as follows. Different aliquots from standard 1,1,3,3-tetrahydroxypropane (TEP) solution were taken in graduated stoppered test tubes, and volume of each solution was made up to 5 ml. To each solution, 5 ml of TBA solution was added, and the mixture was heated in a steam bath for 30 min. The solutions were cooled to room temperature, and their absorbances were noted at 530 nm against TBA, as blank. By plotting absorbances against concentrations, a straight line passing through the origin was obtained. The best fit equation is A=0.007086M, where M= nanomoles of MDA, A= absorbance, r = 0.995, SEE= 0.006.
Estimation of reduced glutathione (GSH) level from tissue homogenate
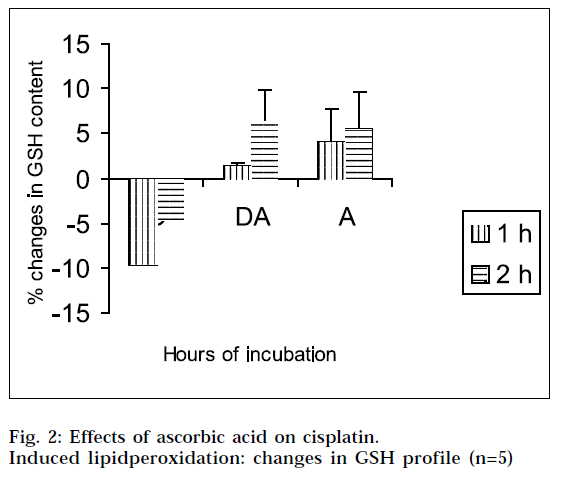
GSH was measured in accordance with Ellman’s method [28]. The estimation was done at 1h, and 2 hs of incubation, and repeated in five animal sets. In each case, three samples of 1 ml of incubation mixture were treated with 1 ml of 5% TCA in 1mM EDTA, and centrifuged at 2000 g for 10 min. After that 1 ml of the filtrate was mixed with 5 ml of 0.1M phosphate buffer (pH 8.0), and 0.4 ml of 5,5’dithiobis (2-nitrobenzoic acid) (DTNB 0.01% in phosphate buffer) was added to it. The absorbances of the solutions were estimated at 412 nm against blank (prepared from 6.0 ml of phosphate buffer and 0.4 ml of DTNB), using the above mentioned spectrophotometer. The values were determined from the standard curve, which was constructed as follows. Different aliquots from the standard reduced glutathione solution were taken in 10 ml volumetric flasks. To each solution, 0.4 ml of DTNB solution was added, and the volume was adjusted up to the mark with phosphate buffer. The absorbance of each solution was noted at 412 nm, against a blank containing 9.6ml of phosphate buffer and 0.4 ml DTNB solution. By plotting absorbances against concentration, a straight line passing through the origin was obtained. The best fit equation is A= 0.00151C, where C= nanomoles of reduced glutathione, A= absorbance, r =0.997, SEE= 0.008.
Estimation of 4-hydroxy-2-nonenal (4-HNE) level from tissue homogenate
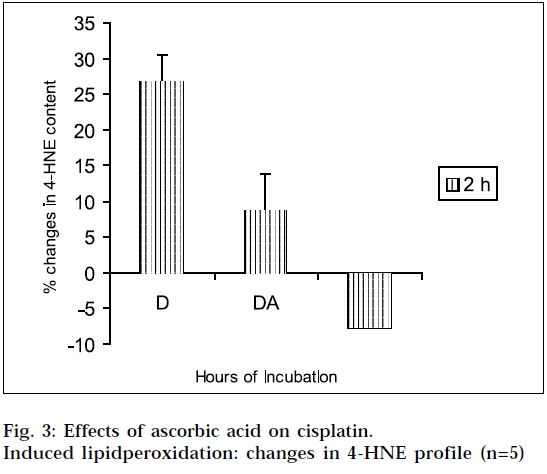
The estimation was done only at 2 hs of incubation, and it was repeated in 5 animal sets. In each case, three samples of 2 ml of incubation mixture were treated with 1.5 ml of 10% TCA solution, and centrifuged at 3000 rpm for 30 min. Then 2 ml of the filtrate was treated with 1 ml of 2,4 Dinitrophenyl hydrazine (DNPH 100 mg/100 ml of 0.5 M HCl), and kept for 1 h at room temperature. After that, the samples were extracted with Hexane, and the extract was evaporated at 40°. After cooling to room temperature, 2 ml of methanol was added to each sample, and the absorbance was measured at 350 nm against methanol as blank [29]. The values were determined from the standard curve. The standard calibration curve was drawn, based on the following procedure. A series of dilutions of 4-HNE in solvent (phosphate buffer) were prepared. 300 μl of primary standard was diluted with 4.70 ml of solvent, 400 μl of primary standard was diluted with 4.60 ml of solvent, 500 μl of primary standard was diluted with 4.50 ml of solvent, and 600 μl of primary standard was diluted with 4.40 ml of solvent. From each solution, 2 ml of sample was pipetted out, and transferred into stoppered glass tube. 1 ml of DNPH solution was added to all the samples, and kept at room temperature for 1 h. Each sample was extracted with 2 ml of hexane three times. All extracts were collected in stoppered test tubes. After that, the extract was evaporated to dryness under Argon at 40° and the residue was reconstituted in 1ml methanol. The absorbance was noted at 350 nm using the 0μM standard as blank. The best fit equation is: Nanomoles of 4-HNE= (A350 - 0.005603185)/0.003262215, where A350 = absorbance at 350nm, r = 0.999, SEE = 0.007.
Estimation of nitric oxide (NO) level from tissue homogenate
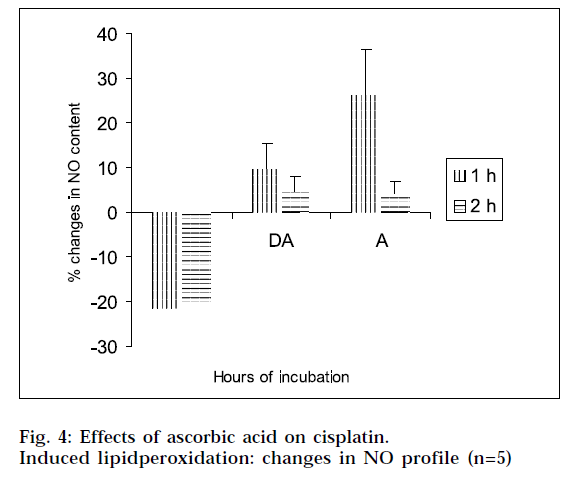
The estimation was done at 1h, and 2 hs, of incubation and it was repeated in five animal sets. The NO content was determined by reaction with Griess reagent [30]. In each case, three samples of 4.0 ml of tissue homogenate were treated with 2.5 ml of 10% TCA solution, and centrifuged at 3000 rpm for 30 min. Then 5 ml of the filtrate was treated with 0.5 ml of Griess reagent. After 10 min, the absorbance of the solutions were measured at 540 nm against blank (prepared from 5.0 ml of distilled water and 0.5 ml of Griess reagent). The values were calculated from the standard curve, which was constructed as follows. Different aliquots from standard sodium nitrite solution were taken in 5 ml volumetric flasks. To each solution, 0.5 ml of Griess reagent was added, and the volume was adjusted up to the mark with phosphate buffer. The absorbances of each solution were noted at 540 nm against a blank containing the buffer and Griess reagent. By plotting absorbance against concentration, a straight line passing through the origin was obtained. The best fit equation is A= 0.0108M, where M= nanomoles of NO, A= absorbance, r = 0.99581, SEE= 0.0064.
The % changes in MDA, GSH, 4-HNE, and NO level of different samples at different hours of incubation were calculated with respect to the control of the corresponding hours of incubation, and the changes in MDA/GSH/4-HNE/NO level was considered as indicator of the extent of lipid peroxidation. The calculations of % changes in MDA/GSH/4-HNE/NO content with corresponding ‘t’ values, average changes in five animal sets with corresponding standard errors and analysis of variance (ANOVA), were done directly from raw spectrophotometric data.
Results
The results of the studies on cisplatin-induced lipid peroxidation, and its inhibition with ascorbic acid, are shown in Fig. 1, 2, 3 and 4. The interpretation of the results is supported by Student’s ‘t’ test, and also by statistical multiple comparison analysis, using least significant different procedure. [31-32] From Figs. 1 and 3, it is evident that cisplatin increases the MDA and 4-HNE content of the tissue homogenates with respect to control, to a significant extent, after incubation for varying periods of time. But the MDA and 4-HNE contents were significantly reduced when the tissue homogenates were treated with cisplatin in combination with ascorbic acid, with respect to drug treated samples. When the tissue homogenates were treated with ascorbic acid alone, it showed some increase in MDA content with respect to control (2 h). The observations suggest that cisplatin could significantly induce the lipid-peroxidation process. So the lipid-peroxidation induction capacity of the drug may be related to its toxic potential [20]. It was further found from the study, that ascorbic acid could suppress the cisplatininduced lipid peroxidation to a significant extent.
From Figs. 2 and 4, it is evident that cisplatin decreases the GSH and NO content of the tissue homogenates with respect to the corresponding control, to a significant extent. The decrease in GSH and NO content was associated with increase in lipid peroxidation. When the tissue homogenates were treated with drug and ascorbic acid, the GSH and NO level were increased in comparison with the drug-treated group of the corresponding hours. Again the tissue homogenates were treated with ascorbic acid alone, and the GSH and NO contents were increased in comparison to the control samples. This increase in GSH and NO levels suggest the antiperoxidative potential of ascorbic acid. In this experimental model, ANOVA analysis is done to observe the differences between various groups, and within a particular group. From Tables 1, 2, 3 and 4, it is seen that there is significant differences among various groups (F1), but within a particular group, differences (F2) are insignificant. The difference among objects within a treatment, is a measure of the variability of the observation. If the F test is significant and more than two treatments are included in the experiments, it may not be obvious immediately, which treatments are different. To solve the problem, multiple comparison in ANOVA, has been done.
| Hours of incubation | Analysis of variance & multiple comparison |
|---|---|
| 2 | F1=13.34 [df=(2,8)] F2=1.20 [df=(4,8)] pooled variance (S2)*=160.16 Critical difference (P=0.05)# |
| LSD=23.82 Ranked means** (D) (DA, A) | |
| 4 | F1=18.34 [df=(2,8)] F2=2.21 [df=(4,8)] pooled variance (S2)*=211.01 Critical difference (P=0.05)# |
| LSD=27.35 Ranked means** (D, DA) (A) |
Theoretical values of F: P=0.05 level F1=4.46 [df=(2,8)], F2=3.84 [df=(4,8)]; P=0.01 level F1=8.65 [df=(2,8)], F2=7.01 [df=(4,8)]. F1 and F2 corresponding to variance ratio between groups and within groups respectively. *Error mean square, #Critical difference according to least significant procedure32. ** Two means not included within same parenthesis are statistically significantly different at P=0.05 level
Table 1: Anova & multiple comparison for changes of mda content
| Hours of incubation | Analysis of variance & multiple comparison | ||
|---|---|---|---|
| 1 | F1=8.38 | [df=(2,8)] | F2=1.03 [df=(4,8)] pooled variance (S2)*=31.56 Critical difference (P=0.05)# LSD=10.57 |
| Ranked means** (D) (DA, A) | |||
| 2 | F1=3.04 | [df=(2,8)] | F2=0.85 [df=(4,8)] pooled variance (S2)*=59.69 Critical difference (P=0.05) LSD=14.54 |
| Ranked means** (D, DA, A) | |||
Theoretical values of F: P=0.05 level F1=4.46 [df=(2,8)], F2=3.84 [df=(4,8)]; P=0.01 level F1=8.65 [df=(2,8)], F2=7.01 [df=(4,8)]. F1 and F2 corresponding to variance ratio between groups and within groups respectively. *Error mean square, #Critical difference according to least significant procedure32. ** Two means not included within same parenthesis are statistically significantly different at P=0.05 level
Table 2: Anova & Multiple Comparison For Changes Of Gsh Content
| Hours of incubation | Analysis of variance & multiple comparison |
|---|---|
| 2 | F1=20.98 [df=(2,8)] F2=3.32 [df=(4,8)] pooled variance (S2)*=70.50 Critical difference (P=0.05)# |
| LSD=15.80 Ranked means** (D) (DA) (A) |
Theoretical values of F: P=0.05 level F1=4.46 [df=(2,8)], F2=3.84 [df=(4,8)]; P=0.01 level F1=8.65 [df=(2,8)], F2=7.01 [df=(4,8)]. F1 and F2 corresponding to variance ratio between groups and within groups respectively. *Error mean square, #Critical difference according to least significant procedure32. **Two means not included within same parenthesis are statistically significantly different at P=0.05 level
Table 3:Anova & Multiple Comparison For Changes Of 4-Hne Content
| Hours of incubation | Analysis of variance & multiple comparison | |||
|---|---|---|---|---|
| 1 | F1=12.83 | [df=(2,8)] | F2=1.19 | [df=(4,8)] pooled variance (S2)*=228.39 Critical difference (P=0.05)# |
| LSD=28.45 Ranked means** (D) (DA, A) | ||||
| 2 | F1=16.62 | [df=(2,8)] | F2=1.76 | [df=(4,8)] pooled variance (S2)*=60.30 Critical difference (P=0.05)# |
| LSD=14.62 Ranked means** (D) (DA, A) | ||||
Theoretical values of F: P=0.05 level F1=4.46 [df=(2,8)], F2=3.84 [df=(4,8)]; P=0.01 level F1=8.65 [df=(2,8)], F2=7.01 [df=(4,8)]. F1 and F2 corresponding to variance ratio between groups and within groups respectively. *Error mean square, #Critical difference according to least significant procedure32. **Two means not included within same parenthesis are statistically significantly different at P=0.05 level
Table 4: Anova & Multiple Comparison For Changes Of No Content
Discussion
It has been understood that lipid peroxidation-induction capacity of drugs may be related to their toxic potential. This is an analogy to insulin deficiency diabetes induced by alloxan1, that are mediated through free radical mechanisms. The potential of antioxidants in reducing drug induced lipid-peroxidation, may be exploited to reduce drug-induced toxicity. Increase in MDA and 4-HNE levels, or decrease in GSH and NO levels of the drug-treated group suggests the occurrence of lipid peroxidation. MDA and 4-HNE are the end products produced by the decomposition of ω3 and ω6 polyunsaturated fatty acids [33]. This process of lipidperoxidation especially occurs in the presence of some metal ions like Fe2+ and other prooxidants. [1] So the decrease in MDA and 4-HNE content of tissue homogenates implies the free radical scavenging property of ascorbic acid. The increase in MDA content with respect to control when the tissue homogenates were treated with ascorbic acid alone, indicates the prooxidant effect of ascorbic acid [34-35]. Many known antioxidants like vitamins [8], estrogen [36-37], superoxide dismutase [38], βcarotene [49], and flavonoids, have been reported to act as prooxidants in presence of transition metals [40-41], or at high concentration [42]. GSH plays a very important role in the defence mechanism for tissues against the reactive oxygen species [43]. NO can protect cells against the detrimental effects of reactive oxygen species, and it has been demonstrated that NO can serve as a chainbreaking antioxidant in cell membranes [44]. It has been reported that ascorbic acid has a protective role against carcinogenicity of nitrosamines [45] and cadmium-induced thyroid dysfunction [46]. In the context of these reports, the present findings suggest that ascorbic acid has the potential to reduce cisplatin-induced lipid-peroxidation, and thus to increase the therapeutic index of the drug by way of reducing toxicity, that may be mediated through free radical mechanisms. However a detailed study is required to conclude such hypothesis.
Acknowledgements
The authors wish to thank Biological Evans Ltd., Hyderabad for providing the free gift sample of cisplatin.
References
- Gutteridge, J.M.C., Halliwell, B., In; Antioxidants in Nutrition, Health and Disease, Oxford University Press, Oxford, 1994, 12.
- Wheatly, A.R., Trends Anal. Chem., 2000, 19, 10.
- Halliwell, B., Drugs, 1990, 42, 569.
- Esterbauer, H., Zollner, H. and Schaur, R.J., Biochem., 1998, 1, 311.
- Halliwell, B., Hoult, J.R.S. and Blake, D.R., FASEB, 1988, 2, 501.
- Slater, T.F. and Sawgar, B.C., Biochem., 1971, 123, 805.
- Luo, X., Evrovsky, Y., Cole, D., Trines, J., Benson, C.N. and Lehotay,D.C., Biochem. Biophys.Acta, 1997, 45, 1360.
- Herbert, V., J. Nutr.,1996, 126, 1197.
- Durak, I., Perk, H., Kavutch, M., Combolat, O., Akyal, O. and Beduk,Y., Free Radical Biol. Med., 1994, 16, 825.
- Gaziano, J.M., Proc. Assoc. Am. Physicians, 1999, 2, 111.
- Lee, I.M., Proc. Assoc. Am. Physicians, 1999, 10, 111.
- Christen, W.G., Proc. Assoc. Am. Physicians, 1999, 16, 111.
- Yen, H. C., Nien, C. Y., Majima, H.J., Lee, C.P., Chen, S.Y., Wei, J.S.and See, L.C., J. Biochem. Mol. Toxicol., 2003, 17, 39.
- Xiao, T., Choudhary S., Zhang, W., Ansari, N.H. and Salahudeen A.,J. Toxicol. Environ. Health, 2003, 66, 469.
- Minamiyama, Y., Takemura, S., Toyokuni, S., Nishino, Y., Yamasaki,K., Hai, S., Yamamoto, S. and Okada, S., Biofactors, 2002, 16, 105115.
- Olas, B., Wachowicz, B. and Buczynski, A., Anticancer Drugs,2000, 11, 487.
- Sengupta, M., De, A.U. and Sengupta, C., Indian J. Biochem.Biophys.,1995, 32, 302.
- Dutta, H., De, A.U. and Sengupta, C., Indian J. Biochem.Biophys.,1996, 33, 76.
- Roy, K., Rudra, S., De, A.U. and Sengupta, C., Indian J. Pharm.Sci., 1998, 60, 153.
- Roy, K., Rudra, S., De, A.U. and Sengupta, C., Indian J. Pharm.Sci., 1999, 61, 44.
- Roy, K., Saha, A., De, K. and Sengupta, C., Acta Pol. Pharm.,2000, 57,385.
- Saha, A., Roy, K., De, K. and Sengupta, C., Acta Pol. Pharm.,2000, 57, 443.
- De, K., Roy, K., Saha, A. and Sengupta, C., Acta Pol. Pharm.,2001, 58, 391.
- Saha, A., Roy, K., De, K. and Sengupta, C., Acta Pol. Pharm.,2002, 59, 65.
- Roy, K., Saha, A., De, K. and Sengupta, C., Acta Pol. Pharm.,2002, 59, 231.
- Hilditch, T.P., Williams, P.N., In; The Chemical Constituents of Fats,Chapman& Hall, London, 1964, 100.
- Ohkawa, H., Ohishi, N. and Yagi, K., Anal. Biochem., 1979, 95,351.
- Ellman, G.L., Archives of Biochem. andBiophys., 1959, 82, 70.
- Kinter, M., In; Punchard, N.A., Kelly, G.J. Eds., Free Radicals- APractical Approach, Oxford University Press, Oxford, 1996, 136.
- Sastry, K.V.H., Moudgal, R.P., Mohan, J., Tyagi, J.S. and Rao, G.S.,Anal. Biochem., 2002, 10, 306.
- Snedecor, G.W., Cochran, W.G., In; Statistical Methods, Oxford &IBH Publishing Co. Pvt. Ltd., New Delhi 1967, 301.
- Bolton, S., In; Gennaro, A.R., Eds., Remington: The Science andPractice of Pharmacy, 19th Edn., Vol. I, Mack Publishing Company,Pennsylvannia, 1995, 111.
- Parola, M., Belloma, G., Robino, G., Barrera, G. and Diazani, M.U.,Antioxid. Redox Signal, 1999, 1, 255.
- Feller, D.R., Hagerman, L.M., Newman, H.A.I., Witiak, D.T., In; Foye,W.O., Lemke, T.L., Williams, D.A., Eds., Principles of MedicinalChemistry, B. I. Waverly Pvt. Ltd., New Delhi, 1995,523.
- Halliwell, B. and Gutteridge, J.M.C., Meth. Enzymol., 1990, 186,1.
- Kose, K., Dogan, P. and Ozesmi, P., Contraception, 1993, 47, 421.
- Pizzichini, M., Cinci, G., Pandelli, M.L., Aezzini, L. and Pagani, R.,Biochem. Soc. Trans., 1993, 21, 190s.
- Offer, T., Russo, A. and Samuni, A., FASEB, 2000, 14, 1215.
- Palozza, P., Calviello, G., Serini, S., Maggiano, N., Lanza, P., Ranelletti,F.O. and Bartoli, G.M., Free Radical Biol. Med., 2001, 30, 1000.
- Halliwell, B., Lancet, 1994, 344, 721.
- Hodnick, W.F., Ahmad, S. and Pardini, R.S., Adv. Exp. Med.Biol., 1998, 439, 131.
- Chen, C.Y., Holtzman, G.I. and Bakhit, R.M., Pakistan J. Nutr.,2002, 1, 1.
- Kosower, E.M., Kosower, N.S., In; Glutathione Metabolism andFunction, Raven Press, New York, 1976, 139.
- Kelly, E.E., Wagner, B.A., Buettner, G.R. and Burns, C.K., ArchivesofBiochem. andBiophys., 1999, 370, 97.
- Tannenbaum, S.R., Wishnock, J.S. and Leaf, C.D., Amer. J. Clin.Nutr., 1991, 53, 247s.
- Gupta, P. and Kar, A., J. Appl. Toxicol., 1998, 18, 31


