- *Corresponding Author:
- Yogita M. Charde
Department of Pharmaceutical Sciences
Rashtrasant Tukadoji Maharaj Nagpur University
Nagpur, Maharashtra 440033, India
E-mail: yogitacharde@gmail.com
| Date of Received | 17 July 2020 |
| Date of Revision | 20 April 2021 |
| Date of Acceptance | 12 August 2021 |
| Indian J Pharm Sci 2021;83(4):808-822 |
This is an open access article distributed under the terms of the Creative Commons Attribution-NonCommercial-ShareAlike 3.0 License, which allows others to remix, tweak, and build upon the work non-commercially, as long as the author is credited and the new creations are licensed under the identical terms
Abstract
Artemether-lumefantrine is World Health Organization approved fixed dose combination for malaria treatment. These drugs have poor bioavailability due to low solubility and dissolution. The objective of this work was to improve bioavailability by increasing solubility and dissolution of both drugs. In this work solid dispersion using hydrophilic carriers like polyvinylpyrrolidone K-30, Soluplus and Lutrol F68 by solvent evaporation technique was prepared and evaluated for solubility, flow property, differential scanning calorimetry, x-ray diffraction analysis, scanning electron microscopy, disintegration and dissolution study. The drugs were determined simultaneously by high performance liquid chromatography method using various surfactants in different dissolution media. Solubility of the drugs was increased in all solid dispersions compared to pure drugs. Flow properties of solid dispersions containing polyvinylpyrrolidone K-30 were better than other carriers and the disintegration time of immediate release tablet containing drug and polyvinylpyrrolidone K-30 (1:0.2) was less than other solid dispersions. X-ray diffraction analysis, differential scanning calorimetry and scanning electron microscopy results indicated decrease in crystalline nature of drugs and their dissolution rate was enhanced than plain drugs and marketed formulations in acidic buffer containing myrj 52 (1 %) as dissolution medium. The pharmacokinetic studies in mice revealed that artemether-lumefantrine solid dispersion immediate release tablet had higher area under the curve, maximum plasma concentration for artemether and lumefantrine than plain and marketed tablet. Thus this technique successfully improved solubility, dissolution rate and hence the bioavailability of artemether and lumefantrine which was determined by single dissolution method.
Keywords
Artemether, lumefantrine, solid dispersions, solubility, dissolution rate, bioavailability
Malaria is a life threatening mosquito-borne blood disease caused by Plasmodium parasite by infecting human blood cells. An effective antimalarial drugs such as artemether-lumefantrine (ART-LUME) combination minimizes the risk of disease and also shortens the duration of the illness[1,2]. Artemether (ART) and lumefantrine (LUME) which belongs to Biopharmaceutics classification system (BCS) class II/IV respectively[3], have different mechanisms of action, hence the possibility of the parasite developing resistance is low[4]. These poorly water soluble drugs have low dissolution and slow drug absorption and leads to inadequate and poor oral bioavailability. In order to increase bioavailability, solubility of a drug should be increased using solid dispersion (SD), the most effective technique[5]. The term SD is referred to the products containing two different components i.e. a hydrophilic matrix and a hydrophobic drug. The most commonly used hydrophilic carriers in the preparation of SDs are polyvinylpyrrolidone (Povidone, PVP K-30), polyethylene glycols (PEG 6000), Surfactants like Tween-80, Lutrol (LF 68) and sodium lauryl sulphate (SLS)[6]. The mechanisms involved in the SD techniques are particle size reduction, particles with high porosity, particles with improved wettability, drug in amorphous state, solubilization of the drug by the carrier at the diffusion layer[7].
SDs of drug substances in water soluble polymers such as PVP K-30, Lutrol and Soluplus (SOLU) are utilised to hydrophilize the surface of drug particles and in some cases it results in the amorphous form of drug which is more soluble than its crystalline counterpart. The physical state of the drug in a SD is also influenced by the preparation method. For instance melt mix, freeze drying and solvent evaporation of the same formulation has shown to result in variable degrees of crystallinity. But the solvent evaporation method is advantageous as the drug and the carrier are dissolved in a common solvent and then solvent is evaporated and low temperature is required for the preparation of dispersion and hence thermal decomposition of drugs and carriers is prevented[8,9].
The International Pharmacopoeia monograph of ART and LUME tablet include separate dissolution methods for ART and LUME. Hence, the high-performance liquid chromatography (HPLC) method was used for evaluating the in vitro release of ART and LUME from tablets using a single dissolution method by adding surfactant solutions which provides a medium possessing intermediate surface tension which effectively accommodates the drug substance which is otherwise insoluble in the pure solvent. So the solubility of low aqueous soluble drugs was increased by incorporating surfactants in the dissolution medium like SLS, Tween 80, benzalkonium chloride (BKC), cetrimide, myrj 52, etc.[10].
Bioavailability of a poorly soluble drug from a solid oral dosage form also depends on the release of the drug substance from the dosage form, i.e., disintegration of the solid oral dosage form which will increase the wettability of the drug by increasing the surface area of the drug particles[11]. The novelty of the work is the preparation of immediate release (IR) tablet using SDs of ART and LUME and performing the dissolution study of the prepared formulation in the single dissolution medium for the simultaneous estimation of both the drugs which has not been reported yet.
In the present work an attempt has been made to increase the drug solubility and to improve its dissolution rate and bioavailability by formulating SD using solvent evaporation method of ART and LUME with PVP K-30, SOLU and LF-68, the most commonly used hydrophilic carriers because they exhibit low toxicity, high aqueous solubility and can inhibit the crystallization. The SD was then evaluated by solubility study, flow properties and then characterized by differential scanning calorimetry (DSC), fourier-transform infrared spectroscopy (FTIR), scanning electron microscopy (SEM) and X-ray diffractometry (XRD) and then formulating IR tablet of optimized SD to increase the disintegration and dissolution rate of both the drugs. The solubility studies of the drugs and SDs were performed by HPLC method in different dissolution media in which various surfactants like SLS, Tween 80, BKC and myrj 52 were added individually and the single dissolution media was optimized and was further used to study dissolution rate of ART and LUME simultaneously. The pharmacokinetic study in mice was performed to compare the bioavailability of optimized SD tablet with the plain and marketed formulation.
Materials and Methods
ART and LUME were obtained as a generous gift from Mylan Lab. Bollaram, Hyderabad, India. The polymers, viz. PVP K-30, were purchased from Sisco Research Laboratories Pvt. Ltd., Taloja, Maharashtra, India. SOLU and LF-68 were supplied by Badische Anilin & Soda-Fabric AG (BASF) Corporation, Mumbai, India. All solvents used were of HPLC grade and were procured from Merck India Ltd. and myrj 52 was provided by Mohini Organics (Mumbai).
Preparation of SD by solvent evaporation method:
SD of ART and LUME was prepared individually with PVP K-30, SOLU and LF 68, by solvent evaporation method as shown in Table 1. The drug and the polymer were dissolved in adequate quantity of solvent (acetone for ART and chloroform for LUME) and stirred continuously for about 30 min at room temperature to obtain a clear solution. Solvent was allowed to evaporate and then the prepared dispersion was passed through sieve to get uniform dispersion. SDs were evaluated for DSC, FTIR, XRD, SEM, solubility studies and in vitro dissolution studies[12].
| Batch | Formulation type | Ratio | Batch | Formulation type |
|---|---|---|---|---|
| Drug | ART | Drug | LUME | |
| A1 | ART:PVP K-30 | 01:00.2 | L1 | LUME:PVP K-30 |
| A2 | ART:PVP K-30 | 01:00.4 | L2 | LUME:PVP K-30 |
| A3 | ART:PVP K-30 | 01:00.6 | L3 | LUME:PVP K-30 |
| A4 | ART:PVP K-30 | 01:00.8 | L4 | LUME:PVP K-30 |
| A5 | ART:PVP K-30 | 01:01 | L5 | LUME:PVP K-30 |
| A6 | ART:PVP K-30 | 01:02 | L6 | LUME:PVP K-30 |
| A7 | ART:SOLU | 01:01 | L7 | LUME:SOLU |
| A8 | ART:SOLU | 01:02 | L8 | LUME:SOLU |
| A9 | ART:LF 68 | 01:01 | L9 | LUME:LF 68 |
| A10 | ART:LF 68 | 01:02 | L10 | LUME:LF 68 |
| A11 | ART:PVP K-30:LF 68 | 01:01:01 | L11 | LUME:PVP K-30:LF 68 |
| A12 | ART:SOLU:LF 68 | 01:01:01 | L12 | LUME:SOLU:LF 68 |
ART: Artemether; LUME: lumefantrine; SD: solid dispersion; PVP K-30: polyvinylpyrrolidone K-30; SOLU: Soluplus and LF 68: Lutrol F68
Table 1: ART and LUME SD with PVP K-30, SOLU and LF-68
Preparation of physical mixtures (PMs):
For comparison purpose, PMs having the same composition of the SDs were prepared by simply triturating the drug and the polymers in a porcelain mortar. The mixtures were then sieved and stored in glass capped containers.
HPLC analysis:
ART and LUME sample media which were used in dissolution and solubility studies were withdrawn and were diluted appropriately and passed through 0.45 μ nylon filter paper. Analysis for ART and LUME using HPLC (Shimadzu) required C18 columns (4.6 mm×250 mm, 5 μ) and photodiode-array (PDA) detector recording absorbance at 216 nm wavelength. The mobile phase consisted of a mixture of buffer and acetonitrile (ACN) (20:80, v/v) at a flow rate of 1.0 ml/min. The buffer for mobile phase was prepared by diluting 5 ml of triethylamine in HPLC grade water and its volume was made upto 1000 ml and the pH upto 3.0±0.05 was adjusted using orthophosphoric acid. The injection volume was maintained at 20 μl. A calibration curve was established by plotting the area of absorbance peak (recorded from the injection of known quantities of ART and LUME) as a function of concentration (over a range 20-120 μg/ml for ART and 120-600 μg/ml LUME) and the data was modeled using a linear regression equation (y=mx+b). Area under the curve (AUC) data of samples was assessed using the calibration curve to determine ART and LUME concentration. This HPLC method yielded a retention time of 6 min for ART and 12 min for LUME with sharp peak, good peak symmetry and with well-defined resolution. The above method is a single dissolution method which has been used in the solubility and in vitro release studies of ART and LUME[10].
Preliminary solubility studies of ART and LUME:
An excess quantity of drugs was placed separately in 20 ml capacity vials containing 10 ml of different solutions as mentioned in the Table 2[10]. The samples were sonicated for 20 min at room temperature and capped vials were shaken at 75 rpm for 48 h at 37±0.5° in a mechanical shaker. The solutions in the vials were kept for centrifugation for 20 min at 10 000 rpm. The supernatant solution was then passed through a 0.45 μm nylon filter paper and the amount of the drug dissolved was analyzed by HPLC[13].
| Sr. No. | Medium |
|---|---|
| 1 | Distilled water |
| 2 | 0.1 N HCl (pH-1.2) |
| 3 | Phosphate buffer (pH-7.2) |
| 4 | Distilled water+1 % SLS |
| 5 | 0.1 N HCl (pH-1.2)+1 % SLS |
| 6 | Phosphate buffer (pH-7.2)+1 % SLS |
| 7 | Distilled water+1 % myrj |
| 8 | 0.1 N HCl (pH-1.2)+1 % myrj |
| 9 | Phosphate buffer (pH-7.2)+1 % myrj |
| 10 | Distilled water+1 % BKC |
| 11 | 0.1 N HCl (pH-1.2)+1 % BKC |
| 12 | Phosphate buffer (pH-7.2)+1 % BKC |
| 13 | Distilled water+1 % Tween 80 |
| 14 | 0.1 N HCl (pH-1.2)+1 % Tween 80 |
| 15 | Phosphate buffer+1 % Tween 80 |
SLS: sodium lauryl sulphate; BKC: Benzalkonium chloride
Table 2: Solubility of ART and LUME in Surfactant Solution
Solubility studies of SDs in water:
The solubility studies of prepared SDs of ART and LUME in water was determined following the same procedure as mentioned in preliminary solubility studies of ART and LUME[13].
Solubility studies of optimized SDs in the dissolution medium:
The solubility studies as per mentioned earlier was followed for optimized SDs of ART and LUME in different dissolution media such as water with 1 % myrj, 0.1 N HCl simulated gastric fluid (SGF) (pH 1.2) with 1 % myrj and phosphate buffer, simulated intestinal fluid (SIF) (pH 7.2) with 1 % myrj and the results are depicted in Table 3.
| Drug and SDs | Medium 1 (µg/ml) | Medium 2 (µg/ml) | Medium 3 (µg/ml) |
|---|---|---|---|
| ART | 0.511±0.89 | 0.735±1.32 | 0.808±1.41 |
| LUME | 0.437±0.57 | 0.669±0.86 | 0.369±0.84 |
| ART:PVP K-30 SD (1:0.2) | 3.316±1.12 | 5.104±0.98 | 5.867±0.96 |
| LUME:PVP K-30 SD (1:0.2) | 2.178±0.74 | 3.143±1.23 | 2.69±1.40 |
Medium 1: Distilled water with 1 % myrj; Medium 2: pH 1.2 buffer (0.1 N HCl) with 1 % myrj; Medium 3: phosphate buffer pH 7.2 with 1 % myrj
Table 3: Solubility of SDs in Different Dissolution Media
Powder flow characterization:
The flow properties of SDs of ART and LUME such as bulk density, tapped density and angle of repose were carried out using standard procedures. Characteristic flow parameters like Hausner’s ratio and Carr’s index were calculated and results are depicted in Table 4[8].
| Flow property | Angle of repose (°) | Bulk density (g/cm3) | Tapped density (g/cm3) | Carr’s index (%) | Hausner’s ratio |
|---|---|---|---|---|---|
| A1 | 34.39±0.36 | 0.33±0.41 | 0.40±0.51 | 17.30±0.23 | 1.21±0.74 |
| A2 | 33.59±0.36 | 0.35±0.62 | 0.42±0.17 | 16.66±0.12 | 1.20±0.43 |
| A3 | 32.09±0.27 | 0.38±0.54 | 0.45±0.28 | 15.55±0.48 | 1.18±0.52 |
| A4 | 31.23±0.39 | 0.41±0.19 | 0.47±0.17 | 12.76±0.18 | 1.14±0.73 |
| A5 | 28.52±1.03 | 0.45±0.34 | 0.51±0.29 | 11.76±0.41 | 1.13±0.41 |
| A6 | 27.07±0.63 | 0.55±0.91 | 0.62±0.29 | 11.29±0.27 | 1.11±0.66 |
| A7 | 37.98±0.46 | 0.33±0.63 | 0.41±0.52 | 19.51±0.22 | 1.24±0.22 |
| A8 | 38.56±0.82 | 0.29±0.82 | 0.38±0.69 | 23.68±0.82 | 1.31±0.43 |
| A9 | 39.27±0.91 | 0.37±0.11 | 0.46±0.12 | 19.56±0.92 | 1.24±0.71 |
| A10 | 37.56±0.82 | 0.32±0.82 | 0.41±0.79 | 21.95±0.82 | 1.28±0.93 |
| A11 | 31.39±0.76 | 0.39±0.14 | 0.48±0.21 | 18.75±0.79 | 1.23±0.83 |
| A12 | 37.96±0.49 | 0.31±0.22 | 0.42±0.33 | 26.19±0.35 | 1.35±0.72 |
| L1 | 36.09±0.16 | 0.41±0.62 | 0.50±0.92 | 18.00±0.31 | 1.21±0.62 |
| L2 | 35.45±0.19 | 0.42±0.79 | 0.51±0.78 | 17.64±0.12 | 1.21±0.12 |
| L3 | 34.28±0.98 | 0.44±0.87 | 0.53±0.18 | 16.98±0.10 | 1.20±0.58 |
| L4 | 33.21±0.27 | 0.45±0.11 | 0.52±0.67 | 13.46±0.11 | 1.15±0.47 |
| L5 | 29.48±0.08 | 0.48±0.34 | 0.55±0.29 | 12.72±0.14 | 1.14±0.51 |
| L6 | 28.14±0.26 | 0.51±0.14 | 0.58±0.19 | 12.06±0.21 | 1.13±0.12 |
| L7 | 39.71±0.14 | 0.38±0.12 | 0.47±0.14 | 19.14±0.59 | 1.23±0.68 |
| L8 | 39.85±0.18 | 0.36±0.46 | 0.46±0.62 | 21.73±0.18 | 1.27±0.12 |
| L9 | 40.07±0.11 | 0.39±0.82 | 0.48±0.59 | 18.75±0.82 | 1.23±0.73 |
| L10 | 39.16±0.41 | 0.37±0.82 | 0.46±0.79 | 19.56±0.15 | 1.24±0.12 |
| L11 | 34.12±0.25 | 0.40±0.11 | 0.49±0.59 | 18.36±0.55 | 1.22±0.88 |
| L12 | 39.89±0.24 | 0.32±0.15 | 0.42±0.14 | 23.80±0.14 | 1.31±0.69 |
All values are expressed as average±SD, n=3
Table 4: Flow Properties of ART and LUME SDs
Compression of SDs into IR tablets:
The IR tablets of plain drugs and their SDs were prepared by direct compression technique. In each tablet ART (20 mg) and LUME (120 mg) and equivalent weights of all SDs were used to compress 400 mg tablet. Cros Povidone (CP) (5 % w/w) was used as a superdisintegrant while microcrystalline cellulose (MCC) pharmaceutical grade (PH 102) and mannitol in same proportion were used as diluents and magnesium stearate as lubricant and talc as glidant were used. All the ingredients were weighed accurately and were passed through 60 mesh before use. The resulting blend was directly compressed into tablets keeping tablet weight and hardness constant using a rotary tablet machine. Compressed tablets were evaluated for disintegration test and in vitro dissolution studies.
Disintegration test:
In the disintegration apparatus one tablet was placed in each of the six cells containing 900 ml of 0.1 N HCl buffer and 1 % myrj 52 as dissolution medium at 37±0.5° and the apparatus was operated until no residue of the tablet aggregates remain on the basket mesh, at this point the time of disintegration was recorded.
In vitro dissolution studies:
The quick release of the drug in the dissolution medium can be ensured from the in vitro dissolution studies[14]. In vitro dissolution studies of ART and LUME and their SDs compressed into IR tablets were carried out using United States Pharmacopeia (USP) type II dissolution testing apparatus (paddle type) in 900 ml of 0.1 N HCl buffer and 1 % myrj 52 as dissolution medium at 37±0.5° at speed of 100 rpm and analyzed by HPLC method.
Analysis of drug content:
The SDs equivalent to 20 mg of ART and 120 mg of LUME were transferred to a 100 ml volumetric flask. Add about 50 ml of ACN and sonicate to dissolve and make volume up to the mark with ACN, then dilute 1.0 ml of this solution to 100 ml with ACN. The total amount of drug within the tablets was analyzed by HPLC method[8].
Stability studies:
A weighed amount of optimized ART SD and LUME SD about 100 mg and the optimized tablet formulation were placed in crucibles at room temperature and at 40±2º and humidity condition at 75±5 % relative humidity (RH) for 6 mo as per international council for harmonisation (ICH) guidelines, in the stability chamber. Samples were removed after 1, 3 and 6 mo, and also tested for drug content, disintegration and dissolution studies. SDs generally have the tendency to convert from amorphous state to crystalline state after storage and therefore characterized by XRD and DSC for evaluating the physical state of the drug after storage[15].
Solid state characterization:
DSC: The thermal behavior and interaction of pure drugs (ART and LUME), polymers and their SDs were studied using Shimadzu DSC 60 Plus, Marathwada Institute of Technology (MIT), Aurangabad. Accurate quantity of samples were crimped in aluminium pans and heated at an increment of 10°/min under a nitrogen purge (20 ml min-1) from 0° to 160°[8].
FTIR spectroscopy: FTIR analysis was performed on samples of ART, LUME, PVP K-30, SOLU, Lutrol F68 (LF-68) and their SDs. The infrared spectra of samples were obtained from FTIR spectrophotometer (Shimadzu, Japan). Samples were mixed with dry potassium bromide using a mortar and pestle, compressed to prepare a disk and analyzed over a range 4000-400 cm-1.
Powder XRD studies: The crystallinity of pure drugs, their PMs with carriers and their optimized SDs were assessed by XRD studies (Bruker D-8 advance Germany). The results were recorded over a range of 0-40° (2θ) using the Copper (Cu) target X-ray tube and xenon gas (Xe) filled detector. The operating conditions were voltage 40 kV, current 20 mA, scanning speed 1/min, temperature of acquisition: room temperature, detector: scintillation counter detector and sample holder: non rotating holder[16].
SEM: The surface characteristics of samples were studied by SEM (ZEISS EVO 18 Germany). The aluminium stubs were coated with platinum plasma beam using auto fine coater to make layer of 2 nm thickness above the sprinkled powder and were placed in the vacuum chamber of a scanning electron microscope. The samples were observed for morphological characterization using a gaseous secondary electron detector[17].
In vivo pharmacokinetic study:
Animals: The animals (Swiss albino mice weighing 30-35 g) were housed in polypropylene cages kept at 25±2° temperature and 55±5 % RH, with free access to diet and water ad libitum. The animals were fasted 8 h prior to treatment with free access to water. All experiments adhered to the Institutional Animal Ethics Committee (IAEC/UDPS/2017/17).
Administration and collection of blood samples: Animals were divided in 4 groups of which 4 animals per group (n=4). 0.5 % sodium alginate solution was administered orally to Group I animals and served as normal control. ART-LUME SD IR tablet suspension was administered to Group II animals while ART-LUME plain IR tablet suspension to Group III animals and ART-LUME marketed tablet to Group IV animals, all tablets suspension equivalent to ART/LUME (1/6 mg/kg body weight) diluted with 0.5 % sodium alginate solution were administered orally once to all group animals. The plasma samples were collected at time intervals of 0.25, 0.5, 1, 2, 6, 12, 24, 48 and 72 h after administration. 0.25 ml of blood samples were collected from the retro-orbital plexus into microfuge tubes containing required amount of anticoagulant (ethylenediamine tetraacetic acid (EDTA)). The tube containing blood was centrifuged at 10 000 rpm for 10 min to harvest the plasma and finally stored at -20° until analysis.
HPLC quantification of drugs in plasma samples:
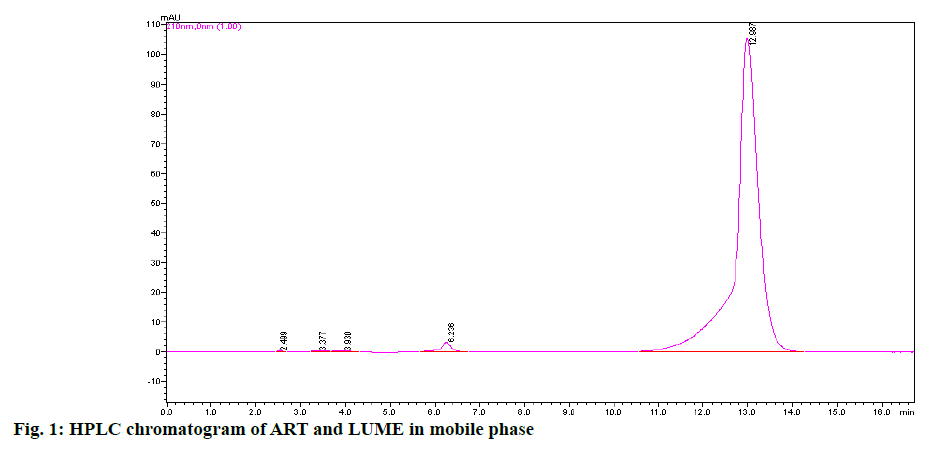
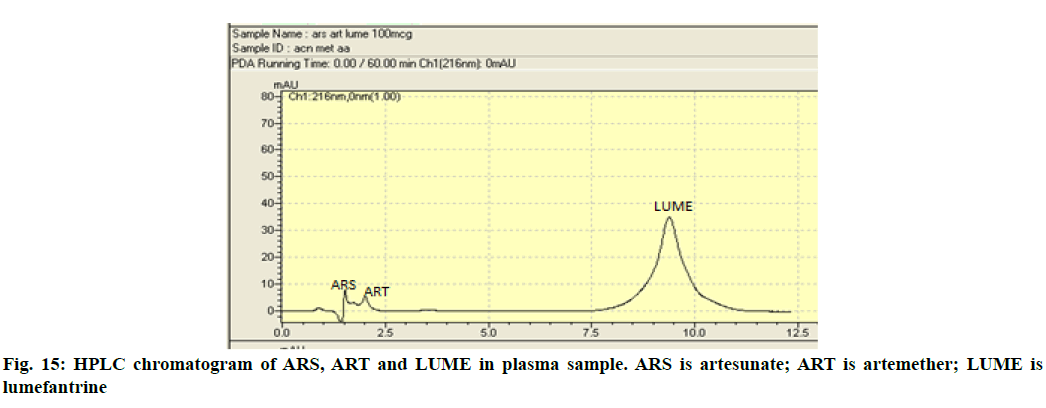
Briefly, an aliquot (100 μl) of plasma sample was mixed with 50 μl of internal standard (IS) solution (artesunate (ARS) 100 μg/ml) and 50 μl of drug solution (containing both drugs). After vortexing for 30 s a protein precipitating agent ACN (500 μl) was added and vortexed for 1 min. The mixture was centrifuged at 10 000 rpm for 20 min and the supernatant was filtered and 20 μl of the filtrate was injected onto the HPLC system[16]. The mobile phase consists of ACN:methanol (50:50, v/v) and 0.01 M ammonium acetate (pH 4.5) in the ratio of 95:5 (v/v). The system was run in isocratic mode with at a flow rate of 1 ml/min[18]. The injection volume was 20 μl and the effluents were monitored at wavelength of 216 nm with a run time of 2.019 min and 9.030 min for ART and LUME, respectively (fig. 1). Calibration curves were used for the conversion of the chromatographic area to the concentration of both drugs. Calibrator and quality control samples were prepared by adding appropriate volumes of standard drug solution in ACN to drug free plasma. The calibration graphs were linear in the range of 100-500 μg/ml for ART and LUME. This modified HPLC method with PDA detection was found to be simple, accurate and suitable for the routine quantification of therapeutic levels of ART and LUME in mice plasma.
Pharmacokinetic data analysis: The pharmacokinetic analysis of plasma concentration-time data such as maximum plasma concentration (Cmax) and time to reach the maximum plasma concentration (Tmax) and the area under the plasma concentration time curve (AUC)0–72 was analyzed using pharmacokinetic PK Solver software.
Statistical analysis:
The values of all pharmacokinetic parameters were expressed as mean±standard deviation (SD). All parameters were analyzed statistically by one way analysis of variance (ANOVA).
Results and Discussion
The solubility studies, dissolution studies and drug contents of ART and LUME and their SDs were determined by the HPLC method using a calibration curve. The chromatogram of the ART and LUME is shown in fig. 1.
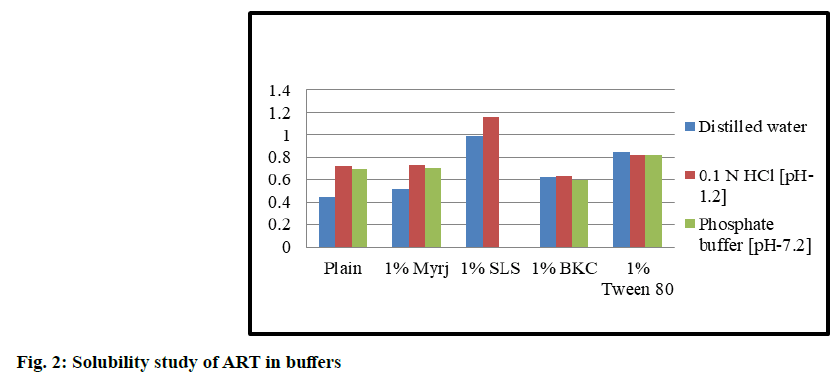
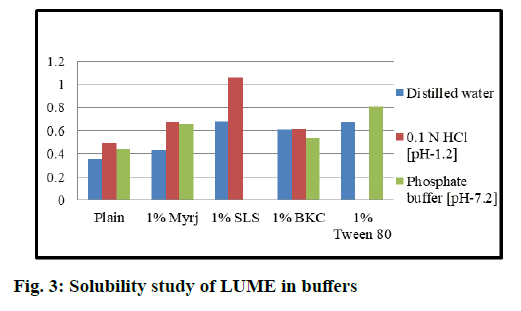
Preliminary solubility studies of ART and LUME results obtained, were discussed below. Solubility studies of ART and LUME were carried out in distilled water (neutral pH 7.0), acidic pH 1.2 (0.1 N HCl) and phosphate buffer solution pH 7.2. The solubility of ART was found to be 0.443 mg/ml, 0.725 mg/ml and 0.701 mg/ml in pH 7.0, 1.2 and 7.2 respectively. The solubility of LUME was found to be 0.351 mg/ml, 0.493 mg/ml and 0.459 mg/ml in neutral pH 7.0, acidic pH 1.2 and phosphate buffer solution pH 7.2.
Solubility studies of ART and LUME in different surfactants solutions were observed as shown in fig. 2 and fig. 3. The solubility of ART and LUME was found to be increased with the addition of surfactant. The highest solubility was obtained in 1 % SLS solution than myrj, BKC and Tween 80. But precipitation was observed using 1 % SLS in pH 7.2 phosphate buffer. Hence 1 % myrj was selected as the final surfactant as the solubility was higher than other surfactants and showed no precipitation in any pH solution. From the results it was observed that the best solubility medium for ART and LUME was 0.1 N HCl (acidic pH 1.2) with 1 % myrj.
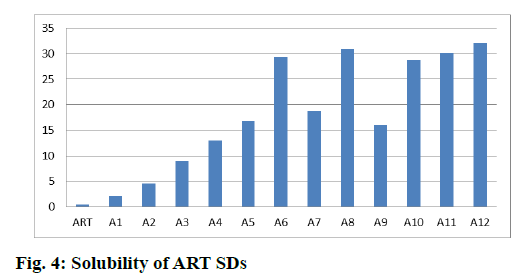
Solubility studies of SDs in water are discussed below. Solubility of ART was increased by 4.77 times in case of ART:PVP K-30 (1:0.2) and 66.27 times in case of ART:PVP K-30 (1:2) while it is increased by 69.93 times in case of ART:SOLU (1:2) and by 64.76 times in case of ART:LF 68 (1:2). When a combination of carriers of PVP K-30 and LF 68 was used, there was further increase in solubility of ART and the solubility increased by 67.99 times while in combination of SOLU and LF 68 it was increased by 72.55 times as shown in fig. 4.
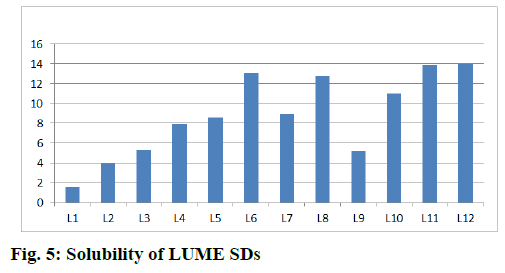
Similarly the solubility of LUME was increased by 4.42 times in case of LUME:PVP K-30 (1:0.2) and 24.52 times in case of LUME:PVP K-30 (1:2) while it was increased by 36.46 times in case of LUME:SOLU (1:2) and by 31.39 times in case of LUME:LF68 (1:2). When a combination of carriers of PVP K-30 and LF 68 was used, there was further increase in solubility of LUME and the solubility increased by 39.48 times while in combination of SOLU and LF 68 it was increased by 39.94 times as shown in fig. 5.
Evaluation of flow properties of SDs were discussed below. The characterization of flow properties of SD is important in preparation of tablet. The angle of repose can be correlated with type of flow of powder or granules. The angle of repose below 25° indicates excellent flow, 25° to 30º indicates the good flow while the angle of repose 30° to 40º indicates passable flow. All the batches showed passable flow (30°-40°) except A5, A6 and L5, while L6 showed good flow (25°-30°) as shown in Table 4.
The bulk density and tapped density of granules or powder are important parameters in the compressibility of the granules or powder. The bulk density was between 0.29-0.55 g/cm2 for ART SD and 0.32-0.51 g/cm2 for LUME SD and tapped density was between 0.38-0.62 g/cm2 for ART SD and 0.42-0.58 g/cm2 for LUME SD. The Hausner’s ratio is another parameter indicating the flow properties. It was found to be between 1.1-1.35. The value of ratio between 1.2-1.6 indicates good flow and below 1.2 shows excellent flow.
The Carr’s index also indicates compressibility of the powder or granules. The value between 5-15 % shows excellent flow, between 12-16 % shows good flow, 18-21 % shows fair flow and between 23-28 % shows poor flow. The SDs of ART and LUME containing PVP K-30 showed values between 11-18 % indicates the good to fair flow while the SDs containing SOLU and LF 68 showed values between 19-26 % showed fair to poor flow.
Flow properties revealed easier scale up and feasibility of prepared SDs using solvent evaporation method. From the observations the SDs of both the drugs show acceptable flow properties with the A6 and L6 batch having excellent flow properties. This indicates that as the concentration of the PVP K-30 the flow property was increased but SDs containing SOLU and LF 68 showed to have poor flow. The order can be summarized as A1<A2<A3<A4<A5<A6>A7>A8<A9>A10<A11>A12. Same observation was found in the case of LUM SD L1<L2<L3<L4< L5<L6>L7>L8<L9>L10<L11>L12. From the observations it was found that the SDs containing PVP K-30 showed good flow properties and these SDs were selected for further studies.
Disintegration test of IR tablets of the prepared SDs and their optimization was as follows. From the disintegration test as shown in Table 5, it was observed that with increase in concentration of PVP K-30, SOLU and LF 68 the disintegration time was increased i.e. more than 30 min, which was not suitable for the IR tablet and also showed sticking problem during compression of tablet but as the concentration of PVP K-30 decreased disintegration time was decreased with no sticking problem and hence the batch containing PVP K-30 in the ratio 1:0.2 was selected as the final batch for preparation of IR tablet and was studied for solid state characterization.
| Batch IR tablet | Disintegration time |
|---|---|
| Plain ART+LUME IR tablet | 80 s |
| ART+LUME (1:0.2) (A1+L1) IR tablet | 51 s |
| ART+LUME (1:0.4) (A2+L2) IR tablet | 3 min 19 s |
| ART+LUME (1:0.6) (A3+L3) IR tablet | 9 min 42 s |
| ART+LUME (1:0.8) (A4+L4) IR tablet | 16 min |
| ART+LUME (1:1) (A5+L5) IR tablet | >30 min |
| ART+LUME (1:2) (A6+L6) IR tablet | >30min |
| ART+LUME (1:1) (A7+L7) IR tablet | >30 min (sticking) |
| ART+LUME (1:2) (A8+L8) IR tablet | >30 min (sticking) |
| ART+LUME (1:1) (A9+L9) IR tablet | >30 min (sticking) |
| ART+LUME (1:2) (A10+L10) IR tablet | >30 min (sticking) |
| ART+LUME (1:1:1) (A11+L11) IR tablet | >30 min (sticking) |
| ART+LUME (1:1:1) (A12+L12) IR tablet | >30 min (sticking) |
IR: immediate release
Table 5: Disintegration Test of IR Tablet
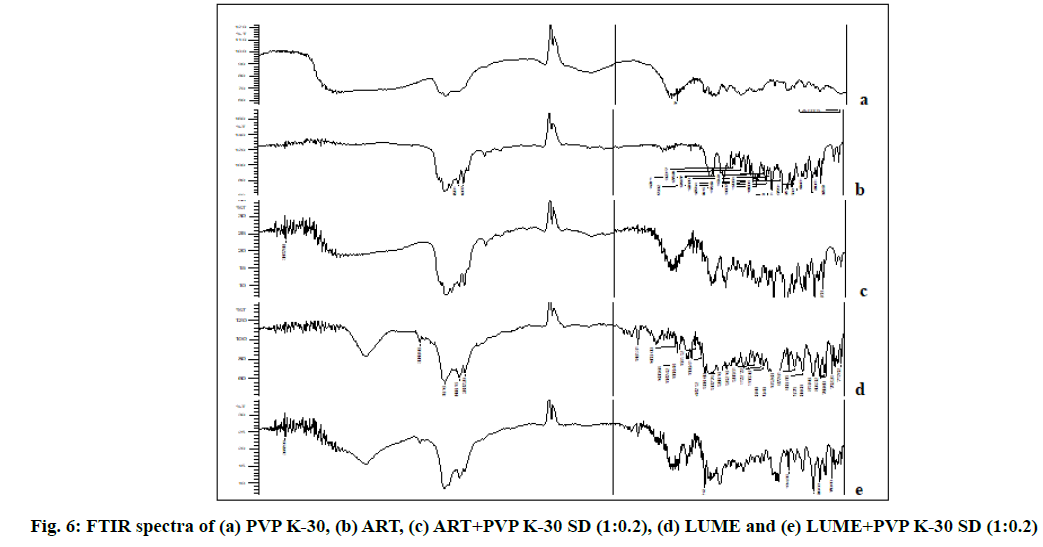
Solid state characterization of the optimized SDs was discussed below. The FTIR spectrum of ART and LUME was recorded, the values of peaks confirmed with the reported peaks and it was in accordance with its chemical structure. FTIR spectra of ART and LUME are shown in fig. 6. The bands at 1055.06 cm-1 (C-O stretching), 2872.01 cm-1 (C-H stretching), 1433.11cm-1 (C-H bending), 1136.07 cm-1 (C-O stretching), 1188.15 cm-1 (C–O–O–C bending vibrations), are present in the structure of ART and can be seen in the FTIR spectra of the free ART and ART–PVP K-30 SD. Similarly the bands at 3398.70 cm-1 (O-H stretching), 1070.49 cm-1 (C-O stretching), 2955.86 cm-1 (C-H stretching), 3089.96 cm-1 (=C-H stretching), 875.68 cm-1 (=C-H bending), 1635.64 cm-1 (C=C stretching), 769.60 cm-1 (C-Cl stretching), 1083.99 cm-1 (C-N stretching), 1487.10 cm-1 (C=C stretching (aromatic)) present in the structure of LUME and can be seen in the FTIR spectra of the free LUME and LUME–PVP K-30 SD as shown in fig. 6. No significant change in the absorption bands of ART and LUME skeleton was observed by the addition of polymer.
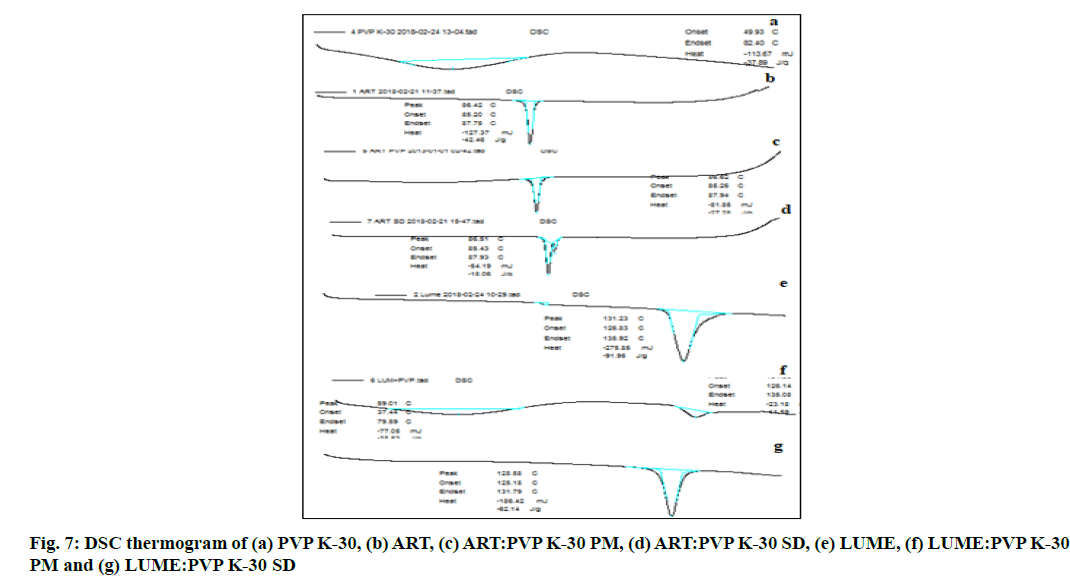
The DSC thermograph as shown in fig. 7 of ART showed a sharp endothermic peak at 86.42° (Enthalpy (ΔH)=42.4 Joules (J)/g) which relates to the melting point of the drug and that of ART-PVP K-30 PM showed a peak at 86.62° (ΔH=27.2 J/g) whereas DSC thermograph of ART-PVP K-30 SD showed a peak at 86.51° (ΔH=3.8 J/g).
The DSC thermograph as shown in fig. 7 of pure LUME showed a sharp endothermic peak at 131.2° (ΔH =91.95 J/g) which relates to the melting point of the drug whereas DSC thermograph of LUME-PVP K-30 PM showed a peak at 131.36° (ΔH=11.59 J/g) while DSC thermograph of LUME-PVP K-30 SD showed a peak at 128.5° (ΔH=62.14 J/g). The DSC thermograph of ART and LUME showed sharp endothermic peak which indicates crystalline nature of the drugs while pure PVP K-30 did not show any sharp endothermic peak due of its amorphous nature. The DSC thermogram of PMs and SDs of ART and LUME showed decrease in the ΔH as compared to that of the DSC thermogram of pure drug which indicates that the drug has been converted to the amorphous form.
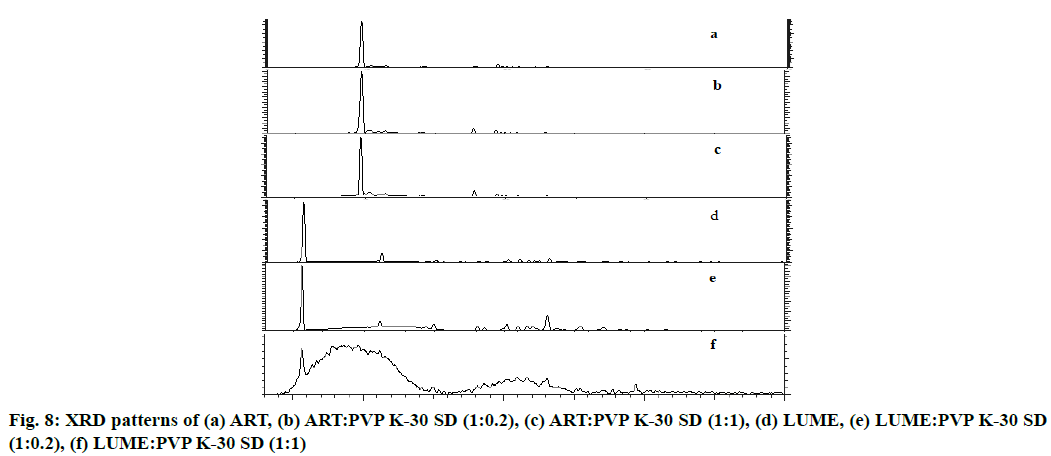
X-ray diffraction patterns as shown in fig. 8a of pure ART revealed that it is a crystalline compound, showing very strong diffraction peak at 2θ of 9.653° with intensity count=547 410 Lin (counts) and in case of ART SD (1:0.2) as shown in fig. 8b sharp peak was observed at 2θ of 9.688° with intensity count=119687 Lin (counts). In case of ART SD (1:1) as shown in fig. 8c peak was at 2θ of 9.633° with intensity count=55306 Lin (counts).
XRD patterns as shown in fig. 8d of pure LUME also revealed that LUME is a crystalline compound, showing very strong diffraction peaks at 2θ of 5.541° with intensity count=53251 Lin (counts) and of LUME SD (1:0.2) as shown in fig. 8e sharp peak was at 2θ of 5.567° with intensity count=13318 Lin (counts). In case of LUME SD (1:1) as shown in fig. 8f a peak was at 2θ of 5.596° with intensity count=621 Lin (counts).
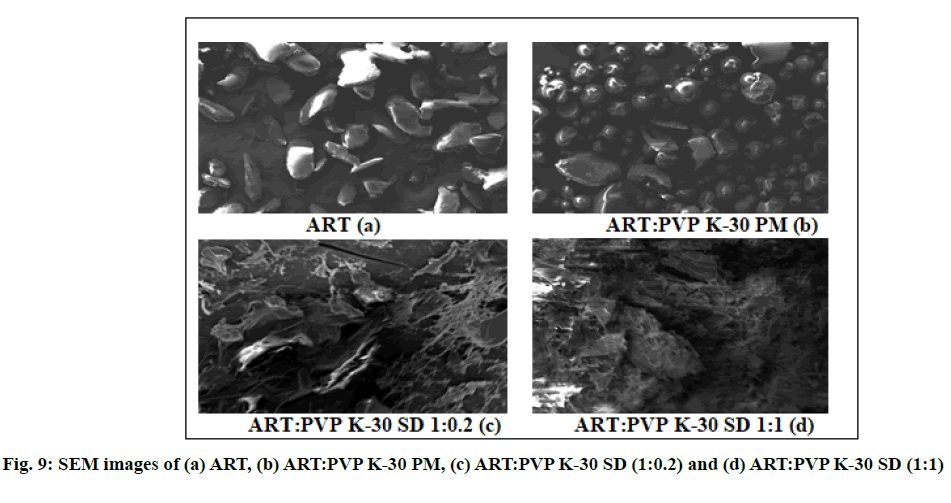
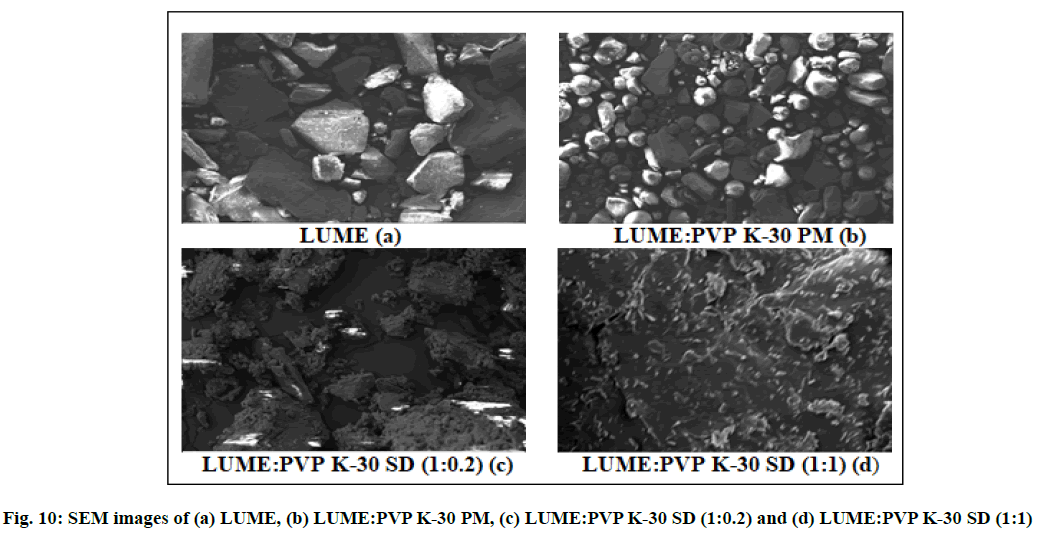
ART and LUME produced strong XRD peaks, indicating the crystalline structure. PVP K-30 changed the crystalline status of ART and LUME, with most characteristic ART and LUME peaks but reduced peak intensities, especially with high PVP K-30 content (fig. 8), indicating a loss of ART and LUME crystalline structure and hence confirms the amorphous nature of ART, LUME in SDs. Partial crystalline peaks observed which may be due to some amount of micro drug particles present on the surface which also observed during SEM analysis. These crystalline particles did not affect to the overall physical stability, dissolution of final SD formulations.
SEM micrographs of pure ART, LUME, their PMs and SDs are shown in fig. 9 and fig. 10. SEM micrographs of pure ART and LUME revealed large crystalline blocks as compared to their PMs, whereas their SDs were found to be without sharp edges. From the SEM micrograph it was evident that SDs of ART and LUME resulted in a significant particle size reduction. The SD appeared to be agglomerated with rough surface owing to the presence of polymer.
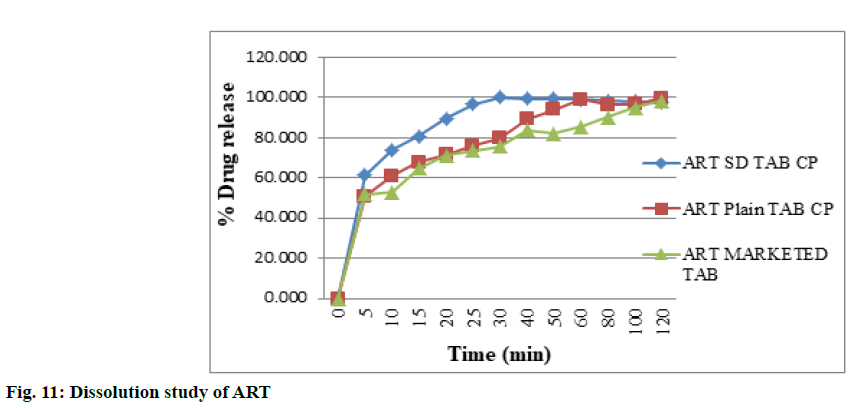
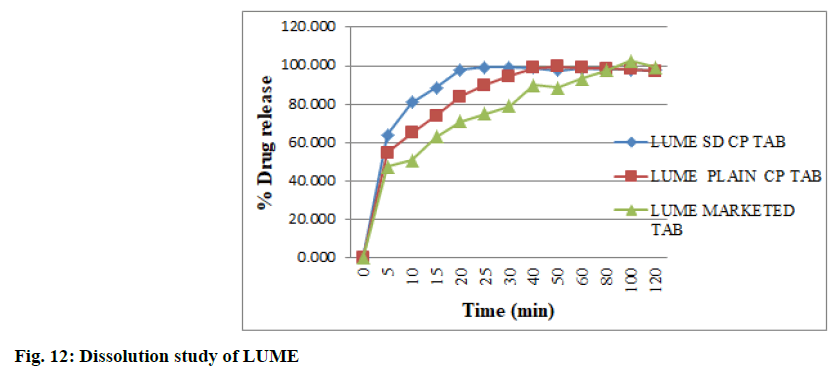
The dissolution study was carried out in the 0.1 N HCl with 1 % myrj due to high solubility of both drugs in the same medium was observed as compared to water and phosphate buffer with different surfactants as per the solubility study. The dissolution rate and extent of ART SD (1:0.2) and LUME SD (1:0.2) was increased as compared to plain ART and LUME as shown in fig. 11 and fig. 12 respectively. The IR tablet prepared using ART SD (1:0.2) and LUME SD (1:0.2) released 96.69 % ART and 99.11 % LUME within 25 min whereas IR tablet containing plain ART and LUME released 75.94 % ART and 89.917 % LUME and marketed tablet released 71.02 % ART and 78.34 % LUME. This might be because of the increase in effective surface area over which the drug distribution increases accompanied by an enhancement in drug dissolution. Thus the observed dissolution rate enhancement could be attributed to the combined function of SD and rapid disintegration which lead to enhanced wettability by increasing the surface area of the drug particles.
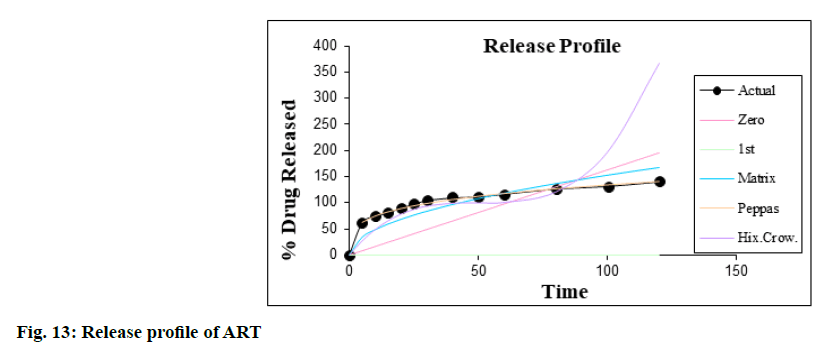
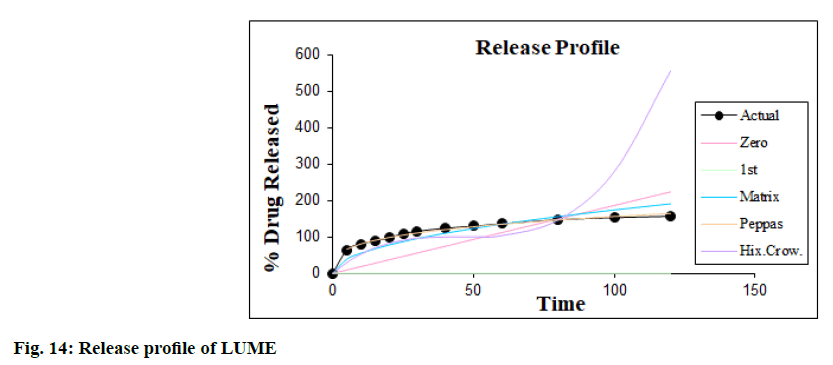
The dissolution kinetic studies were carried out and the best suited results obtained in the case of Korsmeyer- Peppas equation model as shown in fig. 13 and fig. 14. The value of R2 in Korsmeyer-Peppas model is 0.9967 (n= 0.2768, k=39.0318) for ART and 0.9976 (n=0.2991, k=39.8804) for LUME i.e. nearer to 1 in IR tablet containing their SDs and thus it was concluded that dissolution followed Korsmeyer-Peppas order kinetics.
SDs of ART and LUME and their tablet formulation were kept for stability studies for 6 mo at room temperature and 40o/75 % RH. Samples were withdrawn and analyzed. No significant change was observed as shown in Table 6 in the percent drug content of ART SD and LUME SD and in the disintegration time of their IR tablet before and after storage at room temperature and at 40o/75 % RH. The dissolution profile of SDs was found to be similar before and after storage (data not shown). The SDs were also characterized by XRD and DSC for evaluating the physical state of the drug after storage. The DSC thermograms of ART and LUME SDs after storage were similar to the initial systems. The XRD results demonstrate no change when compared with graphs of fresh SDs, which confirms the amorphous nature of the SDs of ART and LUME. It further confirmed that there was no crystallization of the amorphous drug in the SDs, suggesting good physical stability.
| Condition | % Drug content | ||||
|---|---|---|---|---|---|
| Drug | 0 d | 1 mo | 3 mo | 6 mo | |
| Room temperature | ART | 99.58±0.92 | 99.34±0.56 | 99.19±0.73 | 98.92±0.88 |
| LUME | 98.72±0.81 | 98.59±0.78 | 98.22±0.89 | 98.15±0.62 | |
| 40°/75 % RH | ART | 99.45±0.64 | 99.12±0.61 | 98.89±0.91 | 98.64±0.89 |
| LUME | 98.81±0.72 | 98.75±0.82 | 98.39±0.68 | 98.18±0.75 | |
| Disintegration time (s) | |||||
| Room temperature | ART | 52.33±1.52 | 51.66±1.15 | 53.33±1.15 | 55.00±1.00 |
| 40o/75 % RH | LUME | 51.33±0.57 | 52.33±0.57 | 54.33±1.52 | 56.33±1.52 |
All values are expressed as average±SD, n=3
Table 6: Stability Studies of Optimized Formulation
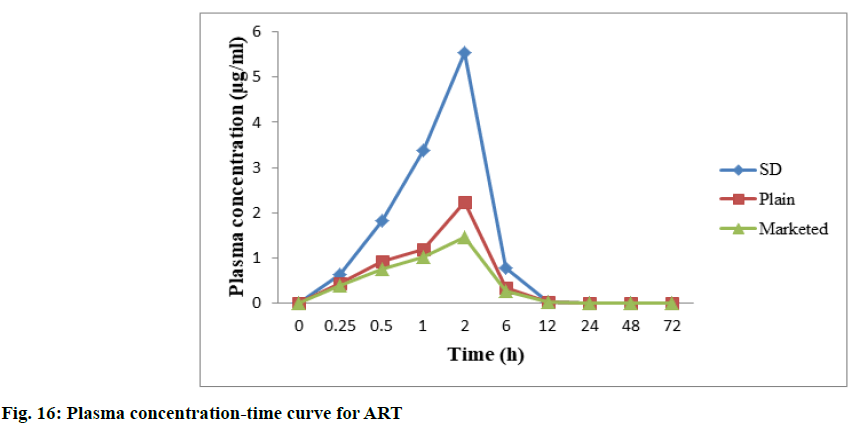
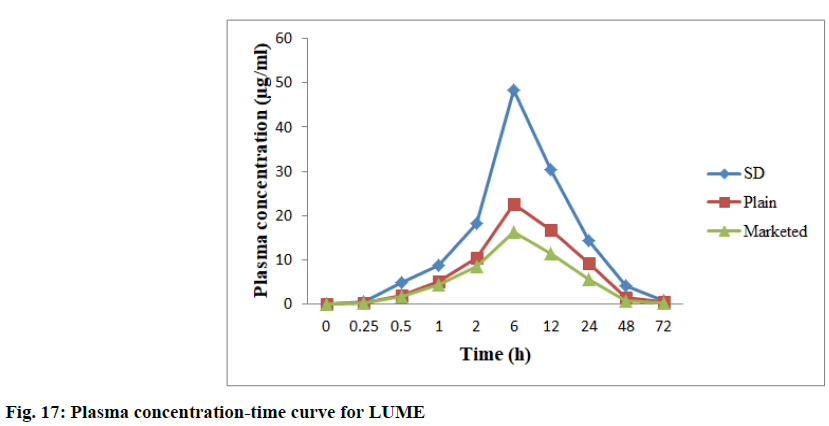
In vivo studies were performed to demonstrate bioavailability for exposure of ART and LUME with respect to AUC0-72 and Cmax (observed maximum plasma concentration following drug administration) between the marketed 20/120 mg tablet and between the prepared 20/120 mg ART-LUME plain and ART-LUME SD IR tablet when administered orally by oral gavage to healthy mice under fasting conditions. HPLC chromatogram of ARS is an IS, ART and LUME in plasma sample was observed as shown in fig. 15. The mean plasma concentration–time curves of ART and LUME are shown in fig. 16 and fig. 17. The pharmacokinetic parameters are listed in Table 7. The formulation ART-LUME SD IR was selected as it was found to be better than ART-LUME plain formulations for in vivo evaluation. The Tmax of ART-LUME SD IR tablet was reached at 2 h and 6 h with plasma drug concentration of 5.54±0.87 μg/ml and 48.41±1.28 μg/ml while for ART-LUME plain IR tablet Cmax was 2.23±0.79 and 35.72±1.42 for ART and LUME respectively, which indicates bioavailability enhancement. Regarding ART it showed that ARTLUME SD IR tablet have 2.41 and 3.89 times higher AUC(0–72) and 2.48 and 4.94 times higher Cmax than plain and marketed ART tablet respectively. With respect to LUME it showed that ART-LUME SD IR has 1.85 and 2.82 times higher AUC(0–72) and 2.13 and 2.98 times higher Cmax than plain and marketed LUME tablet respectively. All these factors increase oral absorption and consequently the bioavailability of ART-LUME SD IR tablet as compared to marketed and plain drug formulation.
| Parameters | Cmax (µg/ml) | Tmax (h) | AUC0-72 | t1/2 |
|---|---|---|---|---|
| ART SD | 5.54±0.87 | 2 | 21.52±0.84 | 6.12±1.45 |
| ART | 2.23±0.79 | 2 | 8.92±1.16 | 4.82±1.37 |
| Marketed ART | 1.12±1.14 | 2 | 5.52±1.52 | 2.69±1.08 |
| LUME SD | 48.41±1.28 | 6 | 942.25±1.61 | 11.59±1.19 |
| LUME | 22.72±1.42 | 6 | 508.13±1.48 | 12.26±1.08 |
| Marketed LUME | 16.23±1.17 | 6 | 333.28±1.59 | 12.00±1.12 |
All values are expressed as average±SD, n=4
Table 7: In vivo Pharmacokinetic Parameters of the ART and LUME
The present research study is very beneficial as it showed that the solvent evaporation method developed stable amorphous SD and provided great potential for improving the solubility, dissolution rate and hence the bioavailability of the poorly water soluble drugs likes ART and LUME using PVP K-30 as a carrier (1:0.2). Furthermore, the IR tablet of the optimized SDs gave faster disintegration as the wettability of the drug was increased due to increased surface area of the drug particles and hence the solubility and dissolution rate was increased as compared to the marketed product and pure drug. Based on the solubility studies the dissolution study was performed using the single dissolution test method in which the simultaneous estimation of ART and LUME was done using the same dissolution media.
Acknowledgements:
The authors are grateful to Mylan Lab, Bollaram, Hyderabad, India for drug sample and BASF India for the excipients. This research did not receive any specific grant from funding agencies in the public, commercial or not for profit sectors.
References
- WHO. Management of Severe Malaria. In a Practical Handbook. 3rd edition. Geneva: WHO Press; 2012.
- Siciliano G, Alano P. Enlightening the malaria parasite life cycle: bioluminescent Plasmodium in fundamental and applied research. Front Microbiol 2015;6:391.
- Lindenberg M, Kopp S, Dressman JB. Classification of orally administered drugs on the World Health Organization model list of essential medicines according to the biopharmaceutics classification system. Eur J Pharm Biopharm 2004;58(2):265-78.
- Premji ZG. Coartem®: The journey to the clinic. Malar J 2009;8(1):1-6.
- Sharma B, Saini V, Sharma A. Preparation, characterization and in vitro evaluation of atorvastatin calcium solid dispersions with various hydrophilic polymers and its FDT formulation. Int J Curr Pharm Res 2012;2(4):620-30.
- Sethia S, Squillante E. Solid dispersion of carbamazepine in PVP K30 by conventional solvent evaporation and supercritical methods. Int J Pharm 2004;272(1-2):1-10.
- Sharma A, Jain CP. Preparation and characterization of solid dispersions of carvedilol with PVP K30. Res Pharm Sci 2010;5(1):49-56.
- Fule RA, Meer TS, Sav AR, Amin PD. Artemether-soluplus hot-melt extrudate solid dispersion systems for solubility and dissolution rate enhancement with amorphous state characteristics. J Pharm 2013;1-15.
- Ansari MT, Karim S, Ranjha NM, Shah NH, Muhammad S. Physicochemical characterization of artemether solid dispersions with hydrophilic carriers by freeze dried and melt methods. Arch Pharm Res 2010;33(6):901-10.
- Umapathi P, Ayyappan J, Quine SD. Development and validation of a dissolution test method for artemether and lumefantrine in tablets. Trop J Pharm Res 2011;10(5):643-53.
- Pani NR, Nath LK, Bhunia B. Formulation, development, and optimization of immediate release nateglinide tablets by factorial design. Drug Discov Ther 2010;4(6):453-58.
- Balaji A, Kumari H, Kumar U. Development, characterization and evaluation of solid dispersions of artemether and lumefantrine by solvent evaporation method using hydrophilic polymers. Int J Pharm Pharm Sci 2014;6:180-5.
- Shah SM, Ullah F, Khan S, Shah SM, de Matas M, Hussain Z, et al. Smart nanocrystals of artemether: fabrication, characterization, and comparative in vitro and in vivo antimalarial evaluation. Drug Des Devel Ther 2016;10:3837-50.
- Mandawgade SD, Sharma S, Pathak S, Patravale VB. Development of SMEDDS using natural lipophile: application to β-artemether delivery. Int J Pharm 2008;362(2):179-83.
- Prabhu P, Suryavanshi S, Pathak S, Sharma S, Patravale V. Artemether-lumefantrine nanostructured lipid carriers for oral malaria therapy: Enhanced efficacy at reduced dose and dosing frequency. Int J Pharm 2016;511(1):473-87.
- Fule R, Dhamecha D, Maniruzzaman M, Khale A, Amin P. Development of hot melt co-formulated antimalarial solid dispersion system in fixed dose form (ARLUMELT): evaluating amorphous state and in vivo performance. Int J Pharm 2015;496(1):137-56.
- Pawar JN, Shete RT, Gangurde AB, Moravkar KK, Javeer SD, Jaiswar DR, et al. Development of amorphous dispersions of artemether with hydrophilic polymers via spray drying: Physicochemical and in silico studies. Asian J Pharm Sci 2016;11(3):385-95.
- Shakeel K, Raisuddin S, Ali S, Imam SS, Rahman MA, Jain GK, Ahmad FJ. Development and in vitro/in vivo evaluation of artemether and lumefantrine co-loaded nanoliposomes for parenteral delivery. J Liposome Res 2019;29(1):35-43.
