- *Corresponding Author:
- H. Q. Qiao
Department of General Surgery
The First Affiliated Hospital of Harbin Medical University
No. 25 Youzheng Street, Harbin
Heilongjiang 150008, China
E-mail: qiaohaiquan@hotmail.com
| This article was originally published in a special issue, “Evolutionary Strategies in Biomedical Research and Pharmaceutical Sciences” |
| Indian J Pharm Sci 2021:83(3) Spl issue;145-152 |
This is an open access article distributed under the terms of the Creative Commons Attribution-NonCommercial-ShareAlike 3.0 License, which allows others to remix, tweak, and build upon the work non-commercially, as long as the author is credited and the new creations are licensed under the identical terms
Abstract
Bardet-Biedl syndrome 4 is the key protein to control cilia formation. In this study, bioinformatics method was used to screen the core genes related to the prognosis of breast cancer by analyzing the gene chip data of gene expression omnibus and the cancer genome atlas database, so as to provide a new candidate target for the treatment of breast cancer. Data were downloaded from the cancer genome atlas, gene expression omnibus to evaluate Bardet-Biedl syndrome 4 expression levels in breast cancer. Differentially expressed genes were screened by R package. Gene ontology and Kyoto encyclopedia of Genes and Genomes pathway enrichment analysis was used to explore the biological functions of differentially expressed genes. The correlation of differentially expressed genes used was, “corrplot” for visual analysis. The proteinprotein interaction relationship was constructed based on search tool for the retrieval of interacting genes/ proteins database and Cytoscape software and the key genes were obtained by module analysis with Cytoscape software molecular complex detection plugin and the prognostic value and survival of Bardet- Biedl syndrome 4 were evaluated by R package. Finally, the correlation between Bardet-Biedl syndrome 4 and clinicopathological parameters was also visualized by R package. These differentially expressed genes were mainly involved in response to peptide hormone, nuclear division, hormone secretion and transport and extracellular matrix. Genes were mainly involved in the Kyoto encyclopedia of genes and genomes pathway called Interleukin-17 signaling pathway. Bardet-Biedl syndrome 4 levels were found to be down regulated in breast cancer tissues compared with normal tissues. Survival analysis showed that low Bardet-Biedl syndrome 4 expression was associated with poor prognosis. These results were verified in clinical specimens, where in the Bardet-Biedl syndrome 4 protein levels were significantly down regulated in breast cancer tissues compared with non-breast cancer tissues. This study confirmed that Bardet-Biedl syndrome 4 can be used as an independent prognostic factor for the prognosis of breast cancer, which provides a basis for exploring a new target for the treatment of breast cancer.
Keywords
Bardet-Biedl syndrome 4, breast cancer, bioinformatics, differentially expressed genes, prognosis
Breast cancer (BC) is one of the malignant tumors with the highest incidence in women and it is also the main cause of cancer death among women in the world[1]. Globally, with the development of screening and treatment, the survival rate of patients with BC has been improved. However, due to the high genetic heterogeneity of BC, some types of BC cells also have a high degree of invasion and metastasis and are easy to relapse[2]. Therefore, traditional treatments such as radiotherapy and surgery can improve patients but cannot completely prevent patients from dying of cancer metastasis. In order to develop better treatment strategies and better understand the targets of its potential mechanism, we urgently need to explore more specific and economical biomarkers to predict the prognosis of BC.
Bardet-Biedl syndrome (BBS) is a rare multisystem disease characterized by retinal dystrophy, renal insufficiency, obesity, polydactyly and many developmental and behavioral defects. It is usually inherited by autosomal recessive inheritance, which is caused by homozygous or compound heterozygous mutations[3]. So far, 24 genes associated with BBS have been identified (BBS1-BBS24). Eight of them formed a stable protein complex, called BBSome, which is a binding protein complex composed of BBS1, 2, 4, 5, 7, 8, 9 and 18, which is structurally similar to the coat protein or adapter protein involved in vesicle transport[4-6]. Bardet-Biedl syndrome 4 (BBS4) is one of several proteins that cause BBSome. BBS4 is involved in the regulation of transmembrane proteins, including the transport of G protein-coupled receptor (GPCR) into the cilia and the output of extra ciliated receptors, regulation of cell cycle progression and microtubule tissue during cell division[7]. Recent studies have shown that silent BBS4 induces accelerated cell division and abnormal differentiation. Therefore, in this study, BBS4 was selected as the research object to determine its exact role and mechanism in tumor cell migration and invasion.
The purpose of this study was to evaluate the prognostic and therapeutic value of BBS4 as a potential biomarker of BC. We compare its performance with other biomarkers and gene signatures currently available. Based on the analysis of the downloaded Gene Expression Omnibus (GEO) and The Cancer Genome Atlas (TCGA) data sets, we found that BBS4 has prognostic value in patients with BC.
Materials and Methods
Data sources
The microarray dataset GSE42568 was downloaded from the GEO database (https://www.ncbi.nlm.nih.gov/geo/). GSE42568 contained gene expression profile data of 104 cases of BC and 17 cases of normal breast biopsies and was performed on GPL570 [HGU133_ Plus_2] Affymetrix Human Genome U133 Plus 2.0 Array by Clarke C et al. The analysis data of BBS4 in BC progression and prognosis was downloaded from TCGA (https://portal.gdc.cancer.gov/). All data sets needed to be normalized using the R package before analysis.
Fundamental analysis
Firstly, the annotation file of the corresponding platform was used to annotate the gene expression profile and then use the “limma” package of Bioconductor (http://www. bioconductor.org/packages/release/bioc/html/limma.html) to normalize the expression data[8]. Secondly, a ranked list was generated according to the fold changes of the up-regulated and down-regulated genes in each data set. Finally, use the “robust rank aggregation” R package to perform integrated analysis on these sorted gene lists[9], p values of each gene were calculated and the final gene list was sorted in descending order of p value. In addition, Bonferroni correction was used to reduce false positive results.
Function and pathway enrichment analysis
Using the R software to estimate differentially expressed genes (DEGs) between BC and non-BC samples, we performed Gene ontology (GO) term enrichment analysis, including molecular function (MF), cellular component (CC) and biological process (BP), as well as the Kyoto Encyclopedia of Genes and Genomes (KEGG). DEGs were identified using “clusterProfiler” (http://www.bioconductor.org/packages/release/bioc/html/clusterProfiler.html), “org.Hs.eg.db” (http://www.bioconductor.org/packages/release/data/annotation/html/org.Hs.eg.db.html), “enrichplot” (http://www.bioconductor.org/packages/release/bioc/html/enrichplot.html) and “ggplot2” packages in Bioconductor, which is an R package that researchers can use to perform GO functional enrichment analysis and KEGG pathway enrichment analysis. Probe sets with multiple gene symbols or without corresponding gene symbols were deleted. Genes with two or more probe sets were absolute maximized. The cut-off criteria were set as follows: p<0.05 and logFC (fold change)>1.
Protein-protein interaction (PPI) network and module analysis
Protein-protein interaction (PPI) network of DEGs in BC can be constructed from the Search Tool for the Retrieval of Interacting Genes/Proteins (STRING) 11.0 database (http://string-db.org/cgi/input.pl) with a confidence level of 0.04. Then, Cytoscape 3.7.2 software was used to visualize the PPI network and the Molecular Complex Detection (MCODE) plugin of Cytoscape software was used to check module analysis to screen key genes[10].
Statistical analysis
All statistical analysis data were processed using R software (R version 4.0.2) unless otherwise specified. Student t-test and one-way analysis of variance were applied to analysis of continuous data and Pearson’s Chi-square test was used in the processing of categorical data. Kaplan-Meier survival analysis was used to plot overall survival (OS). The hazard ratio (HR) of the 95 % confidence intervals (CI) will be computed using Cox proportional hazard regression analysis to test the relationship between BBS4 expression level and patient survival, p<0.05 and p<0.01 were considered statistically significant.
Results and Discussion
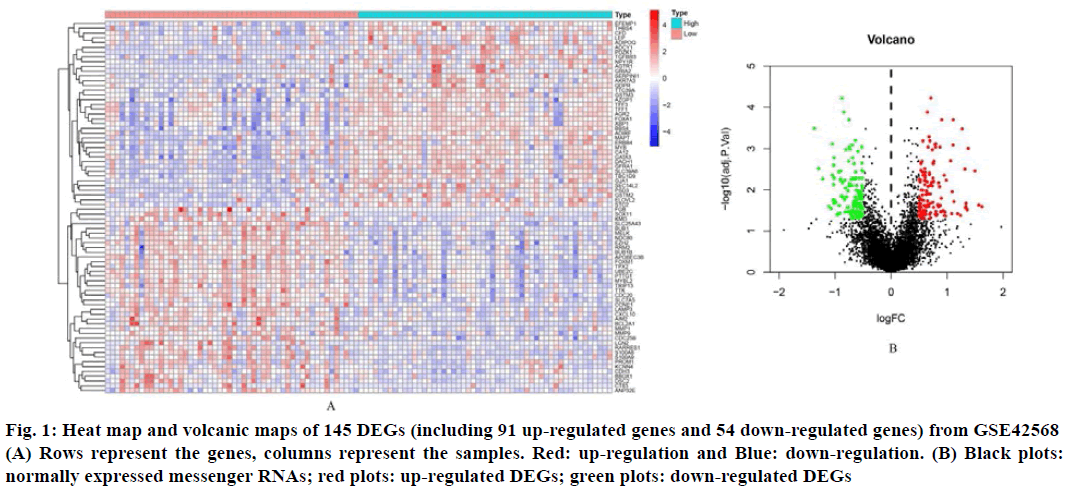
In order to identify the DEGs related to BC and non-BC, differential expression analysis was effectuated using the R software package and a list of up-regulated and down-regulated DEGs was obtained. Using logFC (fold change)>1 and p value<0.05 as the standard, 145 DEGs were screened out, of which 91 were up regulated genes and 54 were down regulated genes (Table 1). These DEGs hierarchical clustering graph and volcano map are shown in fig. 1.
| DEGs | Genes name |
|---|---|
| Up-regulated | BBS4, GFRA1, CTSF, NME5, TBC1D9, GSTM2, SEC14L2, MAPT, ADIRF, GSTM3, GJA1, AKR7A3, ARSG, STC2, IGF1R, DNALI1, XBP1, NPY1R, RNASE4, CA12, IGFBP4, TTC39A, QDPR, TGFBR3, ELOVL2, CPE, ACADSB, ABAT, AGR2, ZBTB20, CFD, PDZK1, SLC39A6, GATA3, FOXA1, ERBB4, MYB, SHC2, KAL1, THBS4, DACH1, PLA2G16, LRRC17, COX7A1, GHR, ADCY1, IRS1, SEPP1, DCN, AGTR1, SERPINI1, EFEMP1, FMOD, SPARCL1, GRIA2, PSD3, ARNT2, HSPA2, RTN1, PPP1R3C, TFF1, TFF3, ADIPOQ, PCAT18, FBP1, GRP, LEP, AZGP1, CLGN, CRIP1, AREG, DUSP4, SCGB2A2, ADH1B, SERPINA5, PLIN1, SCNN1A, FABP4, SERPINA3, KRT19, PLAT, KCNE4, TNNT1, CYP2B7P, MYBPC1, UGT2B28, DHRS2, SCGB1D2, CPB1, HMGCS2, PIP |
| Down-regulated | TTK, FOXM1, MELK, SLC7A5, MYBL2, BUB1, UBE2C, NDC80, EZH2, SLC25A43, CCNE1, CDC25B, PTTG1, S100A8, KMO, BUB1B, RARRES1, TPX2, CDC20, PRKX, DLGAP5, RRM2, APOBEC3B, S100A9, DSC2, SOX11, AIM2, LAMP3, BCL2A1, TRIP13, ANP32E, KCNN4, LCN2, PLA2G7, MMP1, MMP9, MARCO, FGB, BBOX1, CDH3, CXCL10, CT83, ASS1, PROM1, ZIC1, MX1, MMP12, SLPI, S100A7, IFI44L, CXCL9, CHI3L1, CRISP3, GABRP |
Table 1: DEGs (91 Up-Regulated Genes and 54 Down-Regulated Genes)
Fig. 1: Heat map and volcanic maps of 145 DEGs (including 91 up-regulated genes and 54 down-regulated genes) from GSE42568 (A) Rows represent the genes, columns represent the samples. Red: up-regulation and Blue: down-regulation. (B) Black plots: normally expressed messenger RNAs; red plots: up-regulated DEGs; green plots: down-regulated DEGs
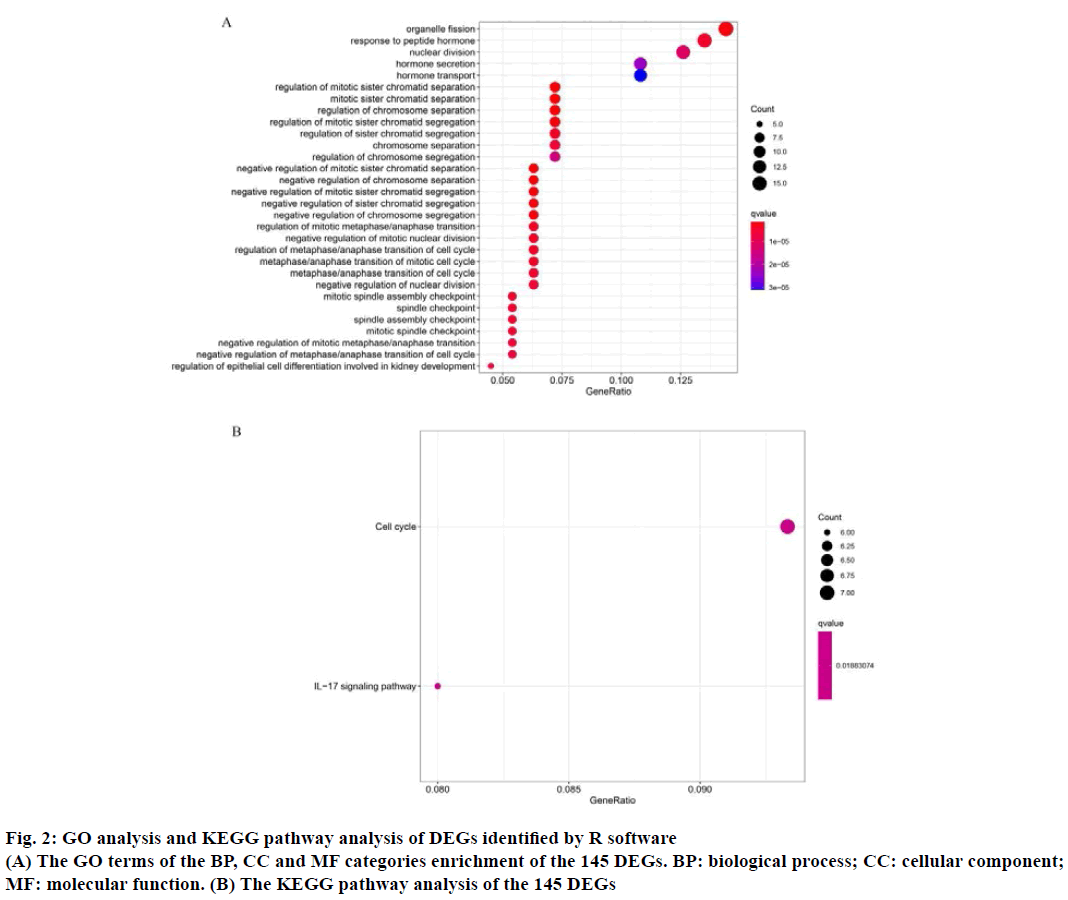
The GO function enrichment analysis and KEGG pathway enrichment analysis were performed on 145 DEGs through R software. GO analysis includes BP, CC and MF. The results of GO analysis showed that the main BP of the selected DEGs involved in organelle fission, regulation of chromosome separation, response to peptide hormone, nuclear division, hormone secretion and transport, positive regulation of secretion. The primary CC terms consisted of extracellular matrix, condensed chromosome outer kinetochore, anaphase promoting complex, nuclear chromosome, centromeric region. Finally, the primary MF terms included epidermal growth factor receptor binding (Table 2 and fig. 2A). The KEGG analysis consisted of the DEGs were mainly concentrated in cell cycle and Interleukin-17 (IL-17) signaling pathway (Table 2 and fig. 2B). For instance, BBS4 may participate in multicellular organismal homeostasis (GO:0048871), regulation of blood pressure (GO:0008217), positive regulation of developmental growth (GO:0048639), cellular response to leptin stimulus (GO:0044320), response to leptin (GO:0044321), regulation of multicellular organism growth (GO:0040014), epithelial tube morphogenesis (GO:0060562), heart morphogenesis (GO:0003007), retina homeostasis (GO:0001895), leptin-mediated signaling pathway (GO:0033210), maintenance of location in cell (GO:0051651), adipose tissue development (GO:0060612), fat cell differentiation (GO:0045444), tissue homeostasis (GO:0001894), negative regulation of blood pressure (GO:0045776), negative regulation of response to food (GO:0032096), negative regulation of appetite (GO:0032099), maintenance of location (GO:0051235), negative regulation of response to extracellular stimulus (GO:0032105), negative regulation of response to nutrient levels (GO:0032108) and connective tissue development (GO:0061448).
| Category | Term | Count | p value |
|---|---|---|---|
| GOTERM_BP | GO:0048285~organelle fission | 16 | 9.65E-09 |
| GOTERM_BP | GO:0043434~response to peptide hormone | 15 | 4.63E-08 |
| GOTERM_BP | GO:0000280~nuclear division | 14 | 1.35E-07 |
| GOTERM_BP | GO:0051047~positive regulation of secretion | 13 | 1.58E-06 |
| GOTERM_BP | GO:1901987~regulation of cell cycle phase transition | 13 | 5.53E-06 |
| GOTERM_BP | GO:0046879~hormone secretion | 12 | 3.01E-07 |
| GOTERM_BP | GO:0009914~hormone transport | 12 | 4.10E-07 |
| GOTERM_BP | GO:0051306~mitotic sister chromatid separation | 8 | 2.39E-09 |
| GOTERM_CC | GO:0062023~extracellular matrix | 12 | 3.75E-06 |
| GOTERM_CC | GO:0000940~condensed chromosome outer kinetochore | 12 | 6.37E-05 |
| GOTERM_CC | GO:0005680~anaphase-promoting complex | 3 | 2.26E-04 |
| GOTERM_CC | GO:0000780~condensed nuclear chromosome, centromeric regional activity | 3 | 4.33E-04 |
| GOTERM_MF | GO:0005154~epidermal growth factor receptor binding | 4 | 4.86E-05 |
| KEGG_PATHWAY | hsa04110:Cell cycle | 7 | 1.42E-04 |
| KEGG_PATHWAY | hsa04657:IL-17 signaling pathway | 6 | 2.24E-04 |
GO: Gene Ontology; BP: biological process; CC: cellular component; MF: molecular function; KEGG: Kyoto Encyclopedia of Genes and Genomes. The count was the number of enriched genes in each term. If there were >5 terms enriched in this category, the top five terms were selected according to their p value
Table 2: Go and KEGG Pathway Enrichment Analysis of Genes in Three Significant Modules
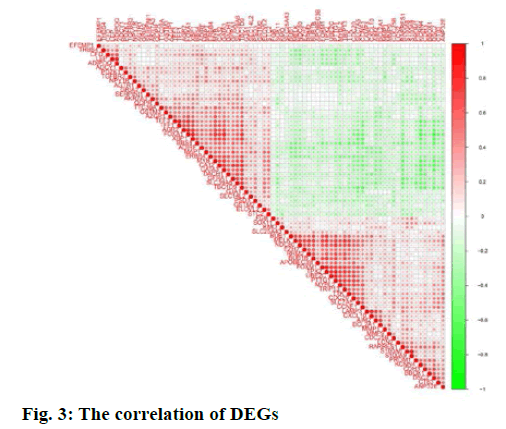
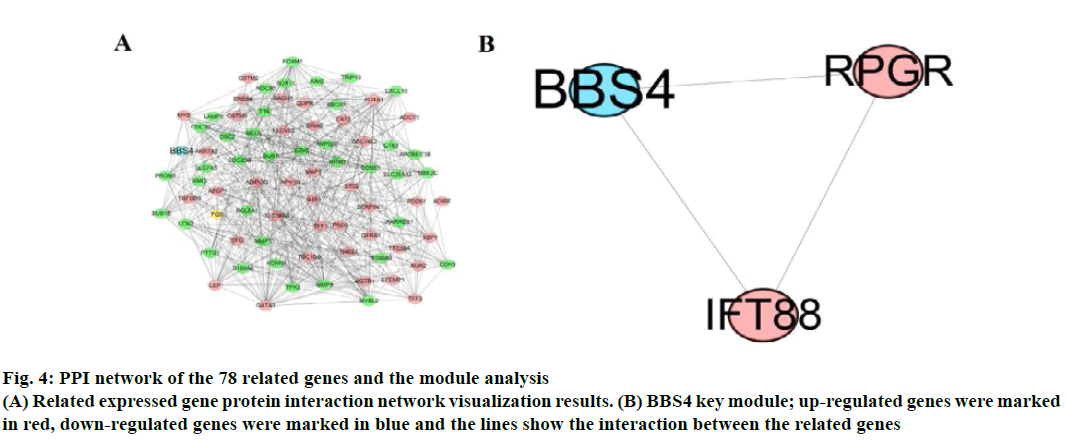
The correlation of DEGs was used, “corrplot” for visual analysis (fig. 3). STRING 11.0 online database constructed PPI network. A total of 78 related genes were imported into the PPI network complex which included 78 nodes and 558 edges, including 39 upregulated and 39 down-regulated genes (fig. 4A). Then, the key modules were identified through the Cytotype MCODE plugin (Node Score Cutoff=0.2, K-Core=2, Maximum Depth=100). A total of 6 central nodes were identified out of 78 nodes, then the central node of BBS4 was shown in fig. 4B and they were all upregulated genes.
Fig. 4: PPI network of the 78 related genes and the module analysis
(A) Related expressed gene protein interaction network visualization results. (B) BBS4 key module; up-regulated genes were marked
in red, down-regulated genes were marked in blue and the lines show the interaction between the related genes
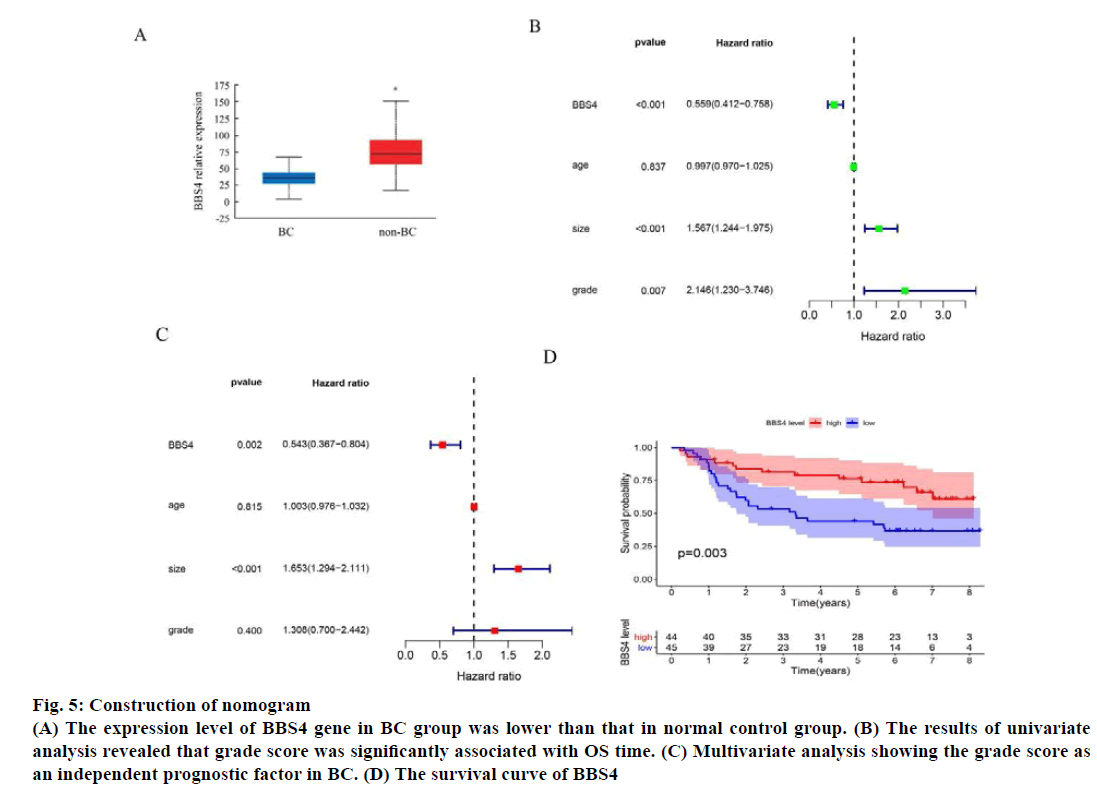
The expression level of BBS4 gene in the 1085 BC group and 291 normal control group in the TCGA database was analyzed online through the web page Gene Expression Profiling Interactive Analysis (GEPIA) and the results showed that the expression level of BBS4 in the BC group was lower than the normal control group (p<0.01) (fig. 5A). Then we evaluated the grade score for each patient according to the grade assessment model. In order to determine whether the grade score as an independent prognostic indicator, we performed univariate and multivariate analyses and evaluated the prognostic value of grade scores. The results of univariate analysis revealed that grade score was significantly associated with OS time (fig. 5B). Multivariate analysis showing the grade score as an independent prognostic factor in BC (fig. 5C). We evaluated the survival of the high grade group and grade risk group by the Kaplan-Meier survival curve, results showed that patients in the high-risk group has significantly longer survival time than those in the lowrisk group (fig. 5D).
Fig. 5: Construction of nomogram
(A) The expression level of BBS4 gene in BC group was lower than that in normal control group. (B) The results of univariate
analysis revealed that grade score was significantly associated with OS time. (C) Multivariate analysis showing the grade score as
an independent prognostic factor in BC. (D) The survival curve of BBS4
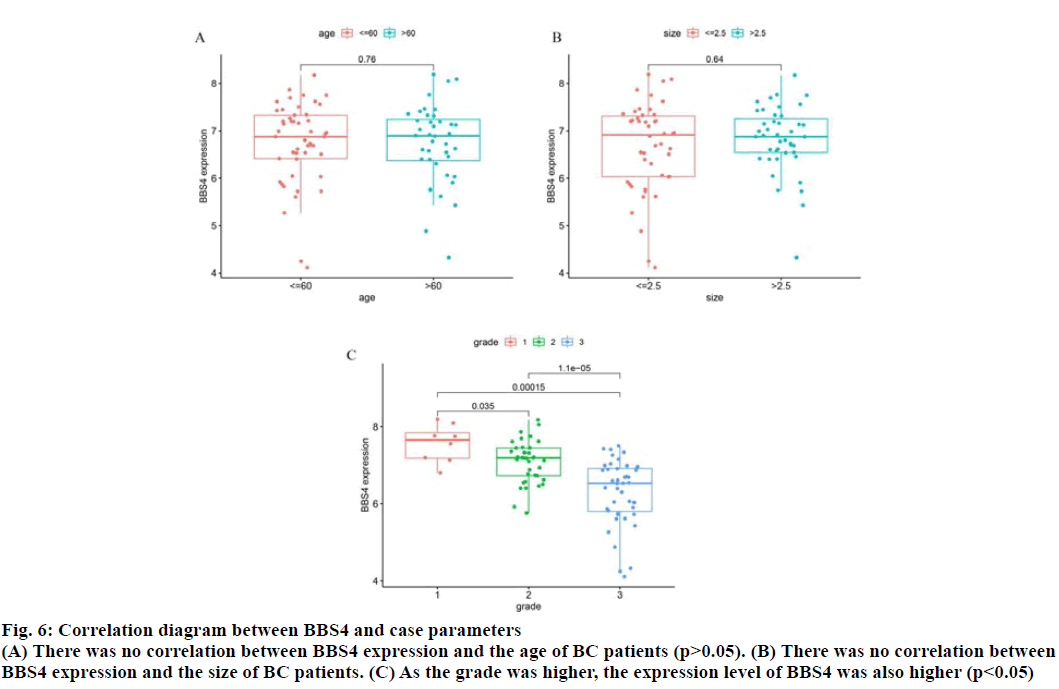
The correlation between BBS4 expression and the age, tumor size and tumor grade of BC patients was analyzed by R software (fig. 6). As the tumor grade was higher, the expression level of BBS4 was also higher (p<0.05), but there was no correlation with age and tumor size (p>0.05).
Fig. 6: Correlation diagram between BBS4 and case parameters
(A) There was no correlation between BBS4 expression and the age of BC patients (p>0.05). (B) There was no correlation between
BBS4 expression and the size of BC patients. (C) As the grade was higher, the expression level of BBS4 was also higher (p<0.05)s
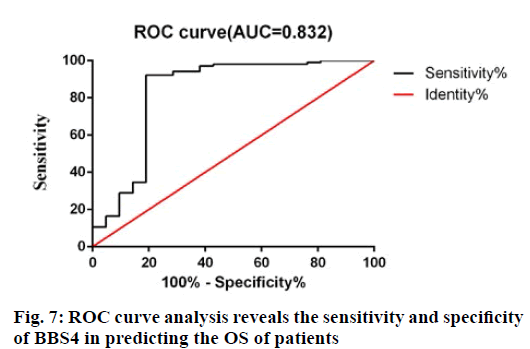
In order to further evaluate the predictive accuracy of BBS4, receiver operating characteristic (ROC) analysis was used to evaluate the sensitivity and specificity of BBS4 markers in predicting prognosis. As shown in fig. 7, the area under the curve is 0.832, indicating that BBS4 has relatively high sensitivity and specificity. Therefore, along with the above results, BBS4 can be used as a potential marker to predict the prognosis and survival of patients with BC and has important clinical value.
BC is a heterogeneous disease, which can be divided into four molecular subtypes according to the expression of estrogen receptor (ER), progesterone receptor (PR), human epidermal growth factor receptor 2 (HEGFR 2) and proliferation marker Ki67 (MKI67)[11-13]. In recent years, the incidence of BC has been increased year by year and the age of onset was getting younger. Early diagnosis and treatment can improve the prognosis of patients. Therefore, the search for sensitive biomarkers is of great significance for the treatment and prognosis of patients with BC. This study combines the sequencing data of microarray chips for the first time to evaluate the potential value of BBS4 in BC. Single chip analysis showed that the low expression of BBS4 in BC was related to poor prognosis (p<0.05). Signal pathway analysis of co-expressed genes found that BBS4 may affect some cancer signal pathways, especially IL- 17 signal pathway, leading to the occurrence and development of BC.
There are few studies on the expression of BBS4 in various tumor tissues. According to previous studies, it has been confirmed that the increased expression of p62/ sequestosome 1 (SQSTM1) promotes the aggregation and dislocation of BBS4, which is a key protein that controls cilia formation. P62/SQSTM1 has been identified as a nuclear factor erythroid 2-related factor 2 (Nrf2) target gene, which is a key autophagy binding protein[14]. Tetsuya et al. suggested that phosphorylated p62-dependent Nrf2 activation inhibitors can suppress the proliferation of hepatocellular carcinoma (HCC) and the resistance to anticancer agents. This Nrf2 inhibitor can be used to reduce the resistance of cancer cells to anticancer drugs[15,16]; Ichimura et al. founded that p62- Kelch-like ECH-associated protein 1 (Keap1)-Nrf2 pathway can induce tumorigenesis of precancerous cells and promote tumor cell growth and drug resistance through metabolic reprogramming mediated by Nrf2 activation[17]. In addition, many reports have shown that p62-Keap1-Nrf2 pathway plays a protective role under oxidation and stress conditions. For example, apoptosis induced by endoplasmic reticulum stress can be prevented by activating p62-Keap1-Nrf2 pathway[18]; Quercetin attenuates hepatotoxicity induced by various hepatotoxic agents by activating p62-Keap1-Nrf2 pathway[19]; Licochalcone A activates p62-Keap1-Nrf2 pathway and inhibits arthritis in collagen-induced arthritis in mice[20]. During oxidative stress, trehalose induced p62 expression and activated p62-Keap1-Nrf2- mediated antioxidant response[21]; At the same time, the continuous activation of p62-Keap1-Nrf2 pathway has been proved to be related to the occurrence of liver tumors in mice[22].
In view of the fact that the expression and biological function of BBS4 in BC are not clear, this study first analyzed the differential genes between BC and normal breast tissues by bioinformatics using gene chip GSE42568 of GEO database. 145 DEGs were identified, including 91 up-regulated genes and 54 down-regulated genes. Subsequently, GO annotation and KEGG pathway analysis were performed to elucidate the significance of these identified aberrantly expressed genes. This enrichment analysis showed that the DEGs were mainly enriched in the pathways of cell movement and IL-17 signaling pathway. It is reported in the literature that the effect of IL-17 on cancer has been widely studied and it has different effects on different cancers. IL-17, was an important proinflammatory cytokine[23]. Chen et al. confirmed that neutrophils, Gamma delta (γδ) T cells) and IL173 have metastasis promoting effects in BC patients in BC patients[24]. Seth demonstrated that IL-17 signaling pathway also perpetuates BC metastasis[25]. IL-17 was thought to be a key event in tumor progression and was associated with tumor metastasis[26]. Subsequently, the data of TCGA were used to analyze the expression of BBS4 in patients with BC and its value in diagnosis and prognosis. The results confirmed that the expression of BBS4 was significantly decreased in BC. ROC curve showed that the expression level of BBS4 was of moderate diagnostic value in BC and Kaplan-Meier analysis showed that the expression level of BBS4 was correlated with grade. In addition, multivariate analysis confirmed that the expression of BBS4 can be used as an independent risk factor for the prognosis of BC.
Taken together, this study showed that BBS4 gene was down-regulated in BC tissues compared with normal tissues and its expression level was related to the prognosis of BC patients. Therefore, as a human tumor suppressor gene, the expression level of BBS4 may be a reliable auxiliary parameter for diagnosing BC and predicting tumor metastasis and prognosis.
Conflicts of interest
The authors report no conflicts of interest.
References
- Eric I, Petek Eric A, Kristek J, Koprivcic I, Babic M. Breast cancer in young women: pathologic and immunohistochemical features. Acta Clin Croat 2018;57(3.):497-501.
- Mwafy SE, El-Guindy DM. Pathologic assessment of tumor-associated macrophages and their histologic localization in invasive breast carcinoma. J Egypt Natl Canc Inst 2020;32(1):6.
- Uytingco CR, Williams CL, Xie C, Shively DT, Green WW, Ukhanov K, et al. BBS4 is required for intraflagellar transports coordination and basal body number in mammalian olfactory cilia. J Cell Sci 2019;132(5).
- Xu Q, Zhang Y, Wei Q, Huang Y, Li Y, Ling K, et al. BBS4 and BBS5 show functional redundancy in the BBSome to regulate the degradative sorting of ciliary sensory receptors. Sci Rep 2015;5(1):1-6.
- Nozaki S, Araya RF, Katoh Y, Nakayama K. Requirement of IFT-B–BBSome complex interaction in export of GPR161 from cilia. Biol open 2019;8(9).
- Prasai A, Cernohorska MS, Ruppova K, Niederlova V, Andelova M, Draber P, et al. The BBSome assembly is spatially controlled by BBS1 and BBS4 in human cells. J Biol Chem 2020;295(42):14279-90.
- Zhang Y, Seo S, Bhattarai S, Bugge K, Searby CC, Zhang Q, et al. BBS mutations modify phenotypic expression of CEP290-related ciliopathies. Hum Mol Genet 2014;23(1):40-51.
- Li L, Cai S, Liu S, Feng H, Zhang J. Bioinformatics analysis to screen the key prognostic genes in ovarian cancer. J Ovarian Res 2017;10(1):1-8.
- Kolde R, Laur S, Adler P, Vilo J. Robust rank aggregation for gene list integration and meta-analysis. Bioinformatics 2012;28(4):573-80.
- Liu H, Duan JQ, Ren XM, Li XL, Chen J, Li P, et al. Changes of gene expression profile in cardiac mesenchymal cells in patients with Type 2 diabetes mellitus and screening of their related environmental chemicals. Acta Academiae Medicinae Sinicae 2020;42(1):37-46.
- Sorlie T, Tibshirani R, Parker J, Hastie T, Marron JS, Nobel A, et al. Repeated observation of breast tumor subtypes in independent gene expression data sets. Proc Natl Acad Sci India 2003;100(14):8418-23.
- Sorlie T, Wang Y, Xiao C, Johnsen H, Naume B, Samaha RR, et al. Distinct molecular mechanisms underlying clinically relevant subtypes of breast cancer: gene expression analyses across three different platforms. BMC genomics 2006;7(1):1-5.
- Goldhirsch A, Wood WC, Coates AS, Gelber RD, Thurlimann B, Senn HJ. Strategies for subtypes-dealing with the diversity of breast cancer: highlights of the St Gallen International expert consensus on the primary therapy of early breast cancer 2011. Ann Oncol 2011;22(8):1736-47.
- Liu P, Dodson M, Fang D, Chapman E, Zhang DD. NRF2 negatively regulates primary ciliogenesis and hedgehog signaling. PLoS biol 2020;18(2):e3000620.
- Saito T, Ichimura Y, Taguchi K, Suzuki T, Mizushima T, Takagi K, et al. p62/Sqstm1 promotes malignancy of HCV-positive hepatocellular carcinoma through Nrf2-dependent metabolic reprogramming. Nat Commun 2016;7(1):1-6.
- Xing M, Li P, Wang X, Li J, Shi J, Qin J, et al. Overexpression of p62/IMP2 can promote cell migration in hepatocellular carcinoma via activation of the Wnt/β-catenin pathway. Cancers 2020;12(1):7.
- Ichimura Y, Komatsu M. Activation of p62/SQSTM1–Keap1–nuclear factor erythroid 2-related factor 2 pathway in cancer. Front Oncol 2018;8:210.
- Park JS, Oh SY, Lee YS, Sung SH, Ji HW, Lee MJ, et al. p62/SQSTM1 is required for the protection against endoplasmic reticulum stress-induced apoptotic cell death. Free Radic Res 2016;50(12):1408-21
- Ji LL, Sheng YC, Zheng ZY, Shi L, Wang ZT. The involvement of p62–Keap1–Nrf2 antioxidative signaling pathway and JNK in the protection of natural flavonoid quercetin against hepatotoxicity. Free Radic Biol Med 2015;85:12-23.
- Su X, Li T, Liu Z, Huang Q, Liao K, Ren R, et al. Licochalcone A activates Keap1-Nrf2 signaling to suppress arthritis via phosphorylation of p62 at serine 349. Free Radic Biol Med 2018;115:471-83.
- Mizunoe Y, Kobayashi M, Sudo Y, Watanabe S, Yasukawa H, Natori D, et al. Trehalose protects against oxidative stress by regulating the Keap1–Nrf2 and autophagy pathways. Redox Biol 2018;15:115-24.
- Ichimura Y, Waguri S, Sou YS, Kageyama S, Hasegawa J, Ishimura R, et al. Phosphorylation of p62 activates the Keap1-Nrf2 pathway during selective autophagy. Mol Cell 2013;51(5):618-31.
- Amatya N, Garg AV, Gaffen SL. IL-17 signaling: the yin and the yang. Trends Immunol 2017;38(5):310-22.
- Chen WC, Lai YH, Chen HY, Guo HR, Su IJ, Chen HH. Interleukin‐17‐producing cell infiltration in the breast cancer tumour microenvironment is a poor prognostic factor. Histopathology 2013;63(2):225-33.
- Coffelt SB, Kersten K, Doornebal CW, Weiden J, Vrijland K, Hau CS, et al. IL-17-producing γδ T cells and neutrophils conspire to promote breast cancer metastasis. Nature 2015;522:345-8.
- Zhai S, Sun B, Zhang Y, Zhao L, Zhang L. IL‑17 aggravates renal injury by promoting podocyte injury in children with primary nephrotic syndrome. Exp Ther Med 2020;20(1):409-17.
