- *Corresponding Author:
- Saranjit singh
Department of Pharmaceutical Analysis, National Institute of Pharmaceutical Education and Research (NIPER), S.A.S. Nagar, Punjab - 160 062, India
E-mail: ssingh@niper.ac.in
| Date of Submission | 23 July 2005 |
| Date of Revision | 17 August 2006 |
| Date of Acceptance | 14 March 2007 |
| Indian J Pharm Sci, 2007, 69 (2): 197-201 |
Abstract
The distribution coefficient (log D) values of rifampicin, an essential first-line antitubercular drug, at gastrointestinal pH conditions are not reported in literature. Hence determinations were made using n-octanol and buffers ranging between pH 1-7. Also, log D values were predicted using Prolog D. Both the determinations showed opposite behaviour. The atypical experimental log D profile of rifampicin could be attributed to its surface-active properties, which also explained the reported permeability behaviour of the drug in various gastrointestinal tract segments.
Distribution coefficient (log D), measured in two-phase bulk solvent systems at different pH, is one of the main descriptors for prediction of in vivo drug permeation [1]. Its values for rifampicin, an essential first-line antituberculosis drug, at different gastrointestinal pH are not reported in the literature. Only values at selected pH are known, along with predicted partition coefficient data, which are listed in Table 1 [2-7]. Accordingly, the purpose of the present study was to determine log D values for rifampicin at various pH between 1 and 7. The log D values were also calculated using Prolog D (Pallas SCompuDrug Chemistry, Budapest, Hungary). Unexpectedly, an opposite behaviour was observed among the experimental and predicted values, which indicated an atypical experimental log D profile for rifampicin. The observed behaviour is discussed critically in this communication, based on the solubility and surface activity data, and related to the known permeability behaviour of the drug in various segments of gastrointestinal tract.
| Medium or software employed | Log D or Log P | Reference |
|---|---|---|
| Reported experimental log D values | ||
| n-Octanol-phosphate buffer, pH 7.4 | 1.19 | 2 |
| Not mentioned | 2.4 | 3 |
| n-Octanol-Dulbecco’s phosphate buffered saline, pH 7.4 | 1.25 | 4 |
| Predicted values of log P | ||
| Clog P (Chemdraw ultra) | 3.34 | - |
| Alog P | 2.95 | 5 |
| Log Kw/o (KOWWIN) | 4.24 | 6 |
| Log P (KOWWIN) | 2.5 | 7 |
| Log P (MDL QSAR) | 5.57 | 7 |
Table 1: Reported Experimental And Predicted Distribution/Partition Coefficient Values of Rifampicin
Materials and Methods
Rifampicin was a gift sample from M/S Panacea Biotec Ltd., Lalru, India. Buffer materials and all other chemicals were of analytical-reagent (A.R.) grade. n-octanol (A.R. grade) was procured from Central Drug House Pvt. Ltd., New Delhi, India. HPLC grade acetonitrile and methanol were procured from J.T. Baker (Mexico City, Mexico) and Mallinckrodt Baker Inc. (Paris, KY, USA), respectively. Ultra-pure water was obtained from an ELGA water purification unit (Elga Ltd., Bucks, England). pH recordings were made on a research pH meter (MA 235, Mettler Toledo GmbH, Schwerzenbach, Switzerland). Surface and interfacial tensions were measured using a tensiometer (K9, Kruss GMbH, Hamburg, Germany). Other equipment used was a sonicator (Branson Ultra- sonic Corporation, Danbury, CT, USA) and a centrifuge (15, Biofuge, Heraeus, Hanau, Germany). The HPLC system consisted of an on-line degasser (DGU-14AM), low-pressure gradient flow control valve (FCV-10ALVP), solvent delivery module (FCV-10ATVP),auto injector (SIL-10ADVP) and column oven (CTO-10ASVP),UV-visible dual-wavelength detector (SPD-10AVP system controller (SCL-10AVP and CLASS-VP software (all from Shimadzu, Kyoto, Japan).
HPLC analyses
Rifampicin was analyzed by a reported gradient stability-indicating method [8] using a Zorbax XDB C-18 column (250×4.6 mm, 5 μ) from Agilent Technologies, Wilmington, USA. The mobile phase was composed of acetonitrile and a buffer consisting of 0.01 M sodium dihydrogen orthophosphate (pH adjusted to 6.8 with dilute orthophosphoric acid).
Preparation of buffers, and saturation of buffers and n-octanol
The buffers of various pH were prepared according to the formulae given in Table 2 [9]. These were saturated with n-octanol for 24 h before use. Octanol was also saturated before the study with respective buffer solutions.
| pH | HCl(ml) | Citric acid (g) | Na2HPO4(g) | KH2PO4(g) | NaOH(g) | NaCl(g) | Water |
|---|---|---|---|---|---|---|---|
| 1 | 9.2 | | - | - | - | 6.1 | q.s. to make II |
| 2 | 6.7 | 6.3 | - | - | 2.4 | 4.2 | |
| 3 | 5.7 | 8.4 | - | - | 3.2 | 3.4 | |
| 4 | 3.8 | 12.6 | - | - | 4.8 | 2.1 | |
| 5 | - | 21 | - | - | 8 | | |
| 6 | - | | 2.4 | 8.7 | - | 6.6 | |
| 7 | - | - | 14.3 | 3.6 | - | 4.3 |
HCl, hydrochloric acid; Na2HPO4, disodium hydrogen phosphate; KH2PO4, potassium dihydr gen phosphate; NaOH, sodium hydroxide; NaCl, sodium chloride.
Table 2: Composition of Buffers Used In The Studies
Determination of log D
The distribution coefficients of rifampicin at different pH were determined by the standard shake-flask method [10]. For this purpose, rifampicin solution at a concentration of 500 μg/ml was prepared in buffer pre-saturated n-octanol to which an equal portion of octanol pre-saturated buffer was added.The tube was shaken horizontally for 100 times in 5 min, centrifuged at 5,000 rpm (2200 × g) for 10mm and the organic layer was analyzed by HPLC.The drug concentration in aqueous medium (Caq) was calculated by subtracting the drug concentration in octanol layfrom (Coct) from the initial drug concentration. Log D was expressed as log(Corg/Caq).The experiment was carried out in triplicate for all investigated pH values. Determinations were also made by oppositely drug solutions in octanol pre-saturated buffers to which bufer pre-saturated n-octanol was added, followed by shaking,centrifugation and analysis of the organic layer.
The determination of log D values of rifampicin at different pH by shake flask method was validated by repetition of the determinations by three different analysts. The experiments were also carried out at two other drug concentrations (100 and 1000 μg/ml), and additionally at a ratio of 1:10 of n-octanol to buffer.
Determination of surface and interfacial behaviour
Surface tension of rifampicin solutions (500 μg/ml) at pH 1 to 7 was determined using a Du-Nuoy Tensiometer. For the measurements, the suitability of the instrument was first assessed by determining the surface tensions of four standard liquids viz., water, methanol ethanol and ethylene glycol.The values for these liquids were found to be within the limit of±1 mN/m from the reported values, hence allowing direct use of the equipment. Subsequently, the ring was immersed into the sample, and the instrument reading was set at zero.Thereafter, the sample support was lowered carefully until a film was formed between the ring and the liquid surface. The measurement of surface tension was Completed when the maximum value was shown on the display This was maximum value was shown on the Display.This was repeated three times for each sample.All determinations were made between 22° and 25°. The surface activity was expressed as surface pressure [11] which was calculated by subtracting the surface tension of drug solution (γdrug) from the surface tension of blank buffer (γsolvent)
The same instrument was also used for the determination of interfacial tension of n-octanol-buffer systems. For thispurpose, the ring of the tensiometer was first dipped into n-octanol and the reading was set at zero. Thereafter, the container was removed and replaced by buffersolutions containing the drug at a concentration of 500μg/ml. After dipping the ring, n-octanol was poured onthe top of the buffer through the side of the container. The ring was then slowly lifted and the reading was noted when it crossed the interface of the buffer and n-octanol bilayer.
Prediction of log D
Log D values of rifampicin at different pH were also predicted using Prolog D, a module of Pallas Cluster, package from CompuDrug Chemistry (Budapest, Hungary). The software allows prediction of ADME-Tox parameters based on the structural formulae of the organic compounds.
Determination of solubility profile
Solubility of rifampicin was determined between pH 1 and 7 by the shake flask method. For the same, an excess amount of drug was placed in 30 ml vials and 5 ml buffer solution of respective pH was added. The vials were incubated together in a shaking water bath at 37°. Samples were withdrawn after saturation was achieved and analyzed by HPLC after appropriate dilution. All the studies were conducted in triplicate.
Results and Discussion
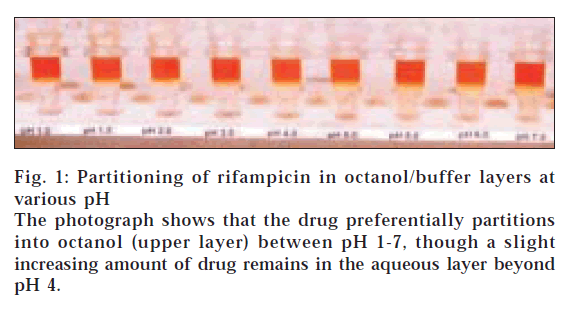
Table 3 lists the log D values of rifampicin determined at different pH by three analysts. The drug solutions in this case were made in n-octanol. It shows that the values determined by three different analysts were consistent to each other. It also depicts that log D values decreased as the pH increased from 1 to 7. Fig. 1 shows the photograph of the Eppendorf tubes containing the two liquid phases after shaking and centrifugation. It depicts that at all the pH, most of the drug partitioned into the octanol layer, which explains the positive log D values in Table 3. The photograph shows a slight and increasing yellow colour in aqueous layer at pH>3, which justifies the decrease in log D values with increase in pH. A same behaviour was also observed when the experiment was repeated by preparing drug solutions in buffer, instead of n-octanol. The data for the reverse experiment are also given in Table 3, which clearly show similarity of values with those obtained by preparing drug solutions in n-octanol. Visibly also, most of the drug was found to be immediately transferred from the aqueous layer to the organic layer, after addition of organic layer to the buffer containing the drug. A similar observation was also made by Mannisto [12], who reported that dissociated and undissociated forms of rifampicin were always found inbutanol layer, when water-lipid partition experiment was done at wide range of pH conditions. Unfortunately, the report neither gives the profile nor values of log D of rifampicin at various pH in butanol/buffer system.
| Observed pH | Log D±SD (n = 3) | |||
|---|---|---|---|---|
| Analyst 1 | Analyst 2 | Analyst 3 | Analyst 4 | |
| Drug solution* in n-octanol | Drug solution in buffer | |||
| 1.12 | 1.606±0.042 | 1.409±0.049 | 1.530±0.037 | 1.525±0.062 |
| 2.06 | 1.317±0.018 | 1.258±0.009 | 1.248±0.067 | 1.260±0.002 |
| 2.97 | 1.171±0.035 | 1.156±0.029 | 1.139±0.047 | 1.132±0.004 |
| 4.03 | 1.049±0.012 | 1.078±0.036 | 1.032±0.026 | 1.087±0.005 |
| 5.06 | 0.992±0.001 | 0.977±0.032 | 0.969±0.083 | 1.008±0.001 |
| 6.08 | 0.765±0.020 | 0.755±0.028 | 0.847±0.057 | 0.896±0.036 |
| 7.06 | 0.736±0.002 | 0.705±0.021 | 0.806±0.043 | 0.881±0.001 |
*Drug concentration was 500 μg/ml in each case. The organic phase:buffer ratio was 1:1. SD, standard deviation.
Table 3: Log D Values of Rifampicin Determined By Preparing Drug Solutions In Octanol And Buffer, And Inter-Analyst Variation of Values
Table 4 gives the log D values determined at 100 and 1000 μg/ml. Evidently, there was no significant influence of the drug concentration on the determined log D values. Table 5 lists the log D values obtained using 1:10 ratio of n-octanol:buffer. This study with lesser amount of octanol was justified as rifampicin partitioned preferentially into octanol. The change in the ratio of octanol:buffer from 1:1 to 1:10 did not result in change in log D values or even the trend of decrease in log D values with an increase in pH (Table 3).
| Observed pH | Log D±SD (n = 3) | |
|---|---|---|
| 100 µg/ml | 1000 µg/ml | |
| 1.12 | 1.456±0.070 | 1.549±0.045 |
| 2.06 | 1.323±0.034 | 1.276±0.044 |
| 2.97 | 1.247±0.006 | 1.159±0.016 |
| 4.03 | 1.074±0.010 | 1.095±0.031 |
| 5.06 | 1.042±0.019 | 1.037±0.020 |
| 6.08 | 0.871±0.069 | 0.852±0.044 |
| 7.06 | 0.842±0.061 | 0.843±0.042 |
*Solutions were prepared in n-octanol saturated for 24 h with buffer phase. The organic phase:buffer ratio was 1:1. SD, standard deviation.
Table 4: Influence of Drug Concentration*On Log D Values Of Rifampicin
| Observed pH | Log D |
|---|---|
| 1.12 | 1.522±0.007 |
| 2.06 | 1.325±0.005 |
| 2.97 | 1.291±0.007 |
| 4.03 | 1.210±0.004 |
| 5.06 | 1.161±0.003 |
| 6.08 | 0.955±0.001 |
| 7.06 | 0.888±0.004 |
*The concentration of drug solution employed was 500 μg/ml.
Table 5: Log D of Rifampicin* Determined Using1:10 Ratio Of N-Octanol-Buffer System
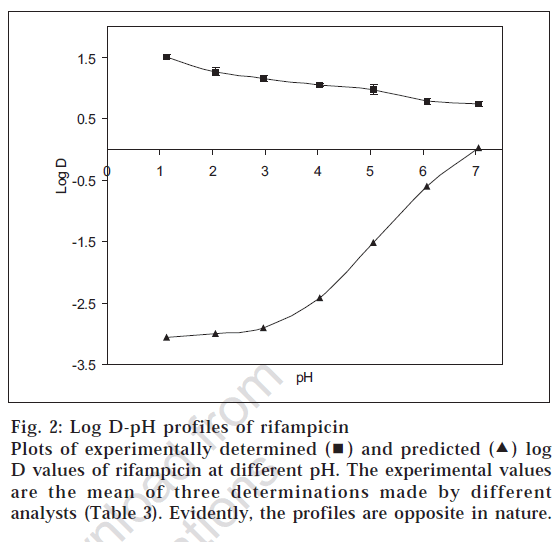
Fig. 2 shows the comparison of the log D values determined by shake flask method and the predicted data using Prolog D. It is evident that the two profiles were exactly opposite. In case of experimental determination, the log D values were positive and decreased as the pH was increased. On the other hand, the log D values predicted from the software were all negative, and the curve was sigmoidal in nature, which rose sharply beyond pH 3.
The solubility of rifampicin at different pH is given in Table 6. Evidently, the solubility of the drug was very high at acidic pH (pH ≤ 2) and decreased as the pH was increased. The profile conformed to the known ionization behaviour of the drug2. Accordingly, it was expected that rifampicin would remain in water in acid region and partition to a lesser extent into the organic phase. But an opposite pattern was observed in the present study. As apparent from the data in Tables 3-6, rifampicin partitioned more strongly into the organic layer at lower pH. Thus solubility data did not explain the atypical log D behaviour of rifampicin.
| Observed pH | Solubility±SD (n = 3) (mg/ml) |
|---|---|
| 1.12 | 127.20±12.2 |
| 2.06 | 19.20±1.57 |
| 2.97 | 0.24±0.03 |
| 4.03 | 0.19±0.02 |
| 5.06 | 0.44±0.05 |
| 6.08 | 0.70±0.04 |
| 7.06 | 0.85±0.13 |
SD, standard deviation
Table 6: solubility of rifampicin at various ph
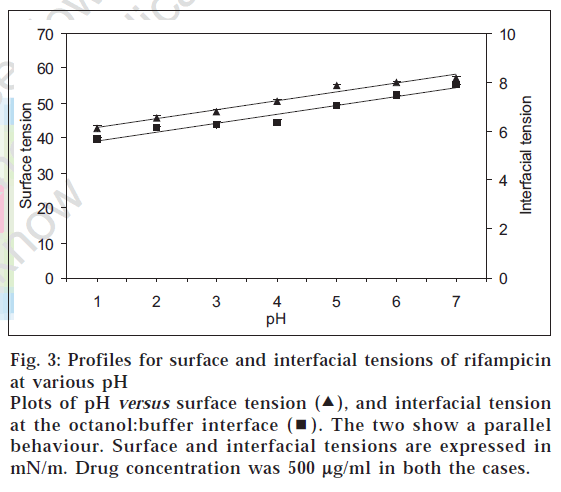
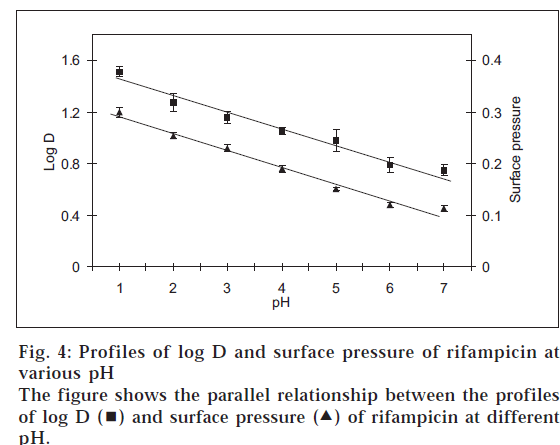
In that situation, the amphoteric nature of rifampicin [2] and hence its surface activity was considered as the reason for the atypical log D behaviour and quantitative transfer of the drug into organic medium between pH 1-7. Such a characteristic is known for other amphoteric drugs like celecoxib, meloxicam and nimesulide, which possess surface-active properties [11]. Fig. 3 shows the plots of surface pressure (difference between the surface tension of the drug solution to that of blank buffer) of rifampicin and its log D values at various pH conditions. The plots were parallel in nature, thus confirming the contention that higher experimental log D values for rifampicin in acidic pH range were due to higher surface activity of the drug. In addition, the parallel behaviour between surface and interfacial tension (fig. 4) indicated that not only the surface activity, but interfacial tension also contributed towards preferential transfer of rifampicin to the organic (octanol) layer at acidic pH.
Figure 3: Profiles for surface and interfacial tensions of rifampicin at various pH
Plots of pH versus surface tension ( ), and interfacial tension at the octanol:buffer interface (
 ). The two show a parallel behaviour. Surface and interfacial tensions are expressed in mN/m. Drug concentration was 500 µg/ml in both the cases.
This reason also explains the higher permeability of rifampicin through stomach as compared to intestine [13]. It is reported that drugs with surface-active property reduce the surface tension between drug solution and biological membrane, resulting in concentration of more number of drug molecules at the biological interface, where they interact with charged carriers to form neutral species.These neutral molecules cross the biological membrane, and hence show good absorption through stomach [14]. The same is postulated to happen in the case of rifampicin.
References
- Malkia, A., Murtomaki, L., Urtti, A. and Kontturi, K., Eur. J. Pharm. Sci., 2004, 23, 13.
- Gallo, G.G. and Radaelli, P. In; Florey, K., Eds., Analytical Profiles of Drug Substances, Academic Press, London, 1976, 467.
- Washington, N., Lamont, G., Wilson, C.G., Washington, C. and Withington, R., Int. J. Pharm., 1994, 108, 125.
- Available from http://www.cerep.fr/cerep/users/pages/downloads/Documents/Marketing/ Pharmacology 20% & 20% ADME/Application 20% notes/ PartitionCoefficient.pdf (Accessed on 15-08-2006).
- Barry, C.E., Slayden, R.A., Sampson, A.E. and Lee, R.E., Biochem. Pharmacol., 2000, 59, 221.
- Rodriques, C., Gameiro, P., Reis, S., Lima, J.L.F.C. and Castro, B.D., Biophys. Chem., 2001, 94, 97.
- Available from http://chemdb.niaid.nih.gov/struct_search/lr/LR_HIV_OI.asp?LITREF=12951 (Accessed on 15-08-2006).
- Mohan, B., Sharda, N. and Singh, S., J. Pharm. Biomed. Anal., 2003, 31, 607.
- Koizumi, T., Arita, T. and Kakemi, K., Chem. Pharm. Bull., 1964, 12, 413.
- EPA. Prevention, pesticides and toxic substances (7101): Product properties test guidelines OPPTS 830.7550. Partition coefficient (n-octanol/water), shake flask method. EPA 712-C-96-038, United States Environmental Protection Agency, 1996, 1.
- Seedher, N. and Bhatia, S., Indian J. Pharm. Sci., 2004, 66, 254.
- Mannisto, M.D.P., Clin. Pharmacol.Ther., 1976, 21, 370.
- Mariappan, T.T. and Singh, S., Int. J. Tuberc. Lung Dis., 2003, 7, 797.
- Fiese, G. and Perrin, J.H., J. Pharm. Sci., 1969, 58, 599.


