- *Corresponding Author:
- D. Das
Department of Pharmacognosy, Bhubaneswar, Odisha 761211, India
E-mail: debajyotids@gmail.com
| Date of Received | 13 July 2021 |
| Date of Revision | 27 July 2023 |
| Date of Acceptance | 02 January 2024 |
| Indian J Pharm Sci 2024;86(1):117-131 |
This is an open access article distributed under the terms of the Creative Commons Attribution-NonCommercial-ShareAlike 3.0 License, which allows others to remix, tweak, and build upon the work non-commercially, as long as the author is credited and the new creations are licensed under the identical terms
Abstract
Balarista, a traditional fermented biomedicine, is prescribed for treating rheumatoid arthritis. The present work was undertaken to standardize the Balarista formulation using Fourier-transform infrared fingerprinting and high-performance thin-layer chromatography analysis and evaluate its antioxidant properties. The quality control of the in-house Balarista and marketed formulations was assessed by microbial count, aflatoxin content, high-performance thin-layer chromatography, and Fourier-transform infrared fingerprint analysis. The in vitro antioxidant properties of the formulation were studied by 2, 2-diphenyl-1-picrylhydrazyl, 2, 2′-azino-bis-(3-ethylbenzothiazoline-6-sulfonic acid), hydrogen peroxide, nitric oxide scavenging and reducing power assay. Total bacterial count in in-house Balarista and M1 was found within the standard limit. Aflatoxin content was found less than 5.0 ppb in all formulations. Fourier-transform infrared fingerprint spectra of different fraction of M1 formulation revealed an excellent common peak ratio with in-house Balarista, suggesting the use of prescribed raw materials in the formulations. However, the poor common variation peak ratio with other marketed formulations indicates the use of improper raw materials. The high-performance thin-layer chromatography profile of chloroform fraction of in-house and marketed formulations revealed five spots each while ethyl acetate fraction of in-house Balarista and M3 showed six spots each. The highest 2, 2-diphenyl-1-picrylhydrazyl and nitric oxide radical scavenging activity was achieved by in-house Balarista, 2, 2′-azino-bis-(3-ethylbenzothiazoline-6-sulfonic acid) by M4, hydrogen peroxide by M1 and reducing power by M2 formulation. The antioxidant activity of the formulation could be due to the presence of considerable amount of phenolic and flavonoid content. The formulation's comprehensive chemical analysis by Fouriertransform infrared and high-performance thin-layer chromatography profile can be used as standards for future reference.
Keywords
Balarista, Fourier-transform infrared, High-performance thin-layer chromatography, aflatoxin, microbial count, antioxidant
Ayurveda has been practiced for thousands of years and has been estimated to meet 70 %-80 % of the healthcare needs in India due to its safety and efficacy. As there is increasing demand of Ayurvedic formulations in the present era, pharmacist and physicians must know about the safety and effectiveness of these preparations[1]. Therefore, quality control tests have been prescribed by Ayurvedic pharmacies to make sure that the prepared formulations meet the standard limits as mentioned in the Ayurvedic Pharmacopoeia of India (API). Different methods of evaluation mentioned in ancient literature need more scientific validation. Therefore, developing quality control parameters using modern analytical techniques to standardize Ayurvedic formulations is of prime importance[2]. As the Ayurvedic formulations come under the Drugs and Cosmetics Act, there is a need to develop standards for the quality control by the drug control authorities as well as by the manufactures[3].
Fourier-Transform Infrared Spectroscopy (FTIR) is getting advantages over other methods due to its high resolution, fast measurement, low cost, simultaneous determination of functional groups, phytochemicals, phytoelements and direct measurement of samples without sample preparation. Due to this, there is an increasing demand in agriculture, biology, ecology, biochemistry and medicine[4]. FTIR spectroscopy has also been found successful in examining pure powdered compounds. But in the past decade, there has been a significant increase in the use of infra-red spectroscopy for the testing of both herbal extract and crude materials. Attenuated Total Reflection- Infrared (ATR-IR) and Near Infrared (NIR) are the most commonly applied techniques for the analysis of herbal medicines[5]. High-Performance Thin-Layer Chromatography (HPTLC) is the most widely used analytical technique for the identification and quality assessment of herbal materials. Due to its automated procedure and excellent reproducibility of chromatographic conditions, there is an increased demand for HPTLC in standardizing herbal preparations[6]. HPTLC fingerprints are essential in characterizing multiple compounds in the botanicals, detection of adulterants, and differentiation between closely related species. Analysis of numerous samples in a single assay in the industry is another advantage of HPTLC[5].
Balarista, a traditional fermented biomedicine, consists of twelve ingredients, among which Withania somnifera and Sida cordifolia are the most important. This formulation is mainly prescribed for the management of digestive impairment, general weakness, and Rheumatoid Arthritis (RA)[7]. Marketed herbal formulations are not standardized properly and also not assessed for their quality which leads to several issues[8]. The quality control of raw materials (macroscopic, microscopic, scanning electron microscopy, physicochemical parameters, Gas Chromatography-Mass Spectrometry, and High-Performance Layer Chromatography analysis using withanolides and vasicine as marker compounds) used in the preparation of Balarista formulation was carried out in our previous study[9]. In the present investigation, an In-house Balarista Formulation (IBF) was prepared using various ingredients. The quality control was assessed by FTIR fingerprint and HPTLC analysis and compared with the marketed formulations.
Materials and Methods
Plant materials:
The crude drug materials referred to in API were procured from the local market and authenticated by Prof. Dr. Arun Kumar Das, Department of Rasa Sastra Bhaisajya Kalpana, Gopabanhu College of Ayurveda, Puri, Odisha. The prepared herbariums (SPS/SOAU-22-33) were stored in the Department of Pharmacognosy as a reference.
Preparation of Balarista formulation:
Balarista formulation was formulated using the raw materials according to the standard procedure mentioned in API[10] and referred to as IBF formulation. The root of Sida cordifolia (L) and Withania somnifera (L Dunal) were the primary ingredients of Balarista formulation, along with minor ingredients such as Saccharum officinarum (L), Woodfordia fruticosa flower (L) Kurz, Ipomoea digitata sub root (L), Ricinus communis root (L), Alpinia galanga root (L) Willd., Elettaria cardamom seed (L) Maton, Paederia foetida whole plant (L), Syzygium aromaticum flower buds (L) Merr and L. M. Perry, Vetiveria zizanioids root (L) Nash and Tribulus terrestris fruit (L). Four marketed formulations of different manufacturers were purchased from local markets and coded as M1 (B.N.517244), M2 (B.N.HA-071), M3 (B.N.SB0108) and M4 (B.N. RN-02/12).
Determination of total aerobic microbial count and aflatoxin content:
The total bacterial count was performed as per the method described in API[11]. The quantitative estimation of total aflatoxin was carried out by using a complete aflatoxin assay kit (Helica Biosystems, USA).
FTIR spectroscopy analysis of formulation:
About 50 ml of IBF and marketed formulations were fractionated with n-hexane, chloroform, and ethyl acetate in a separating funnel, finally, the remaining portion was filtered and concentrated on getting n-hexane, chloroform, ethyl acetate, and aqueous extract respectively[12]. The different fractions of formulations were taken for FTIR analysis. All the spectra were recorded in 400 cm- 1-4000 cm-1 using an ALPHA II FTIR spectrometer and a platinum ATR unit, using OPUS TOUCH software. The spectra were collected at a resolution of 4 cm-1.
Quantitative evaluation of similarity between IBF and marketed formulation using FTIR spectrum:
The quantitative evaluation of similarity between the different fractions of IBF and marketed formulation in the Fingerprint Spectra (F.P.S) 400 cm-1-1500 cm-1 region was performed by the common peak ratio method described by Zou et al.[13]. IBF was considered as a reference sample. The formulations were arranged according to common peak ratio values from high to low, and the relationship between IBF and marketed formulations was determined quantitatively. The common peak ratio, with a higher common peak ratio, indicates a closer similarity between the IBF and the marketed formulation.
HPTLC analysis:
For HPTLC analysis, pre-coated aluminium plates (10×10 cm) of silica gel 60 F254 of 0.2 mm thickness were taken and activated at 60° for 5 min. Chloroform and ethyl acetate fractions of IBF and marketed formulations were dissolved in respective solvents and passed through a 0.45 millipore filter. The sample concentration was taken at 10 mg/ml and applied as a band of 10 μl using CAMAG LINOMAT 5 applicator. The plates were developed in the CAMAG glass chamber (20X 10 cm) saturated with mobile phase, toluene:ethyl acetate:glacial acetic acid (55:45:3) for chloroform fraction, and toluene:ethyl acetate:formic acid (15:4.5:1.5) for ethyl acetate fraction for 20 min. The image of the developed plate was observed under daylight, 254 nm and 366 nm. Methanolic sulphuric acid (10 %) was used for derivatization of plates. The plates were heated at 100° for 3 min till the spots were visible. The developed plates were dried at room temperature and observed under daylight and at 366 nm using CAMAG SCANNER 4. The Rf values were recorded using Vision CATS, version 2.5.18262.1 software.
Determination of total phenolic and flavonoid content:
The IBF and marketed formulations were dried in the water bath to remove the alcohol and water. The obtained solid mass was suspended in methanol, filtered and allowed to dry in the water bath to get the methanol extract of the formulation[12]. Folin-Ciocalteu reagent was used to determine of total phenolic content[14]. The gallic acid content was calculated by plotting the standard curve of gallic acid (5-100 μg) and expressed as mg of Gallic Acid Equivalent (GAE) per g of extract. The total flavonoid content was determined following the method of Meda et al.[15]. The content of total flavonoid was estimated from the standard curve of quercetin (5-100 μg) and expressed as mg of Quercetin Equivalent (QE).
Determination of in vitro antioxidants:
The methanolic fraction of IBF and marketed formulation (25-400 μg/ml) was subjected to 2, 2-Diphenyl-1-Picrylhydrazyl (DPPH)[16], 2, 2′-Azino-Bis-(3-ethylbenzothiazoline-6-Sulfonic acid) (ABTS)[17], Hydrogen peroxide (H2O2)[18], nitric oxide[19] radical scavenging activity and reducing power assay[17] using ascorbic acid as standard. The total phenolic content and flavonoid content were expressed as milligrams of GAE/g and mg of QE/g respectively.
Calculation of half-maximal Inhibitory Concentration (IC50) value:
It is defined as the concentration of antioxidants required to scavenge 50 % of the free radicals, which was determined by plotting the graph, scavenging activity versus the concentration of formulation[16].
Statistical analysis:
All the data was performed in triplicate and subjected to statistical analysis by One-way Analysis of Variance (ANOVA), and posthoc Tukey honest significant difference test using Graphpad Prism 6.01 software. The results were expressed as mean±standard error mean (SEM). p˂0.05 was considered statistically significant.
Results and Discussion
Microbial contamination not only affects the chemical composition but also causes a decrease in the therapeutic potency of herbal drugs.
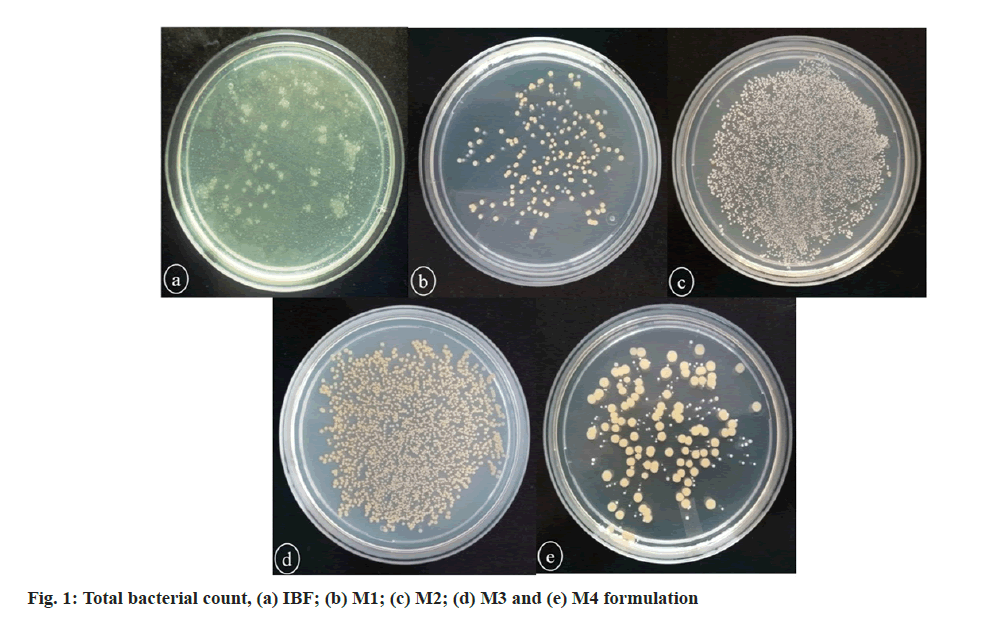
Therefore, the raw materials should be prevented from microbial contamination before processing to formulation[20]. The total aerobic count of IBF and marketed formulations is depicted in fig. 1 and Table 1. IBF and M1 were found within the pharmacopoeial limit, while M2 and M3 were overloaded with bacteria. M4 formulation was observed just above the pharmacopoeial limit. The total bacterial count in IBF and M1 formulation was found within the API limit. Mycotoxins are the toxic secondary metabolites produced by the eukaryotic organisms’ fungi under favorable temperature and humidity conditions. As the herbal drug materials used in the preparation of herbal formulations are mostly contaminated with these fungi due to improper handling, there is a probability of getting contamination with mycotoxins during pre-harvest or post-harvest[21]. About 300 mycotoxins, such as aflatoxins, ochratoxins, patulin, zearalenone, fumonisins, and trichothecenes have been identified[22]. Among these, aflatoxins are produced from Aspergillus species, such as Aspergillus flavus, Aspergillus parasiticus, Aspergillus nomius and Aspergillus niger[23], which is considered as group 1 human carcinogen according to ‘The International Agency of Research on Cancer’ (IARC)[24]. The detection of aflatoxin in the herbal materials indicates contamination by fungi (Aspergillus flavus and Aspergillus parasiticus) which produce aflatoxins. In the present study, the aflatoxin content in IBF, M1, M2, M3 and M4 formulations was found to be less than 5.0 ppb, indicating less contamination of raw materials (Table 1).
| Formulation | Total aerobic count | Pharmacopoeial limit | Total aflatoxin (ppb) |
|---|---|---|---|
| IBF | 12.9×10⁷ CFU/ml | Not more than 300 CFU/ml | <5.0 |
| M1 | 16.8×10⁷ CFU/ml | Not more than 300 CFU/ml | <5.0 |
| M2 | 81.9×10⁷ CFU/ml | Not more than 300 CFU/ml | <5.0 |
| M3 | 60.1×10⁷ CFU/ml | Not more than 300 CFU/ml | <5.0 |
| M4 | 33.3×10⁷ CFU/ml | Not more than 300 CFU/ml | <5.0 |
Note: CFU: Colony Forming Unit and PPB: Parts Per Billion
Table 1: Determination of Total Aerobic Count and Aflatoxin Content in Ibf, M1, M2, M3 and M4 Formulation
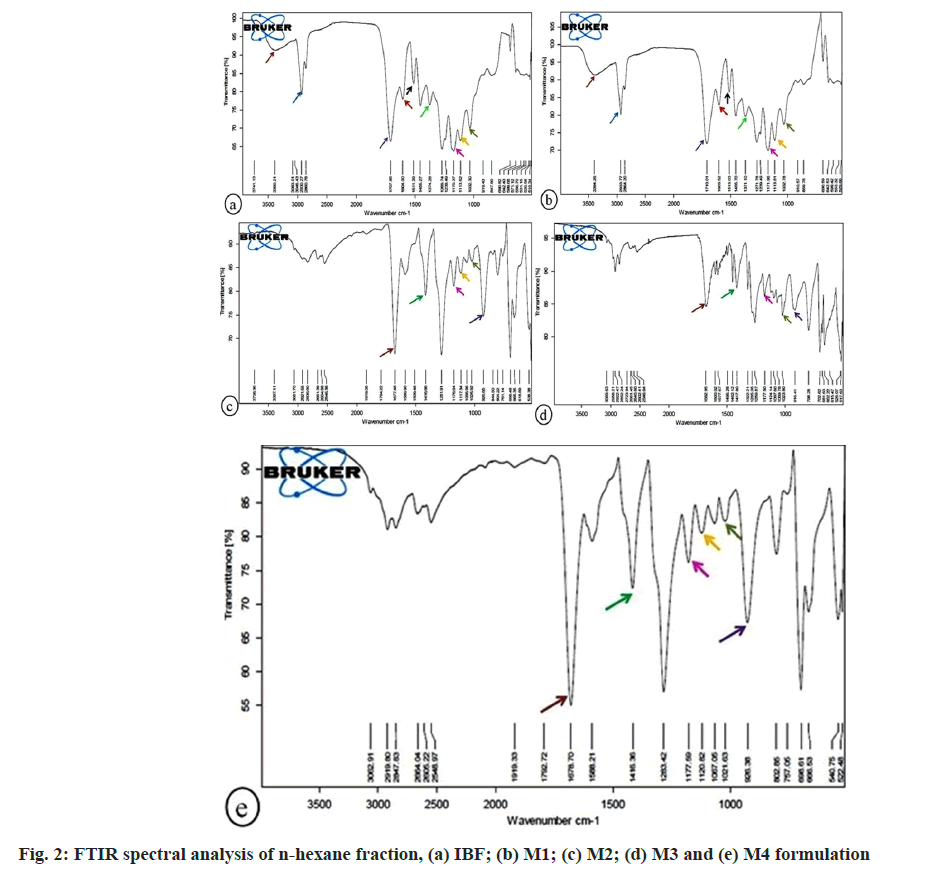
FTIR spectral analysis of n-hexane fraction of formulations presented in fig. 2. In IBF, M1 formulations, the aliphatic primary amine was identified by the absorbance peak at 3390.21 and 3394.26 cm-1, which represented N-H stretching vibration. The absorbance peak at 2930.27, 2933.77 cm-1 due to asymmetric C-H stretching vibration signified the occurrence of an acyclic compound in IBF, M1 formulations. The strong C=O stretching vibration at peaks 1707.85, 1710.01 cm-1 revealed a carboxylic group in IBF and M1 formulation. The cyanovinyl group, due to strong C=C stretching vibration at peak 1604.00, 1603.52 cm-1 appeared in IBF and M1 formulation. The strong asymmetric NO2 stretching vibration at peak 1511.29, 1513.03 cm-1 portrayed α, β-unsaturated nitro compounds in IBF, M1 formulation. The absorbance peak at 1455.27, 1455.70, 1452.12 cm-1 due to N=N stretching vibration observed azothio compound in IBF, M1, M3 formulation. Due to C-H deformation vibration at peak 1374.28, 1371.10 cm-1, the aldehyde group was found in IBF, M1 formulation. The C-H symmetric deformation vibration at peaks 1269.74, 1271.78, and 1259.87 cm-1 implied methyl silane in IBF, M1, and M3 formulations. The CH3 rocking vibration at peak 1170.37, 1171.96, 1176.64, 1177.50, 1177.59 cm-1 portrayed 1-methoxy phosphane group in IBF, M1, M2, M3, M4 formulations. The absorbance peak at 1113.62, 1113.81, 1117.34, and 1120.82 cm-1 due to strong C-O stretching vibration depicted secondary alcohol in IBF, M1, M2, and M4 formulations. The primary aliphatic amine due to C-N stretching vibration at 1032.30, 1032.78, 1025.92, 1023.80, 1021.63 cm-1 was noticed in IBF, M1, M2, M3, and M4 formulation. The sharp and strong absorbance peak at 690.82, 690.59, 698.48, 702.62, 698.61 cm-1 due to ring deformation vibration implied the presence of 1-alkylbenzene in IBF, M1, M2, M3, M4 formulation.
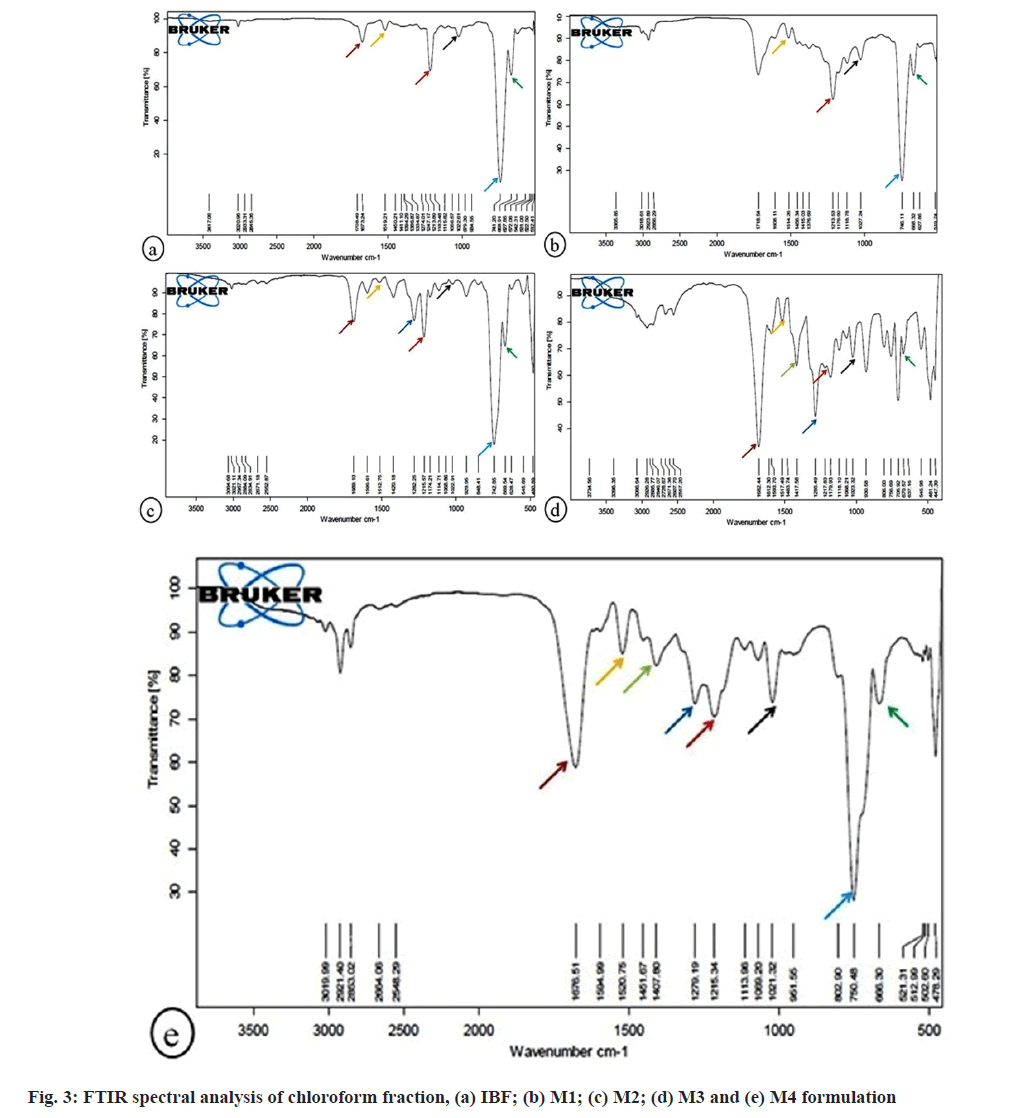
FTIR spectral analysis of chloroform fraction of formulation (fig. 3) revealed the strong C=O stretching vibration at absorption band 1673.24, 1689.10 1682.44, 1676.51-1 cm displayed ketone group in IBF, M2, M3, and M4 formulation. Due to N-O stretching vibration, the absorbance band at 1519.21, 1514.26, 1512.75, 1517.49 and 1520.75 cm-1 revealed nitro compound in IBF, M1, M2, M3, and M4 formulation. The vinyl ether group due to C-O stretching vibration at 1213.89, 1213.53, 1215.57, 1217.83, 1215.34 cm-1 was depicted in IBF, M1, M2, M3 and M4. The absorption peak at 1022.61, 1027.24, 1022.91, 1023.32, 1021.32 cm-1 due to C-N stretching vibration revealed primary aliphatic amine in IBF, M1, M2, M3, M4 formulations. The observed secondary amine in IBF, M1, M2 and M4 formulations was due to strong N-H wagging vibrations at 741.20, 746.11 and 742.85, 750.48 cm-1. The display of aliphatic aldehyde compound in IBF, M1, M2, M3, M4 formulations was due to C-C-CO wagging vibration at 668.91, 668.32, 669.54, 670.57, 666.30 cm-1.
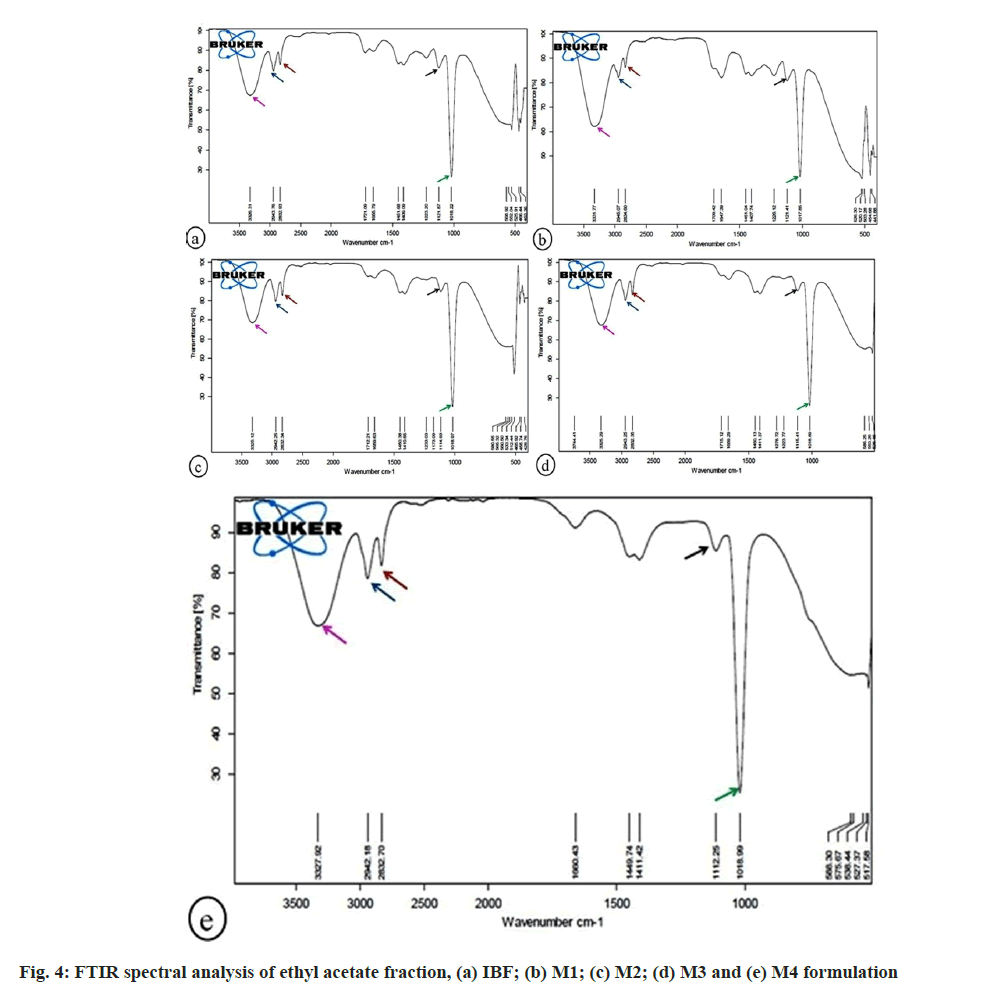
Fig. 4 displayed the FTIR spectral study of the ethyl acetate fraction of formulation. The absorption band at 3326.31, 3331.77, 3325.12, 3325.29, 3327.92 cm-1 due to the strong and broad O-H stretching vibration represented alcohol group in IBF, M1, M2, M3, M4 formulations. The 1-methyl argon group in IBF, M1, M2, M3, M4 formulations was due to C-H asymmetric stretching vibration at 2943.76, 2945.07, 2942.25, 2943.25 and 2942.18 cm-1. The sharp C-H symmetric stretching vibration at 2832.93, 2834.60, 2832.34, 2832.35, and 2832.70 cm-1 depicted ether group in IBF, M1, M2, M3, M4 formulations. The ethylene group in IBF, M1, M2, M3, and M4 formulation was due to C=C stretching vibration at peak 1655.79, 1647.39, 1659.63, 1659.29, 1660.43 cm-1. The N=N stretching vibration at wave length 1451.68, 1451.04, 1450.38,1450.13, 1449.74 cm-1 resulted azothio compound in IBF, M1, M2, M3, M4 formulations. C-H in-plane deformation vibration at 1409.09, 1407.74, 1410.65, 1411.37, and 1411.42 cm-1 displayed vinylene in IBF, M1, M2, M3, M4 formulations. Due to C-O stretching vibration, the absorption band at 1121.87, 1121.41, 1114.93, 1115.41, and 1112.25 cm-1 revealed saturated secondary alcohol in IBF, M1, M2, M3, and M4 formulations. The presence of monothio ester group in IBF, M1, M2, M3, M4 formulations was due to strong C-S stretching vibration at 1018.22, 1017.85, 1018.97, 1018.89, 1018.99 cm-1.
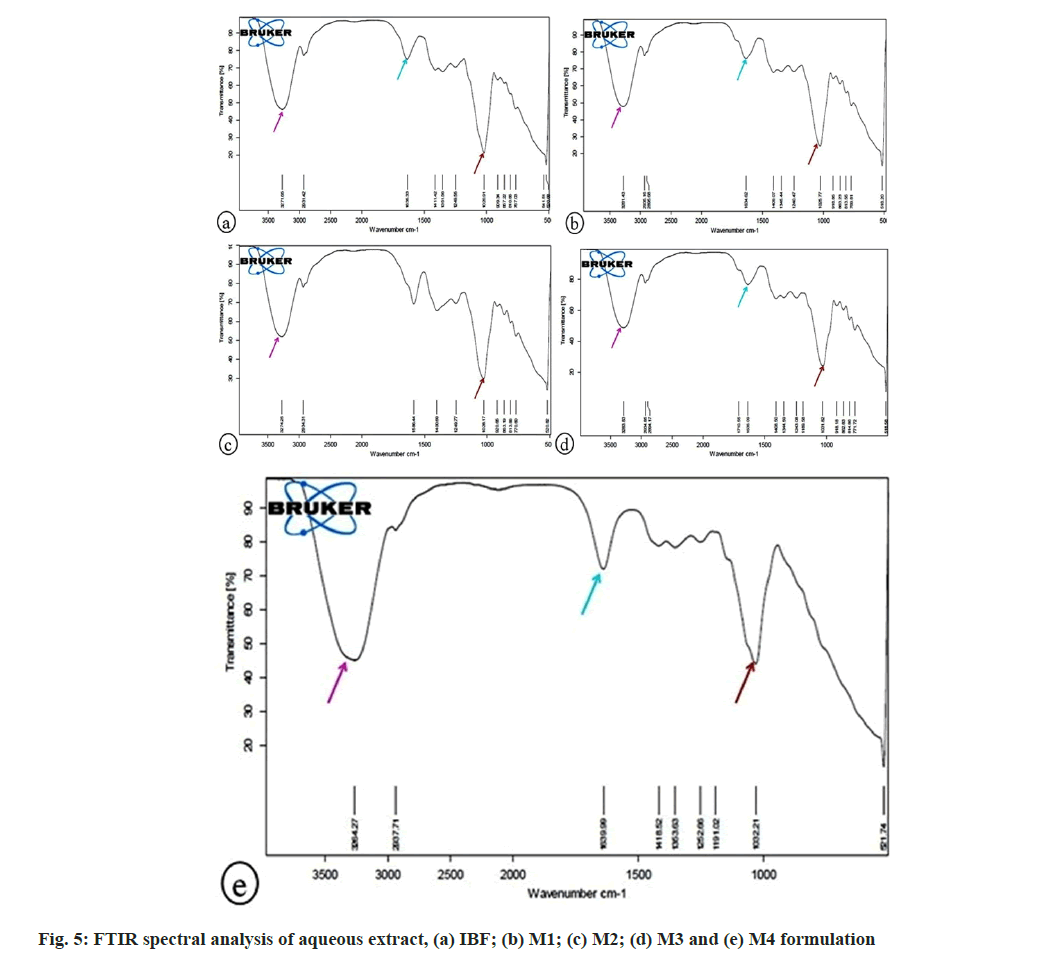
FTIR analysis of the aqueous fraction of formulation was given in fig. 5. The absorption peak at 3271.65, 3281.43, 3274.25, 3283.83, and 3264.27 cm-1 represented alcohol in IBF, M1, M2, M3, and M4 formulation due to the strong and broad O-H stretching vibration. The absorption band at 1635.33, 1634.62, 1636.09, and 1639.99 cm-1 implied an alkene group in IBF, M1, M3, and M4 formulations due to C=C stretching vibration. C-H rocking vibration at 1249.55, 1240.47, 1249.77, 1243.08, and 1252.66 cm-1 presented vinyl groups in IBF, M1, M2, M3, and M4. Strong C-O stretching vibration at 1020.91, 1025.77, 1028.17, 1031.82, 1032.21 cm-1 revealed acyclic secondary alcohol group in IBF, M1, M2, M3, and M4 formulation.
The absorbance of IR frequency depends upon the chemical nature of the sample. It thus helps in the identification of functional groups (e.g., carboxylic acid, aldehyde, amines, alcohol, etc.) and compounds[25]. The present study recorded FTIR spectra in the fingerprint region, 400-1500 cm-1, to examine the chemical compositions of different fractions of IBF, M1, M2, M3, and M4 formulations. The common variation peak ratios were performed between IBF and marketed formulations to mark the characteristic peaks and check their presence in the marketed formulations. For this, some sharp, intense, and well-defined peaks in FTIR FPS were selected from each fraction of IBF formulation to characterize their presence in the respective fractions of marketed formulations (Table 2).
| Fraction | Formulation | Peak (cm-1) | Peak ratio of marketed formulation |
|---|---|---|---|
| n-Hexane | IBF | 1455.27, 1374.28, 1269.74, 1239.49, 1170.37, 1113.62, 1032.30, 919.43, 847.80, 690.82, 642.43, 531.15, 520.58, 510.34 | |
| M1 | 1455.70, 1371.10, 1271.78, 1213.49, 1171.96, 1113.81, 1032.78, 910.57, 690.59, 642.53, 529.66 | 55 | |
| M2 | 1117.34, 844.50, 698.48, 665.35 | 14.81 | |
| M3 | 1452.12, 1259.87, 1023.80, 702.62, 526.07, 517.63 | 20 | |
| M4 | 1021.63, 926.38, 698.61, 666.53, 540.75, 522.48, 1177.59 | 30.43 | |
| Chloroform | IBF | 1450.21, 1411.10, 1394.29, 1274.01, 1213.89, 1183.48, 1115.82, 1066.57, 1022.61, 979.30, 741.20, 668.91, 627.85, 542.31, 522.50, 512.41 | |
| M1 | 1456.34, 1415.03, 1376.69, 1213.53, 1176.60, 1118.78, 1027.24, 746.11, 668.32, 627.85, 519.74 | 50 | |
| M2 | 1420.18, 1282.25, 1215.57, 1114.71, 1068.86, 1022.91, 742.85, 669.54, 628.47, 545.69 | 38.46 | |
| M3 | 1217.83, 1068.21, 1023.32, 670.57, 637.16 | 14.7 | |
| M4 | 1451.67, 1215.34, 1113.96, 1069.20, 1021.32, 951.55, 750.48, 666.30, 521.31, 512.99 | 37.03 | |
| Ethyl aceatate | IBF | 1451.68, 1409.09, 1121.87, 1018.22, 525.91, 466.44 | |
| M1 | 1451.04, 1407.74, 1121.41, 1017.85, 441.88 | 33.33 | |
| M2 | 1450.38, 1410.65, 1114.93, 1018.97, 512.44 | 26.31 | |
| M3 | 1450.13, 1411.37, 1115.41, 1018.89 | 28.57 | |
| M4 | 1449.74, 1411.42, 1112.25, 1018.99 | 28.57 | |
| Aqueous | IBF | 1411.42, 1351.56, 1249.55, 1020.91, 909.34, 857.22, 810.66, 767.72 | |
| M1 | 1409.07, 1345.44, 1240.47, 1025.77, 918.85, 863.23, 813.55, 769.81 | 80 | |
| M2 | 1400.69, 1249.77, 1028.17, 920.65, 863.19, 813.86, 770.60 | 70 | |
| M3 | 1408.50, 1344.59, 1243.08, 1031.82, 918.18, 862.83, 814.86, 771.72 | 72.72 | |
| M4 | 1418.52, 1353.63, 1252.66, 1032.21 | 36.36 |
Table 2: Specific Peaks in Fourier Transform Infrared-Fingerprint Spectra of Different Fractions of Ibf, M1, M2, M3 And M4 Formulations for Their Characterization With Corresponding Peak Ratio
FTIR spectral analysis revealed the differences in the absorbance between the same fractions of the different formulations, which could result from using different raw materials or adding organic substances by different manufacturers[26]. It is observed that, the intensity and the area of these characteristic peaks in the same fraction obtained from different formulation showed significant changes, however, their peak positions remained unaltered. This study revealed that all fractions except ethyl acetate of the M1 showed a very good common variation peak ratio with IBF formulation (Table 2). The strong common variation peak ratio observed with M1 formulation suggests using of prescribed raw materials in the formulation. However, poor common variation peak ratios were noticed in M2, M3 and M4 formulation. This confirms that although the label of all marketed formulations represents the ingredient as per API, but the lower common variation peak ratio indicates that there may be use of improper raw materials or different methods of preparation in the formulation, which were responsible for new peaks or a shift in peaks, giving rise to a poor common variation peak ratio. Thus, the common peak ratio could be used to judge the quantitative similarity and quality control of the formulations.
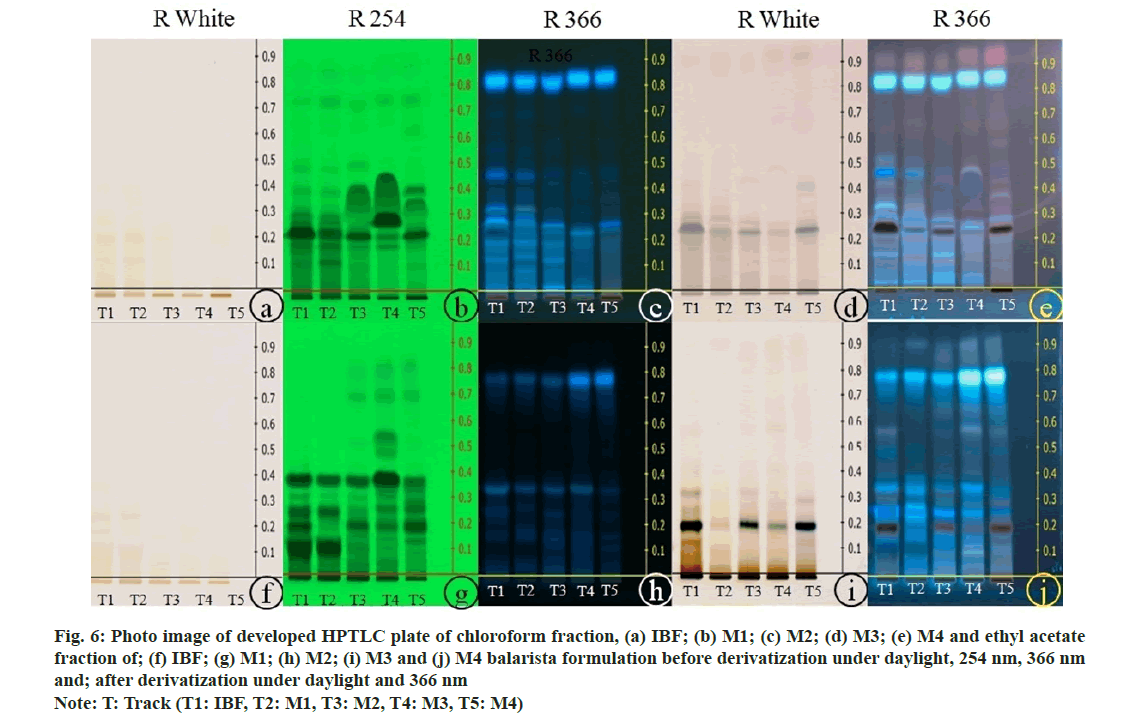
The photo images of the developed HPTLC chromatogram of chloroform and ethyl acetate fraction of IBF, M1, M2, M3, and M4 formulation were taken under daylight, at 254 and 366 nm before and after derivatization with 10 % methanolic sulphuric acid (fig. 6). The HPTLC fingerprint profile of chloroform fraction of IBF, M1, M2, M3 and M4 formulation after post derivatization revealed five spots each. Few spots were found common between the formulations; Rf 0.22 in M1, M2, and M3; Rf 0.32 in M1 and M3; Rf 0.23 in IBF and M4; Rf 0.41in IBF, M1, and M4; Rf 0.89 in IBF, M1, and M2. From this result, it was observed that spots with Rf values of 0.23, 0.41, and 0.89 in the IBF formulation were found in the marketed formulation, indicating the presence of these constituents in the marketed preparation. However, the Rf value of 0.09 and 0.49 did not notice in any marketed formulations. Similarly, the ethyl acetate fraction of IBF and M3 showed six spots each, M1 displayed four spots, and M2 and M4 revealed three. Spot with Rf 0.02 was found common in M1, M2, and M3; Rf 0.08 in M1 and M3; Rf 0.14 in IBF and M4; Rf 0.58 in IBF and M3. All marketed formulations except IBF were noticed with a common Rf value 0.19. Rf values 0.20, 0.33, 0.42 and 0.93 of IBF formulations did not found in marketed formulations.
Fig. 6: Photo image of developed HPTLC plate of chloroform fraction, (a) IBF; (b) M1; (c) M2; (d) M3; (e) M4 and ethyl acetate fraction of; (f) IBF; (g) M1; (h) M2; (i) M3 and (j) M4 balarista formulation before derivatization under daylight, 254 nm, 366 nm and; after derivatization under daylight and 366 nm Note: T: Track (T1: IBF, T2: M1, T3: M2, T4: M3, T5: M4)
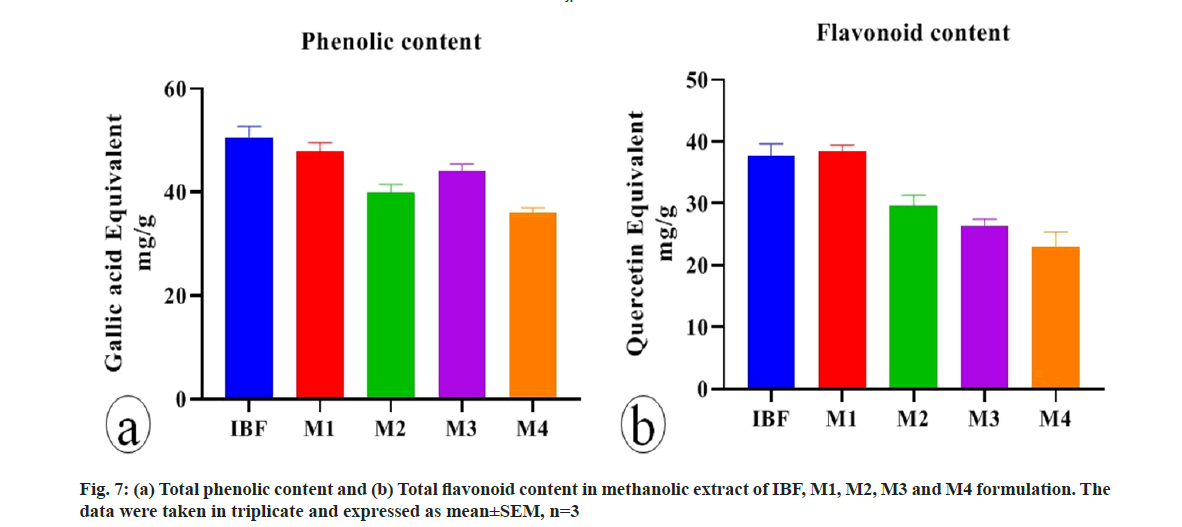
Phenolic compounds distributed in plants are given much importance due to their antioxidant and free radical scavenging properties[27]. This activity is believed to be mainly due to their redox property, which plays an important role in adsorbing and neutralizing the free radicals, quenching of singlet and triplet oxygen or decomposing the peroxide and act as reducing agent, hydrogen donators and also have metal chelating properties[28,29]. Flavonoids are the most important natural phenolic compounds, which possess a broad spectrum of chemical and biological activities, including free radical scavenging properties[30]. The total phenolic and flavonoid content of IBF, M1, M2, M3 and M4 was determined by UV spectroscopy (fig. 7). The, high phenolic content in IBF and flavonoid content in M1 might be responsible for its good antioxidant activity.
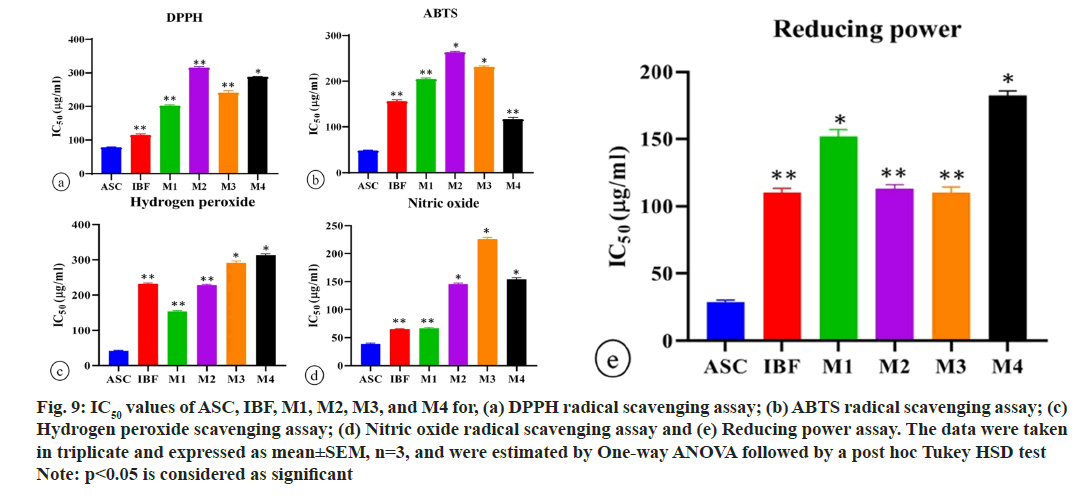
The percentages of DPPH, ABTS, H2O2, nitric oxide radical scavenging activity, and reducing power assay of ascorbic acid, IBF, M1, M2, M3, and M4 were recorded at higher concentration with corresponding IC50 values.
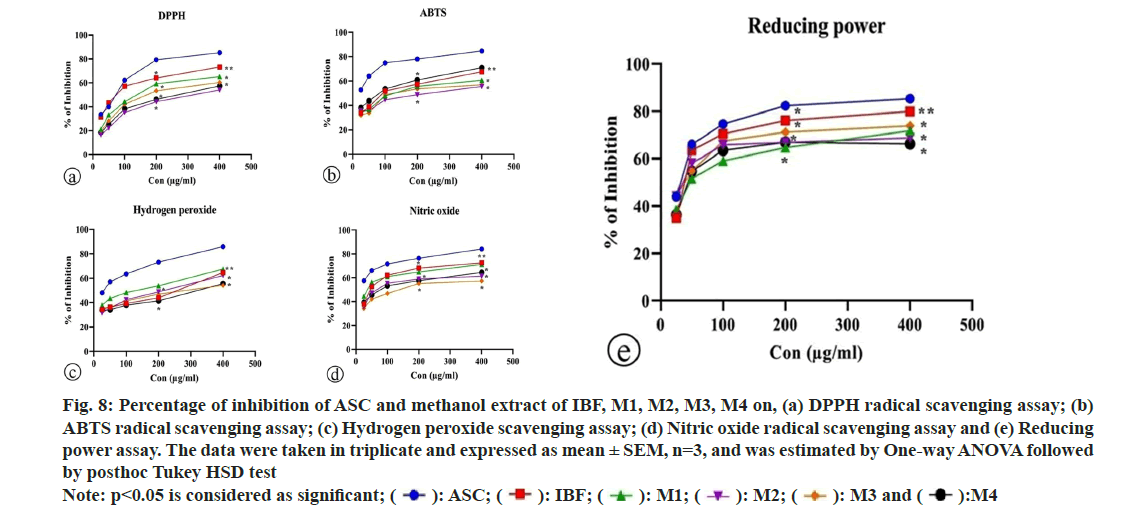
DPPH is a stable nitrogen-centered free radical. DPPH stabilizes as free radical molecules due to the delocalization of odd electrons throughout the molecules. This stabilized DPPH produces intense violet color in methanol solution. The antioxidant reacts with DPPH free radical solution and converts them into reduced form diphenyl picryl hydrazine either by donating hydrogen atom or transferring electron followed by proton. This oxidation reaction was accompanied by a loss of violet color, which can be measured quantitatively at 517 nm[31]. The percentages of DPPH radical scavenging activity of ascorbic acid, IBF, M1, M2, M3, and M4 were recorded at higher concentrations with corresponding IC50 values (fig. 8a and fig. 9a). The methanolic extract of the IBF and marketed formulations significantly scavenged DPPH radical in a concentrationdependent manner compared to standard ascorbic acid. Formulation IBF exhibited the highest DPPH radical scavenging activity, while M2 and M4 showed the least radical scavenging activity.
Fig. 8: Percentage of inhibition of ASC and methanol extract of IBF, M1, M2, M3, M4 on, (a) DPPH radical scavenging assay; (b)
ABTS radical scavenging assay; (c) Hydrogen peroxide scavenging assay; (d) Nitric oxide radical scavenging assay and (e) Reducing
power assay. The data were taken in triplicate and expressed as mean ± SEM, n=3, and was estimated by One-way ANOVA followed
by posthoc Tukey HSD test Note: p<0.05 is considered as significant; ( ): ASC; (
 ): IBF; (
 ): M1; (
 ): M2; (
 ): M3 and (
 ):M4
):M4
Fig. 9: IC50 values of ASC, IBF, M1, M2, M3, and M4 for, (a) DPPH radical scavenging assay; (b) ABTS radical scavenging assay; (c) Hydrogen peroxide scavenging assay; (d) Nitric oxide radical scavenging assay and (e) Reducing power assay. The data were taken in triplicate and expressed as mean±SEM, n=3, and were estimated by One-way ANOVA followed by a post hoc Tukey HSD test Note: p<0.05 is considered as significant
Proton radical scavenging is regarded as a characteristic of antioxidant activity. ABTS, a protonated radical, was generated during the incubation period through the reaction. The reduction of radical cation was indicated by the decolorization of ABTS radical, which was measured at 734 nm in a UV-visible spectrophotometer[32]. The capacity of methanolic extracts of the formulation for scavenging ABTS radical was examined by ABTS radical decolorization method and expressed as a percentage of ABTS radical scavenged. The ascorbic acid, IBF, M1, M2, M3, and M4 exhibited significant inhibition of ABTS free radicals at higher concentrations with corresponding IC50 values (fig. 8b and fig. 9b). The M4 formulation showed the highest ABTS radical scavenging activity, followed by IBF and M1, while M2 and M3 observed the most minor ABTS activity. The presence of a bioactive principle in the formulation might be inhibited the activity of potassium persulfate and thereby decrease the production of ABTS radical.
The ultraviolet radiation was absorbed by hydrogen peroxide at 230 nm. The decrease in hydrogen peroxide concentration in the reaction mixture was achieved by adding a scavenger, measured at 230 nm[33]. The percentages of H2O2 scavenging activity and IC50 values of ascorbic acid, IBF, M1, M2, M3, and M4 were depicted in fig. 8c and fig. 9c. In contrast to standard ascorbic acid, the methanolic extract of IBF and marketed formulation exhibited pronounced dose-dependent hydrogen peroxide scavenging activity from 25-400 μm. Hydrogen peroxide scavenging activity was best achieved by M1, followed by IBF and M2.
In an aqueous solution, nitrous oxide from sodium nitroprusside reacts with oxygen, forming stable nitrite and nitrate ion. The extract containing free radical scavenger competes with oxygen and decreases the concentration of nitrite ions. Further, the nitrite ion reacts with sulphanilamide of Griess reagent in aqueous solution and produces diazotized molecule, which was monitored at 546 nm[34]. The NO radical scavenging activity of ascorbic acid and IBF, M1, M2, M3, M4, and characteristic IC50 values are shown in fig. 8d and fig. 9d. Formulation IBF exhibited the highest percentage of inhibition among the formulations. All the formulations demonstrated significant NO radical scavenging activity in a concentration dependent manner compared to ascorbic acid.
The reducing power of antioxidants is associated with the presence of reductions which exert antioxidant activity by breaking the free radical chain by donating hydrogen atoms[35]. In this assay, the Fe3+/ferric cyanide was reduced to a complex ferrous form, and the appearance of a navy blue color was measured at 700 nm[36]. Fig. 8e and fig. 9e demonstrated the reducing power of the ascorbic acid, IBF, M1, M2, M3, and M4 at a concentration of 400 μg/ml and corresponding IC50. In this study, the M2 formulation exhibited the highest reducing power. However, all the formulations were observed with good reducing power in a concentration-dependent manner compared to ascorbic acid. Thus, they proved an excellent electron donor to scavenge the radical chain reaction.
From the above result, we can assume that the antioxidant activity of the IBF and marketed Balarista formulation may be attributed to the presence of an appreciable quantity of phenolic and flavonoid compounds and the free radical scavenging property of the Withania somnifera and Sida cordifolia. The presence of phenolics, flavonoids, alkaloids, saponins, steroids, glycosides, tannins, protein, and amino acids[37] in the root of Withania somnifera exhibited significant DPPH radical, hydrogen peroxide radical, reducing power[38], ABTS radical[39] and nitric oxide radical[40] scavenging property. The antioxidant activity of Withania somnifera due to its active principles, like withanolides, withaferin-A, alkaloids, and flavonoids, has been reported by Jovanovic et al.[41]. Besides this, sitoindosides VII-X, polyphenols, flavonoids, and vitamin C isolated from the root of W. somnifera also possess antioxidant property[42-44]. The root of Sida cordifolia exhibited DPPH radical, reducing power, nitric oxide radical, hydrogen peroxide radical[45], and ABTS radical[46] scavenging activities. The antioxidant activity of the Balarista can also be supported by the free radical scavenging property of Woodfordia fruticosa[47], Alpinia galanga[48], Elettaria cardamomum[49], Syzygium aromaticum[50], Ipomoea digitata[51], Paederia foetida[52], Ricinus communis[53], Tribulus terrestris[54], Vetiveria zizanioides[55].
In this study, the authors have described a comprehensive chemical analysis of different fractions of IBF and marketed Balarista formulation by FTIR fingerprint analysis and created a spectral library for quality control. The developed HPTLC profiling could also be used for quality control of formulation. As there was no information available on the aflatoxin content in API, the present data can be used as standard. Low bacterial count in IBF and M1 formulation indicates use of good quality raw materials. All the formulations were proven as good scavengers of free radicals.
Acknowledgments:
The authors are grateful to the Dean of the School of Pharmaceutical Sciences, Siksha ‘O’ Anusandhan Deemed to be University, for providing all facilities. Also, the authors are grateful to ANCHROM Enterprises P. Ltd, Mumbai, India, for conducting the HPTLC analysis.
Conflict of interest:
The authors declare that they have no conflict of interest.
References
- Viswanathan MV, Unnikrishnan PM, Komatsu K, Fushimi H, Basnet P. A brief introduction to ayurvedic system of medicine and some of its problems. Indian J Tradit Knowl2003;2:159-69.
- Singh H, Mishra SK, Pande M. Standardization of arjunarishta formulation by TLC method. Int J Pharm Sci Rev Res 2010;2(1):25-8.
- Somanathan AR, Sadanandan K, Damodaran NP. Standardisation of ayurvedic medicines-dasamulam kasayam. Anc Sci Life 1989;9(2):54-60.
[Google Scholar] [PubMed]
- Depciuch J, Kasprzyk I, Roga E, Parlinska-Wojtan M. Analysis of morphological and molecular composition changes in allergenic Artemisia vulgaris L. pollen under traffic pollution using SEM and FTIR spectroscopy. Environ Sci Pollut Res 2016;23(22):23203-14.
[Crossref] [Google Scholar] [PubMed]
- Upton R, David B, Gafner S, Glas S. Botanical ingredient identification and quality assessment: strengths and limitations of analytical techniques. Phytochem Rev 2019;19(5):1157-77.
- Frommenwiler DA, Kim J, Yook CS, Tran TTT, Canigueral S, Reich E. Comprehensive HPTLC fingerprinting for quality control of an herbal drug-the case of Angelica gigas root. Planta Med 2018;84(6-7):465-74.
[Crossref] [Google Scholar] [PubMed]
- Sekar S, Mariappan S. Traditionally fermented biomedicines, arishtas and asavas from ayurveda. Indian J Tradit Knowl 2008;7:548-56.
- Shenoy PKR, Yoganarasimhan SN. Evaluation of antibacterial activity of Elanir kujambu-an ayurvedic eye formulation. Indian J Tradit Knowl 2009;8(2):272-4.
- Das C, Bose A, Mallick S, Das D. Development of standardization parameters of crude drugs used in ayurvedic balarista formulation. Orient Pharm Exp Med 2019;19(4):455-67.
- The Ayurvedic Pharmacopoeia of India. New Delhi: Government of India, Ministry of Health and Family Welfare, Department of Indian system of Medicine and Homoeopathy; 2007.
- The Ayurvedic Formulary of India. 1st ed. New Delhi: Government of India, Ministry of Health and Family Welfare, Department of Ayurveda, Yoga & Naturopathy, Unani, Siddha and Homoeopathy; 2008:17.
- Harbone JB. Phytochemicals methods a guide to modern techniques of plant analysis. Springer Science Business Media 1998.
- Zou HB, Yang GS, Qin ZR, Jiang WQ, Du AQ, Aboul‐Enein HY. Progress in quality control of herbal medicine with IR fingerprint spectra. Anal Lett 2005;38(9):1457-75.
- Wolfe K, Wu X, Liu RH. Antioxidant activity of apple peels. J Agric Food Chem 2003;51:609-14.
- Meda A, Lamien CE, Romito M, Millogo J, Nacoulma OG. Determination of the total phenolic, flavonoid and proline contents in Burkina Fasan honey, as well as their radical scavenging activity. Food Chem 2005;91(3):571-7.
- Blois MS. Antioxidant determinations by the use of a stable free radical. Nature 1958;181(4617):1199-200.
- Dash P, Ghosh G. Proteolytic and antioxidant activity of protein fractions of seeds of Cucurbita moschata. Food Biosci 2017;18:1-8.
- Esmaeili MA, Sonboli A. Antioxidant, free radical scavenging activities of Salvia brachyantha and its protective effect against oxidative cardiac cell injury. Food Chem Toxicol 2010;48(3):846-53.
[Crossref] [Google Scholar] [PubMed]
- Ebrahimzadeh MA, Nabavi SF, Nabavi SM, Pourmorad F. Nitric oxide radical scavenging potential of some Elburz medicinal plants. Afr J Biotechnol 2010;9:5212-17.
- Kalaiselvan V, Shah AK, Patel FB, Shah CN, Kalaivani M, Rajasekaran M. Quality assessment of different marketed brands of dasamoolaristam, an ayurvedic formulation. Int J Ayurveda Res 2010;1(1):10-3.
[Crossref] [Google Scholar] [PubMed]
- Brera C, Miraglia M, Colatosti M. Evaluation of the impact of mycotoxins on human health: Sources of errors. Microchem J 1998;59(1):45-9.
- Rodriguez-Amaya DB, Sabino M. Mycotoxin research in Brazil: The last decade in review. Braz J Microbiol 2002;33(1):1-11.
- Ventura M, Gomez A, Anaya I, Diaz J, Broto F, Agut M, et al. Determination of aflatoxins B1, G1, B2 and G2 in medicinal herbs by liquid chromatography–tandem mass spectrometry. J Chromatogr A 2004;1048(1):25-9.
[Crossref] [Google Scholar] [PubMed]
- Chandra H, Kumari P, Yadav S. Evaluation of aflatoxin contamination in crude medicinal plants used for the preparation of herbal medicine. Orient Pharm Exp Med 2019;19(2):137-43.
- Jayasundar R. Ghatak S. Spectroscopic and E-tongue evaluation of medicinal plants: A taste of how rasa can be studied. J Ayurveda Integr Med 2016;7(4):191-7.
[Crossref] [Google Scholar] [PubMed]
- Zimermann B, Kohler A. Infrared spectroscopy of pollen identifies plant species and genus as well as environmental conditions. PLoS One 2014;9(4):e95417.
[Crossref] [Google Scholar] [PubMed]
- Li BB, Smith B, Hossain MM. Extraction of phenolics from citrus peels: I. Solvent extraction method. Sep Purif Technol 2006;48(2):182-8.
- Zheng W, Wang SY. Antioxidant activity and phenolic compounds in selected herbs. J Agric Food Chem 2001;49(11):5165-70.
[Crossref] [Google Scholar] [PubMed]
- Rice-evans CA, Miller NJ, Bolwell PG, Bramley PM, Pridham JB. The relative antioxidant activities of plant-derived polyphenolic flavonoids. Free Radic Res 1995;22(4):375-83.
[Crossref] [Google Scholar] [PubMed]
- Miliauskas G, Venskutonis PR, Van Beek TA. Screening of radical scavenging activity of some medicinal and aromatic plant extracts. Food Chem 2004;85(2):231-7.
- Niki E. Assessment of antioxidant capacity in vitro and in vivo. Free Radic Biol Med 2010;49(4):503-15.
[Crossref] [Google Scholar] [PubMed]
- Wolfenden BS, Willson RL. Radical-cations as reference chromogens in kinetic studies of ono-electron transfer reactions: Pulse radiolysis studies of 2, 2′-azinobis-(3-ethylbenzthiazoline-6-sulphonate). J Chem Soc 1982;7:805-12.
- Magalhaes LM, Segundo MA, Reis S, Lima JL. Methodological aspects about in vitro evaluation of antioxidant properties. Anal Chim Acta 2008;613(1):1-19.
[Crossref] [Google Scholar] [PubMed]
- Hazra B, Biswas S, Mandal N. Antioxidant and free radical scavenging activity of Spondias pinnata. BMC Complement Altern Med 2008;8(1):1-10.
[Crossref] [Google Scholar] [PubMed]
- Duan X, Wu G, Jiang Y. Evaluation of the antioxidant properties of litchi fruit phenolics in relation to pericarp browning prevention. Molecules 2007;12(4):759-71.
[Crossref] [Google Scholar] [PubMed]
- Gupta S, Prakash J. Studies on Indian green leafy vegetables for their antioxidant activity. Plant Food Hum Nutr 2009;64(1):39-45.
[Crossref] [Google Scholar] [PubMed]
- Akter J, Hasan SR, Hossain MM, Jamila M, Chowdhury M, Mazumder MEH, et al. Antidiarrhoeal and antioxidant properties of Curcuma alismatifolia leaves. Aust J Basic Appl Sci 2010;4(3):450-6.
- Kumar Paul R. in vitro antioxidant activity of Withania somnifera root. Int J Adv Res Chem Sci 2016;3(3):45-56.
- Kumar RS, Rajkapoor B, Perumal P. Antioxidant activities of Indigofera cassioides Rottl. Ex. DC, using various in vitro assay models. Asian Pac J Trop Biomed 2012;2(4):256-61.
[Crossref] [Google Scholar] [PubMed]
- Ramani R, Sudini S, Boddupalli BM, Anisetti RN. Antioxidant, free radical scavenging and in-vitro cytotoxic studies of ethanolic extract of Leucas indica var lavandulifolia and Leucas indica var nagalapuramiana. Asian Pac J Trop Biomed 2012;2(3):S1637-42.
- Jovanovic SV, Simic MG. Antioxidants in nutrition. Ann N Y Acad Sci 2000;899(1):326-34.
[Crossref] [Google Scholar] [PubMed]
- Uddin Q, Samiulla L, Singh VK, Jamil SS. Phytochemical and pharmacological profile of Withania somnifera dunal: A review. J Appl Pharm Sci 2012;2(1):170-5.
- Kumar G, Srivastava A, Sharma SK, Rao TD, Gupta YK. Efficacy and safety evaluation of ayurvedic treatment (ashwagandha powder and sidh makardhwaj) in rheumatoid arthritis patients: A pilot prospective study. Indian J Med Res 2015;141(1):100-6.
[Crossref] [Google Scholar] [PubMed]
- Visavadiya NP, Narasimhacharya AV. Hypocholesteremic and antioxidant effects of Withania somnifera (dunal) in hypercholesteremic rats. Phytomedicine 2004;14(2-3):136-42.
[Crossref] [Google Scholar] [PubMed]
- Pawa RS, Jain A, Sharma P, Chaurasiya PK, Singour PK. in vitro studies on Sida cordifolia Linn for anthelmintic and antioxidant properties. Chin Med 2011;2(2):47-52.
- Auddy B, Ferreira M, Blasina F, Lafon L, Arredondo F, Dajas F, et al. Screening of antioxidant activity of three Indian medicinal plants, traditionally used for the management of neurodegenerative diseases. J Ethnopharmacol 2003;84(2-3):131-8.
[Crossref] [Google Scholar] [PubMed]
- Arya B, Al-Obaidi B, Karim RB, Taha H, Khan AK, Shahid N, et al. Extract of Woodfordia fruticosa flowers ameliorates hyperglycemia, oxidative stress and improves β-cell function in streptozotocin–nicotinamide induced diabetic rats. J Ethnopharmacol 2015;175:229-40.
[Crossref] [Google Scholar] [PubMed]
- Mahae N, Chaiseri S. Antioxidant activities and antioxidative components in extracts of Alpinia galanga (L.) Sw. J Nat Sci 2009;43(2):358-69.
- Khalaf NA, Shakya AK, Al-Othman A, El-Agbar Z, Farah H. Antioxidant activity of some common plants. Turk J Biol 2008;32(1):51-5.
- Lee KG, Shibamoto T. Antioxidant property of aroma extract isolated from clove buds [Syzygium aromaticum (L.) Merr. et Perry]. Food Chem 2001;74(4):443-8.
- Vasagam T, Muthu AK, Manavalan R. In-vitro antioxidant potential of tuberous root of methanolic extract of Ipomoea digitata (linn.). Int J Pharma Bio Sci 2010;1:1-5.
- Osman H, Rahim H, Isa NM, Bakhir NM. Antioxidant activity and phenolic content of Paederia foetida and Syzygium aqueum. Molecules 2009;14(3):970-8.
[Crossref] [Google Scholar] [PubMed]
- Iqbal J, Zaib S. Farooq S, Khan A, Bibi I, Suleman S. Antioxidant, antimicrobial, and free radical scavenging potential of aerial parts of Periploca aphylla and Ricinus communis. ISRN Pharmacol 2012;2012:563267.
[Crossref] [Google Scholar] [PubMed]
- Dakshayini PN, Mahaboob Basha P. Phytochemical screening and in vitro antioxidant potential of Tribulus terrestris fruit and Mesua ferrea flower extracts: A comparative study. Int J Pharm Pharm Sci 2018;10:70-5.
- Subhadradevi V, Asok kumar K, Umamaheswari M, Sivashanmugam AT, Sankaranand R. in vitro antioxidant activity of Vetiveria zizanioides root extract. Tanzan J Health Res 2010;12(2):138-43.
[Crossref] [Google Scholar] [PubMed]
