- *Corresponding Author:
- Sumanta Mondal
Department of Pharmaceutical Chemistry, GITAM School of Pharmacy, GITAM (Deemed to be University), Visakhapatnam 530016, Andhra Pradesh, India
E-mail: mondalresearch@gmail.com
| Date of Received | 15 November 2022 |
| Date of Revision | 19 February 2023 |
| Date of Acceptance | 13 June 2023 |
| Indian J Pharm Sci 2023;85(3):789-798 |
This is an open access article distributed under the terms of the Creative Commons Attribution-NonCommercial-ShareAlike 3.0 License, which allows others to remix, tweak, and build upon the work non-commercially, as long as the author is credited and the new creations are licensed under the identical terms
Abstract
The first KRAS inhibitor to receive Food and Drug Administration approval is sotorasib, which binds to the cysteine residue on KRASG12C to lock the protein inactive, preventing cell growth and encouraging apoptosis. To estimate sotorasib levels in pre-clinical or clinical studies, it is necessary to establish a reliable, sensitive, and precise bioanalytical technique. Recently, some studies demonstrated sotorasib by validated liquid chromatography-mass spectrometric methods. However, these methods can predominantly estimate plasma samples by using electrospray ionization in negative or positive mode, and the application of these methods has been complex. This study evaluated the critical quality parameters in method validation under the International Council for Harmonization and United States Food and Drug Administration guidelines, along with the stability-indicating studies using umbralisib as an internal standard, intending to develop a validated liquid chromatography-mass spectrometry method for measuring sotorasib. The analyte was extracted from the appropriate matrix using a simple protein precipitation method. Sotorasib levels were determined by utilizing positive and negative multiple reaction monitoring mode using an electrospray ionization source and mass spectrometry. An isocratic mobile phase consisting of methanol and ammonium acetate buffer pH 4.0 (50:50 v/v) was used in the chromatographic detection on a Waters symmetry C18 column (150×4.6 mm, 3.5 µm), with a flow rate of 1.0 ml/min. In a total run duration of 5.0 mins, sotorasib and umbralisib eluted at 2.969 and 2.043 mins, respectively. The correlation coefficient value of 0.999 indicates that the technique was linear for the 2.50-50.00 ng/ml concentration ranges. The accuracy, intraday precision and interday precision were measured at the lower limit of quantification, low-quality control, middle-quality control, and high-quality control levels. The percentage coefficient of variation values were 3.13, 0.46, 0.39, and 0.24 %, respectively. A stability-indicating, simple, economical, fast, rapid, and robust liquid chromatography-mass spectrometric method was developed to measure sotorasib, and validation studies were performed in human plasma.
Keywords
Sotorasib, umbralisib, liquid Chromatography with tandem mass spectrometry, method development, validation, stability studies
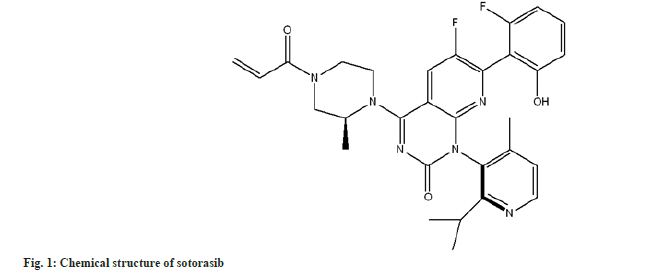
The Rat Sarcoma Virus (RAS) family of GTPases are molecular switches involved in various cell signalling pathways, such as Epidermal Growth Factor Receptor (EGFR)-related signalling[1]. KRAS mutations are detected in 23 % of patients with Non-Small Cell Lung Cancer (NSCLC), with the G12C mutation being the most common[2]. G12C-mutant KRAS is kept activated, which is associated with cancer. Sotorasib (fig. 1), a direct inhibitor of the enzyme Kirsten rat sarcoma viral oncogene (KRAS) with the G12C mutation, was approved in 2021 by the United States Food and Drug Administration (US FDA), as a second-line treatment for locally advanced or metastatic NSCLC containing the KRASG12C mutation, based on results of phase II clinical trial[3]. Sotorasib is indicated for treating adults with advanced, previously treated, KRASG12C mutation-positive NSCLC in multiple countries, including the European Union and United States. The most common adverse drug reactions were diarrhea (34 % of patients), nausea (25 %), and fatigue (21 %)[4].
The literature review on sotorasib reveals that only a few analytical approaches have been developed to quantify sotorasib. Yarlagadda et al.[5], developed a stability-indicating method by Reversed Phase-High Performance Liquid Chromatography (RP-HPLC). Retmana et al.[6] developed an Liquid chromatography with tandem Mass Spectrometric (LC-MS/MS) method using mouse plasma and tissue. Madhyastha et al.[7] quantifying the sotorasib from the mouse plasma by high performance liquid chromatography with tandem mass spectrometric method and pharmacokinetics study. A validated LC-MS/MS method was developed by using human plasma[8].
Based on the literature review survey, our aim is to develop a bioanalytical method for quantifying sotorasib by selecting proper internal standards. Based on the similar chemical properties and mass character, umbralisib is chosen as an internal standard for developing the study. The reported methods are estimating sotorasib in biological fluids based on the development and validation of pharmacokinetic and stability studies of sotorasib. No technique was reported till with a wide linearity range and short run time for quantifying sotorasib in human plasma using LC-MS/MS. The main objective of the present study is to develop and validate a sensitive and precise bioanalytical method for quantifying sotorasib in human plasma by using the LC-MS/MS technique and selecting an internal standard. Based on the similar chemical properties and mass character umbralisib is selected as an internal standard for developing the study. This proposed method covers a wide range of linearity, having good recovery, sensitivity, and short run times, along with stability studies per the International Council for Harmonisation (ICH)[9,10] and US FDA[11] guidelines.
Materials and Methods
Chemicals and reagents:
Sotorasib (purity >99 %, molecular weight=560.59 g/mol) and umbralisib (purity >99 %, molecular weight=571.5 g/mol) used as Internal Standard were obtained from the Biocon, Bangalore, India. From GlaxoSmithKline Pharmaceuticals Limited in Mumbai, India, LC-MS grade methanol was procured. Analytical grade ammonium acetate and acetic acid were obtained from Merck Limited, Mumbai, India.
Instrumentation:
The bioanalytical method was developed and validated using the Waters alliance e-2695 model HPLC instrument with an autosampler and degasser. The HPLC system was coupled to SCIEX QTRAP 5500 mass spectrometer equipped with an electrospray ionization interface. SCIEX software was used for the interpretation of the data of the chromatogram. The investigation employed a digital analytical balance (Mettler Toledo, India), an ultrasonic sonicator (Spectra Lab, India), and validated borosilicate glass pipettes, volumetric flasks, and beakers.
Preparation of standard solutions:
Separately, sotorasib and umbralisib active pharmaceutical ingredient were precisely weighed at 5 mg, transferred to a volumetric flask with a 10 ml capacity, and dissolved the drugs with acetonitrile. 0.1 ml of the sotorasib and umbralisib solutions was further diluted into 10 ml of acetonitrile. Add acetonitrile to a consequently 0.2 ml of this diluted solution up to 10 ml in a volumetric flask. Both standard solutions of sotorasib and umbralisib were kept in a refrigerator.
Extraction and sample processing protocol:
The analyte was extracted from the appropriate matrix using a simple protein precipitation method. Take 200 µl of plasma, add 500 µl of acetonitrile, and mix well. Further, add 300 µl of methanol to precipitate all the proteins and transfer them to a vortex cyclomixture. Furthermore, centrifuge the mixture at 4000 rpm for 15-20 mins. Collect the supernatant solution in an HPLC vial and inject it into the chromatograph. Retrieve the required number of plasma samples taken from the deep freezer, thaw them at room temperature, and vortex the tubes. Arrange the pre-labeled empty tubes per the batch sequence, and aliquot 200 µl of plasma, then add 300 µl of methanol; vortex for 15 mins. 500 µl each of standard and internal standard stock solutions are added. After 15 mins of vertexing, add 500 µl of acetonitrile. Vibromax the samples for 5 mins at 2500 rpm. Again, centrifuge the samples at 4000 rpm for 5 mins. Collect approximately 1.00 ml of supernatant solution for analysis.
Mobile phase preparation:
1.15 g of Ammonium acetate is dissolved in 1 l of HPLC-grade water and adjusted to pH-4.0 with acetic acid. Filtered through 0.45 µm filter paper. Mix methanol and ammonium acetate buffer at 50:50 v/v and filter.
LC-MS/MS conditions:
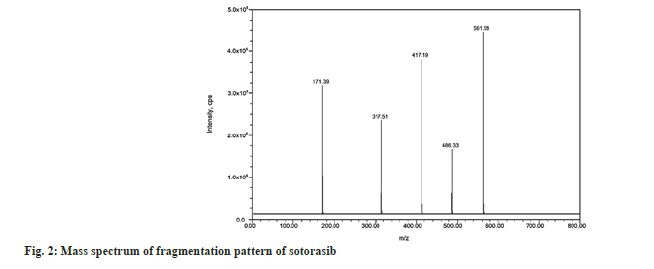
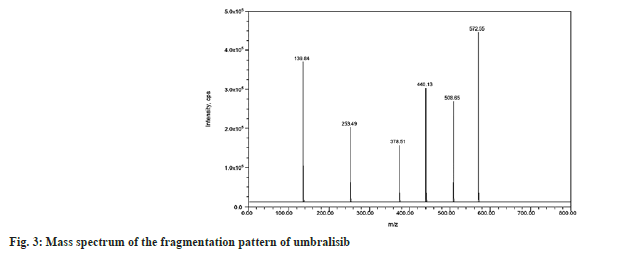
The injection was applied on a Waters symmetry C18, 150 mm×4.6 mm, 3.5 µm column, and prefilter (2.1 mm, 0.2 µm, Waters). The column and autosampler were maintained at an ambient temperature during the analytical runtime. The isocratic mode elution was performed at 1.0 ml/min with the mobile phase of methanol and ammonium acetate of pH 4.0 in a ratio of 50:50 v/v. Quantitation was performed using the Multiple Reaction Monitoring (MRM) modes to monitor protonated precursor to product ion transition of m/z 561.58 → 417.19 amu and 572.55 → 139.84 amu for sotorasib and umbralisib respectively. The individual mass parameters are listed in Table 1. Nitrogen 99.999 % was used as the collision gas. The source-dependent parameters maintained for the analyte, and internal standard were GS1: 50.00 psi, GS2: 50.00 psi, internal standard voltage: 5500.00 V, Turbo Heater Temperature (TEM): 550.00°, Collision Activation Dissociation (CAD): 7.00 psi, Curtain gas (CUR): 20.00 psi. The compound-dependent parameters like Decluttering Potential (DP) were optimized at 40.00 V, Collision Energy (CE) was 15.00 V, Cell Exit Potential (CXP) was kept at 7.00 V, and Entrance Potential (EP) was 10.00 V. Fig. 2 and fig. 3 depict the specific observed mass spectrum character of sotorasib and umbralisib in the mentioned optimized conditions.
| MS/MS Parameters | Description |
|---|---|
| Mode | ESI Mode |
| Sotorasib | Q1 Mass: 561.58 (m/z) |
| Q3 Mass: 417.19 (m/z) | |
| Umbralisib | Q1 Mass: 572.55 (m/z) |
| Q3 Mass: 139.84 (m/z) |
Table 1: Mass Spectrometer Parameters.
Method validation:
The method validation study was performed according to Clinical and Laboratory Standards Institute (CLSI) C62-A: Liquid Chromatography-Mass Spectrometry Methods guidelines and the US FDA guidelines[11]. Linearity, precision, recovery, matrix effect, stability, carry-over, selectivity, and specificity parameters were evaluated in this study.
Preparation of calibration curve standards and quality control samples:
The calibration curve was generated by spiking appropriate amounts of working standard solution into the blank plasma to create a set of eight non-zero concentrations with values of 2.50, 6.25, 12.50, 18.75, 25.00, 31.25, 37.50 and 50.00 ng/ml. The quality control samples consisted of sotorasib concentrations of the Lower Limit Of Quantification Quality Control (LLOQQC) 2.5 ng/ml, Low-Quality Control (LQC) 12.50 ng/ml, Middle-Quality Control (MQC) 25.00 ng/ml and High-Quality Control (HQC) 37.50 ng/ml were prepared. After bulk spiking, 300 µl of spiked plasma samples were pipetted out in pre-labeled polypropylene tubes. The calibration curve standards and quality control samples were logged in ultra-low temperature deep freezer (temp range: −55° to − 75°) except 30 samples each of LQC and HQC, which were transferred for storage in cell frost deep freezer (temp range: −17° to −27°) for the generation of long?term stability at −22°±5°. These sample preparation procedures performed the following method validation studies as per requisite concentrations.
The matrix effect was determined by comparing the height-to-area ratio of six drug-free plasma samples for sotorasib. Experiments were conducted in triplicate with six different plasma lots and an acceptable precision of 15 % at MQC levels. The precision and accuracy were evaluated using quality control samples prepared at the LLOQ, LQC, MQC and HQC levels. Half of the percentage Coefficient of Variation (% CV) should be less than 15 %, and accuracy should be within 15 %, except for LLOQ, which should be 20 %. The recovery was performed by extracting the sotorasib and analysing six sample replicates at each internal control concentration. The recovery is then assessed by comparing the height areas of extracted and unextracted standards. Carryover study, the analyte retained by the chromatographic system during the matrix with an analyte concentration ULOQ and above the diluting of this sample with a blank matrix is referred to as carryover. Dilution integrity was carried out by spiking the matrix with an analyte concentration above the ULOQ and diluting this sample with a blank matrix.
Stability studies:
Exhaustive experiments were performed to assess the stability of sotorasib in stock solution and plasma samples under different conditions, simulating the conditions occurring during the analysis of study samples. All stability determinations should use a set of samples prepared from a freshly made stock solution of the analyte in the appropriate analyte-free, interference-free biological matrix. Sample stability studies in plasma were conducted using six replicates at the LQC, MQC, and HQC concentration levels. According to US FDA guidelines, the analyte was considered stable if the change was less than 15 %. The perfectness of spiked plasma stored at room temperature was evaluated for 24 h. The benchtop, short-term, autosampler, freeze-thaw, and wet extract stability were carried out to determine the stability of the proposed bioanalytical method. Three concentration levels (LQC, MQC, and HQC) were assessed for each test. The wet extract stability was specifically conducted at room temperature for 12 h and 18 h at 2-8°. The freeze-thaw stability was tested by comparing steadiness samples frozen at -31° and thawed three times to freshly spiked internal control samples. The concentrations obtained after 24 hrs. were compared to the initial concentration for short-term stability evaluation.
Results and Discussion
To optimize the most sensitive ionization mode for sotorasib and the internal standard (umbralisib), Electrospray Ionization (ESI) full scans were carried out both in positive and negative ion detection modes, and it was found that both the analyte and the internal standard showed a better response in positive ion mode. At m/z 561.58 and 572.55, respectively, sotorasib and umbralisib generated protonated [M+H]+ in positive ion mode. Fig. 2 depicts the sotorasib fragmentation pattern that has been proposed. Due to proton loss, the sotorasib parent ion peak at m/z 561.58 revealed fragment ions at m/z 486.33 and 417.19. The product ions at m/z 317.51 and 171.39 were created by the sequential loss of protons from m/z 486.33. Similarly, the loss of protons from the internal standard parent ion peak at m/z 572.55 and due to the continuous and sequential loss of protons showed fragments ions and product ions at m/z 508.65, 440.13, 378.51, 253.49 and 139.84 respectively (fig. 3). Sotorasib was quantified using the MRM reaction pair of the m/z 561.58 precursor ion (Q1) to the m/z 417.19 daughter ion (Q3) after the MS parameters were carefully optimized. The ideal option to be utilized as an internal standard is the deuterated analog of sotorasib. Because deuterated sotorasib was unavailable, we used a similar structurally and pKa value like a compound umbralisib chosen as an internal standard. This compound was the best for the current study based on chromatographic elution, ionization, reproducibility, and good extraction efficiency. For the quantitation of internal standard, the MRM reaction pair of m/z 572.55 precursor ion (Q1) to the m/z 139.84 daughter ion (Q3) was used for the developed and validated optimized method.
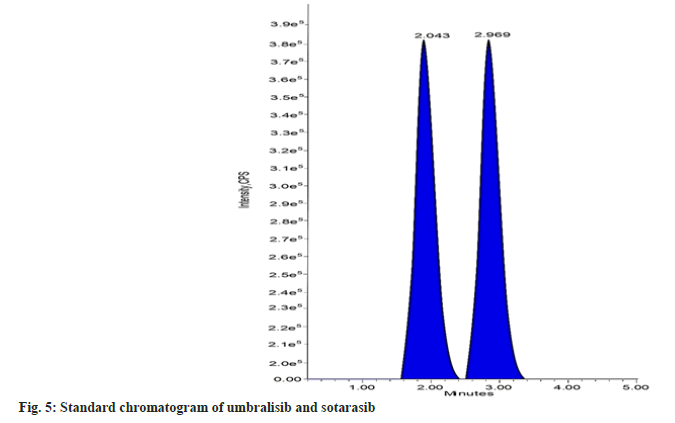
The mobile phase choice significantly impacts the internal standard, analyte separation, and ionization. To best achieve an effective chromatographic resolution of sotorasib and the internal standard umbralisib, a variety of mixtures of solvents, such as acetonitrile and methanol, with different buffers, such as formic acid, phosphate buffer, acetate buffer, ammonium acetate, and ammonium formate, were tested. To optimize the separation of sotorasib and umbralisib without any endogenous interference and to get a satisfactory and repeatable response with a short run time, many HPLC columns, including Inertsil, Atlantis, Zorbax, Gemini, C18, and C8 were investigated. The resolution of the analyte and the internal standard was best achieved with an isocratic mobile phase comprising methanol and ammonium acetate buffer (50:50 v/v) at a flow rate of 1.0 ml/min. Waters symmetry C18 column (150×4.6 mm, 3.5 µm) was found to be suitable with sharp and symmetric peak shapes. Sotorasib and umbralisib eluted at 2.969 and 2.043 mins, respectively, in a total run time of 5.0 mins.
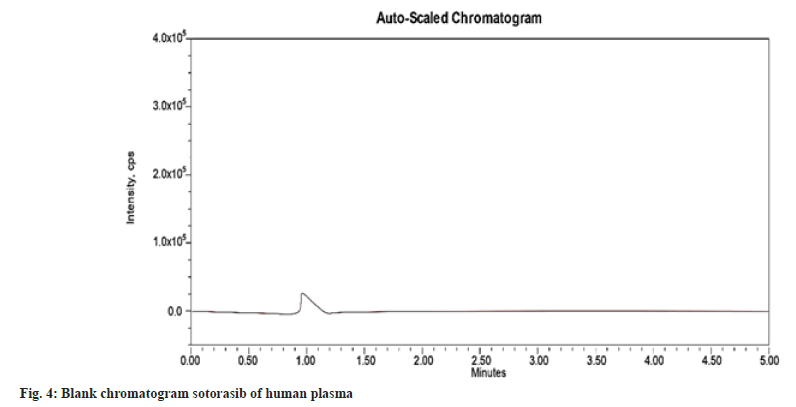
The selectivity or specificity of the present method was established by checking the blank plasma (without spiking with sotorasib and umbralisib) obtained from different blood donors. Fig. 4 and fig. 5 show the chromatograms of blank human plasma and standard. The chromatograms of blank plasma and standard showed no interference peaks.
The matrix effect, expressed as an internal standard normalized matrix factor, was assessed by comparing the mean area response of post–extraction spiked samples with the mean area of aqueous samples (neat samples) prepared in mobile phase solutions at LQC and HQC levels. The percent relative standard deviation within-signal ion suppression or enhancement was 1.0 percent for sotorasib LC-MS/MS, indicating that the matrix effect on analyte ionization is within an acceptable range of ionization under these conditions. Sotorasib LQC and HQC were 99.85 and 100.25 percent in the matrix effect, respectively. The CV of the sotorasib drug was 0.26 percent at the LQC level and 0.43 percent at the HQC level. It indicates that the matrix effect on analyte ionization is acceptable.
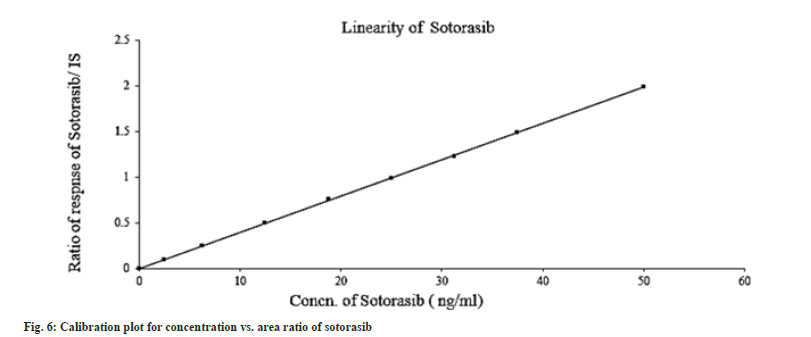
The linearity study was performed according to the US FDA and ICH protocols; the calibration curves were constructed using matrix-matched calibration standard solutions by plotting the peak area of the quantitative ion of each analyte versus concentrations. The standard curves of sotorasib were linear over the concentration range of 2.50-50.00 ng/ml (Table 2). The correlation coefficient, on average, was 0.999 (fig. 6). The ratio of the analyte peak area to internal standard peak area was used to quantify samples. Peak to plasma area ratios was plotted. Sotorasib linearity results and calibration plots are shown in Table 2 and fig. 6, respectively.
| Concentration (ng/ml) | Sotorasib Peak Response | Umbralisib Peak Response | Ratio |
|---|---|---|---|
| 0 | 0 | 0 | 0 |
| 2.5 | 0.392×10⁵ | 3.856×10⁵ | 0.102 |
| 6.25 | 0.936×10⁵ | 3.822×10⁵ | 0.245 |
| 12.5 | 1.927×10⁵ | 3.857×10⁵ | 0.500 |
| 18.75 | 2.934×10⁵ | 3.862×10⁵ | 0.760 |
| 25 | 3.852×10⁵ | 3.883×10⁵ | 0.992 |
| 31.25 | 4.761×10⁵ | 3.876×10⁵ | 1.228 |
| 37.5 | 5.689×10⁵ | 3.829×10⁵ | 1.486 |
| 50 | 7.584×10⁵ | 3.811×10⁵ | 1.990 |
| Slope | 0.0396 | ||
| Intercept | 0.00206 | ||
| R² Value | 0.99985 | ||
Table 2: Linearity results of Sotorasib.
Intra precision and accuracy of sotorasib were calculated at the LLOQ, LQC, MQC and HQC levels for the six replicates, each of the same analytical run. Inter precision and accuracy were calculated after the replicates in different analytical runs. Table 3 displays the precision and accuracy results for sotorasib. It was evident from the provided data that the strategy was precise and effective.
| Acquisition Batch ID | HQC | MQC | LQC | LLQC |
|---|---|---|---|---|
| Nominal Concentration (ng/ml) | ||||
| 37.5 | 25 | 12.5 | 2.5 | |
| Analyte peak area | ||||
| 5.674×10⁵ | 3.841×10⁵ | 1.916×10⁵ | 0.397×10⁵ | |
| 5.683×10⁵ | 3.839×10⁵ | 1.917×10⁵ | 0.386×10⁵ | |
| 5.688×10⁵ | 3.814×10⁵ | 1.923×10⁵ | 0.366×10⁵ | |
| 5.649×10⁵ | 3.856×10⁵ | 1.938×10⁵ | 0.396×10⁵ | |
| 5.675×10⁵ | 3.849×10⁵ | 1.919×10⁵ | 0.383×10⁵ | |
| 5.663×10⁵ | 3.827×10⁵ | 1.933×10⁵ | 0.371×10⁵ | |
| N | 6 | 6 | 6 | 6 |
| Mean | 5.672×10⁵ | 3.837×10⁵ | 1.924×10⁵ | 0.383×10⁵ |
| SD | 0.014 | 0.015 | 0.009 | 0.012 |
| % CV | 0.24 | 0.39 | 0.46 | 3.13 |
| % Mean accuracy | 99.70 % | 99.62 % | 99.85 % | 97.74 % |
Table 3: Precision and Accuracy results of Sotorasib.
A ruggedness study was conducted in HQC, LQC, MQC and LLQC samples; the percentage recovery and CV of sotorasib, as measured by two separate analysers and on two additional columns, met acceptable standards. Results demonstrated that the approach is robust. The percent recoveries ranged from 97.15 to 100.47 % for sotorasib. The % CV values ranged from 0.28 to 2.14 % for sotorasib. The results proved method is ruggedness.
The autosampler carryover study was developed after the peak area response to sotorasib was not observed in samples of blank rat plasma after injections of LLQC and ULQC at sotorasib retention durations. As a result, autosampler carryover does not affect this method.
Stability studies:
Analyte stability at various conditions was evaluated. Exhaustive experiments were performed to assess the stability of sotorasib in stock solution and plasma samples under different conditions, simulating the conditions occurring during the analysis of study samples. Benchtop stability, autosampler stability, freeze-thaw stability at -31°, short-term stability (24 h), and wet extract stability study at 12 h and 18 h at 2-8° were performed. Table 4 represents the data obtained from the mentioned various stability studies. The stability study results were within acceptable limits in the different conditions as per the ICH[9,10] and US FDA[11] guidelines.
| Stability Experiment Spiked Plasma | Concentration | % CV | Mean accuracy |
|---|---|---|---|
| Bench top Stability | LOQ-12.5 | 1.48 | 99.40 |
| MQC-25.0 | 0.25 | 100.42 | |
| HQC-37.5 | 0.93 | 98.99 | |
| Auto sampler stability | LOQ-12.5 | 1.34 | 97.46 |
| MQC-25.0 | 0.78 | 97.75 | |
| HQC-37.5 | 0.16 | 99.29 | |
| Freeze-Thaw stability | LOQ-12.5 | 1.40 | 98.13 |
| MQC-25.0 | 0.38 | 101.0 | |
| HQC-37.5 | 0.57 | 99.38 | |
| Short term stability | LOQ-12.5 | 0.81 | 96.76 |
| MQC-25.0 | 0.02 | 98.19 | |
| HQC-37.5 | 0.05 | 95.07 | |
| Wet extract 12 h | LOQ-12.5 | 1.20 | 98.52 |
| MQC-25.0 | 0.68 | 98.94 | |
| HQC-37.5 | 0.45 | 97.31 | |
| Wet extract 18 h | LOQ-30.0 | 1.26 | 97.57 |
| MQC-60.0 | 0.48 | 98.97 | |
| HQC-90.0 | 0.58 | 95.77 |
Table 4: Stability studies of Sotorasib.
The literature study ended with discovering limited LC-MS/MS methods for determining sotorasib[5-8]. First-in-class oral active G12C-mutant KRAS inhibitor, sotorasib. Sotorasib blocks downstream signalling pathways connected to cell growth and differentiation by permanently binding to KRASG12C. Patients with metastatic or locally advanced NSCLC who have had at least one prior therapy and whose tumors have an aberrant KRASG12C gene are treated with sotorasib[12]. The reported developed validated LC-MS/MS methods are quantifying the sotorasib using high concentration levels of sotorasib, which may drop significantly the eco-friendly method development protocols and caused less toxicity[13]. This method uses less toxic solvents and less solvent consumption. Overall extraction is conducted, followed by a systematic pathway and bioanalytical methods development as per the ICH[9,10] and US FDA[11] guidelines. In this developed current study, the solvent used for extraction to the extraction procedure is entirely novel and new. Each parameter is well evaluated in the method validation, and all data mentioned are within acceptable limits[14]. The linearity study, at a low level of quantification to a high level of qualification with excellent correlation coefficient value, indicates the efficacy of the proposed method. By slight chance, the parameters like mobile phase, flow rate, and others are not affected by the quantification of sotorasib from the biological matrix and used of human plasma for developed the proposed method and properly validated each parameter with the extracted sotorasib and internal standard umbralisib sample from the human plasma are help to get the novelty of proposed method and serves to supplement pivotal studies and aid in the decision-making process for approval, safety, labelling of a drug or biologic and, choice of the biomarker in biological fluids[15]. As an internal standard umbralisib was used to develop the proposed method, which is entirely new as compared to others, and the mass spectrum and separation of both the drugs umbralisib and sotorasib are completely clearly observed in mentioned figures, the overall presentation of the developed method can be successfully able to quantify sotorasib without any interference effect.
In conclusion, the developed research was easy, inexpensive, robust, and sensitive for estimating sotorasib in LC-MS/MS using umbralisib as the internal standard. Sotorasib and umbralisib have retention times of 2.969 and 2.043 mins, respectively, while the chromatographic runtime is 5 mins. The method is validated for sotorasib over a dynamic linear range of 2.50-50.00 ng/ml, with a correlation coefficient of 0.999. The % CV of intra-batch and inter-batch precision is 0.24 to 3.13 percent at five different levels (LLOQ, LQC, MQC, HQC, and ULOQ). According to ICH and US FDA guidelines, the method was validated. The technique showed neither a matrix effect nor any significant extraction loss. Lastly, this method successfully supported the quantification of sotorasib from the different biological matrices or fluids.
Acknowledgements:
The authors are thankful to the Principal and Management of GITAM School of Pharmacy, GITAM Deemed to be University, Visakhapatnam (AP), India, for providing the required facilities to carry out this research work and also thankful to Biocon Pvt. Ltd., Bangalore, India, for providing the active pharmaceutical ingredient of sotorasib and umbralisib.
Funding:
The authors declare that they have no funding support for this study.
Conflict of interests:
The authors declare that there is no conflict of interest.
References
- Lee A. Sotorasib: A Review in KRASG12C mutation-positive non-small cell lung cancer. Target Oncol 2022;17(6):727-33.
[Crossref] [Google Scholar] [PubMed]
- Zheng X, Luo J, Liu W, Ashby Jr CR, Chen ZS, Lin L. Sotorasib: A treatment for non-small cell lung cancer with the KRASG12C mutation. Drugs Today 2022;58(4):175-85.
[Crossref] [Google Scholar] [PubMed]
- Blair HA. Sotorasib: First approval. Drugs 2021;81(13):1573-9.
[Crossref] [Google Scholar] [PubMed]
- Zhang SS, Nagasaka M. Spotlight on sotorasib (AMG 510) for KRASG12C positive non-small cell lung cancer. Lung Cancer 2021:115-22.
[Crossref] [Google Scholar] [PubMed]
- Yarlagadda S, Mannam S, Jampani B. Stability indicating and cost-effective analytical method development and validation of sotorasib by using RP-HPLC. Int J Appl Pharm 2021:154-9.
- Retmana IA, Loos NH, Schinkel AH, Beijnen JH, Sparidans RW. Quantification of KRAS inhibitor sotorasib in mouse plasma and tissue homogenates using liquid chromatography-tandem mass spectrometry. J Chromatogr B 2021;1174:122718.
[Crossref] [Google Scholar] [PubMed]
- Madhyastha N, Samantha SK, Dittakavi S, Markose M, Mallurwar SR, Zainuddin M, et al. Validated HPLC?MS/MS method for quantitation of AMG 510, a KRASG12C inhibitor, in mouse plasma and its application to a pharmacokinetic study in mice. Biomed Chromatogr 2021;35(4):e5043.
[Crossref] [Google Scholar] [PubMed]
- Wong P, Akrami A, Houk B, Vuu I, James CA. Validation of an LC–MS/MS method for the determination of sotorasib, a KRASG12C inhibitor, in human plasma. Bioanalysis 2022;14(19):1281-92.
[Crossref] [Google Scholar] [PubMed]
- Guideline IH. Validation of analytical procedures: Methodology. In: International Conference on Harmonization 2005.
- ICH HT. Text on Validation of Analytical Procedures. In: International Conference on Harmonization, Geneva 2006.
- United States pharmacopoeia. Vol. 42. US pharmacopoeia; 2019;NF-37.
- Olivier T, Haslam A, Prasad V. Sotorasib in KRASG12C mutated lung cancer: Can we rule out cracking KRAS led to worse overall survival? Transl Oncol 2023;28:101591.
[Crossref] [Google Scholar] [PubMed]
- Chakraborty S, Mondal S. A green eco-friendly analytical method development, validation, and stress degradation studies of favipiravir in bulk and different tablet dosages form by UV-spectrophotometric and RP-HPLC methods with their comparison by using ANOVA and in-vitro dissolution studies. Int J Pharm Invest 2023;13(2):1-6.
- Ramakrishna B, Mondal S, Mondal P. Quantification of palbociclib in spiked human plasma using liquid chromatography-electro spray ionization-tandem mass spectrophotometry-an application to pharmacokinetic study. J Young Pharm 2022;14(1):82-8.
- Chakraborty S, Mondal S. A systematic and concise review on the development of analytical and bioanalytical methods for the simultaneous estimation of abacavir sulfate and lamivudine. YMER 2022;21(12):912-35.
