- *Corresponding Author:
- Raghavendra Shetty
Ecron Acunova Limited,
Export Promotion Industrial Park (EPIP),
Hajipur,
Bihar 844102,
India
E-mail: chiragvets@yahoo.co.in
| Date of Received | 25 August 2020 |
| Date of Revision | 21 August 2021 |
| Date of Acceptance | 24 March 2022 |
| Indian J Pharm Sci 2022;84(2):380-389 |
This is an open access article distributed under the terms of the Creative Commons Attribution-NonCommercial-ShareAlike 3.0 License, which allows others to remix, tweak, and build upon the work non-commercially, as long as the author is credited and the new creations are licensed under the identical terms
Abstract
Escitalopram is a widely used antidepressant and antianxiety agent in clinical setup. This study was aimed at developing and validating a very sensitive and specific bioanalytical method for the estimation of escitalopram in rat plasma using liquid chromatography coupled with tandem mass spectrometry as per the current United States Food and Drug Administration (May 2018) guideline. The mass spectrometer was operated in heated electrospray ionization mode with positive ion detection. The compounds were tuned and monitored by selected reaction monitoring scan mode. Imipramine hydrochloride was used as an internal standard. The extraction technique used to extract the analyte from the biological matrix was a liquidliquid extraction technique. The chromatographic separation was done by using methanol:ammonium formate (2 mM, pH 3.00) (90:10 %v/v) as mobile phase with the flow rate of 0.500 ml/min with a run time of 2.10 min. Detection and quantification were performed under selective reaction monitoring using heated electron spray ionization mode. The mass transition monitored for escitalopram was 325.200 m/z (fragments 108.98 and 262.00 m/z) and for internal standard imipramine 281.200 m/z (fragments 58.20 and 86.19 m/z). This method demonstrated acceptable performance and was successfully applied for the estimation of escitalopram in rat plasma at 0.050 to 39.708 ng/ml range.
Keywords
Escitalopram, imipramine, heated electrospray ionization, selected reaction monitoring, mass transition
Escitalopram is a widely prescribed drug for the treatment of depression. Chemically it is known as S-(+)- 1-[3-(dimethylamino)propyl]-1-(p-fluorophenyl)-1,3- dihydroisobenzofuran-5-carbonitrile. Escitalopram belongs to the category of Selective Serotonin Reuptake Inhibitors (SSRI). SSRIs are considered as the first choice for the treatment of depression and among SSRIs, escitalopram is prescribed the most. It is being sold by the name Lexapro in the market. It is available in two racemic forms internal is R-Citalopram and second is S-Citalopram also called escitalopram and plays a major role in the treatment of depression[1].
Escitalopram is extensively used in the treatment of depression and anxiety. It is reported as a serotonin reuptake inhibitor which is highly selective with a minimal effect on the reuptake of norepinephrine and dopamine in various in vitro and in vivo studies. Escitalopram shows linear dose-proportional pharmacokinetics at 10-30 mg/d orally (p.o.)[2] in single and multiple doses in humans. The single oral dose of 20 mg/d escitalopram in human shows the peak plasma concentrations (Cmax) at around 4 h[3]. Escitalopram is mainly metabolized in the liver. The primary isozyme responsible for the metabolism of escitalopram are two Cytochrome P450 (CYP) enzymes CYP 3A4 and CYP 2C19 and to a lesser extent by CYP2D6. These isozymes metabolize escitalopram by N-demethylation. The reported plasma protein binding was around 56 % and the mean half-life (t½) of escitalopram was around 27-33 h[2].
The literature survey for the estimation of escitalopram reveals several methods in different biological matrices. Pistos et al.[4] reported an Liquid Chromatography- Mass Spectrometry (LC-MS) method, which had a long run time of 10 min with 0.5 ng/ml of the Lower Limit of Quantification (LLOQ). Later Singh et al.[5] developed a method by using Liquid Chromatography with Tandem Mass Spectrometry (LC-MS/MS) where the LLOQ level achieved was of 1 ng/ml. After that Sauvage et al.[6] validated and reported a method for the quantification of escitalopram along with 12 additional antidepressants and his method was sensitive to estimate up to the level of 10 ng/ml LLOQ by using human serum in the volume of 100 μl. A method developed and validated by Rocha et al. in 2007 in rat and human plasma by using 1 ml plasma and obtained LLOQ of 0.1 ng/ml[7], de Castro et al. developed and validated a method in human saliva and plasma for simultaneous estimation of escitalopram together with eight different other antidepressants with a quantification limit of 2 ng/ml by using 200 μl plasma/saliva[8]. Though the reported methods appeared sensitive, some of these methods involved lengthy extraction procedure, some had long run time and others used more plasma volume. Although the reported methods having lowest sensitivity of 0.1 ng/ml by using plasma volume of 1.000 ml and 0.5 ng/ml with 50 μl plasma volume with 3 min of run time, there is a requirement of lowering the LLOQ with limited plasma volume for animal pharmacokinetic study. Considering this need present study was designed to lower the LLOQ level and reduce the plasma volume. The method validation was done in alignment with the recent United States Food and Drug Administration (USFDA) guidelines released in May 2018[9].
Materials and Methods
Chemicals and reagents:
Escitalopram oxalate (99.00 % purity) was obtained from Cipla Ltd. Mumbai; Imipramine hydrochloride (99.98 % purity) was obtained from Vivan Life Sciences Pvt. Limited, Mumbai; methanol was obtained from RCI labscan of supergradient grade, water and ammonium formate used were of High Performance Liquid Chromatography (HPLC) grade where water was procured from Merck, India and ammonium formate was procured from HiMedia, India. Tertiary butyl methyl ether and dichloromethane of supergradient grade were procured from RCI labscan, Thailand.
Instrumentation:
The chromatographic separation and MS internal detection by LC-MS/MS equipped with LC of Shimadzu prominence and MS of Thermo TSQ Quantum discovery max. Sartorius (SE2) microbalance from Sartorius Mechatronics, Germany was used for the weighing of working standards for the preparation of main stock and spiking stocks. Sartorius (CP225D) analytical balance was used for the weighing of chemicals. Thermo Electron Corporation, United States of America (USA) deep freezer was used for the storage of plasma samples.
LC and MS conditions:
The analytical column used for chromatographic separation of analytes and internal standard as stationary phase for was of Hypurity Reverse Phase (RP18), 150×4.6 mm, 5 μ from Thermo Scientific, which was maintained at a consistent temperature of 40°. The mobile phase used for the separation of the analyte and internal standard consisted of methanol: 5 mM ammonium formate with pH 3.00 under isocratic elution in a ratio of 90:10 % v/v. The flow rate was set at 0.500 ml/min and the autosampler temperature was maintained at 5°. The ionization mode for quantitation of analyte and internal standard was positive ion mode and the ionization source was Heated Electron Spray Ionization (HESI). The parameters set for ionization namely spray voltage, sheath gas pressure, auxiliary gas pressure and capillary temperature were 2000, 40 (Arb), 20 (Arb) and 350° respectively. The run time used was 2.10 min in this method. Selected Reaction Monitoring (SRM) mode was applied for the detection of the ions and monitoring the transition of m/z 325.200 precursor ions to the m/z 108.98 and 262.00 product ion for escitalopram and m/z 281.200 precursor ions to the m/z 86.190 and 58.200 product ion for imipramine. The application software used for analytical data processing was Xcalibur version 2.0.7 and LC Quan version 2.5.6.
Calibration Standards (CSs) and samples of Quality Control (QCs) preparation:
CSs and QCs of escitalopram were prepared from the respective spiking stock solutions. The concentration of the analyte and internal standard of main stock solution was 0.1000 mg/ml, prepared in methanol. The intermediate stock solution of escitalopram and imipramine were prepared in the diluent of methanol and water in the ratio of 50:50 % v/v. After that, spiking stocks from standard 1 to standard 9 were prepared to achieve a plasma concentration of 0.050 to 39.708 ng/ ml. The four different concentration levels of QCs were prepared namely, LLOQ, Low-QC (LQC), Medium- QC (MQC) and High-QC (HQC). The concentration of internal standard working solution was 0.050 μg/ml.
Sample preparation:
In the bioanalysis, analyte and internal standard extraction from the biological matrix is a crucial step to ensure very consistent and reproducible results. The final extraction procedure for escitalopram and imipramine was as follows.
0.050 ml of the sample was transferred into a microcentrifuge tube and 0.005 ml of the internal standard working solution was added and was vortexed to mix. To this 0.200 ml of 50 mM sodium bicarbonate was added and the sample was vortexed to mix well. After that 3.000 ml of extraction solution which was prepared by mixing tertiary butyl methyl ether:dichloromethane in 70:30 % v/v ratio and was added and vortexed to mix well in vibramax for 5 min at 2500 rpm.
The above plasma mixture was centrifuged for 5 min at 4500 rpm and 2.500 ml of the supernatant was separated. The supernatant was collected and evaporated for dryness in a stream of nitrogen at 40°. The dried sample was reconstituted with 300 μl of reconstitution solution (methanol:water in the ratio of 90 and 10 respectively). 10.0 μl of this sample was injected for estimation.
Results and Discussion
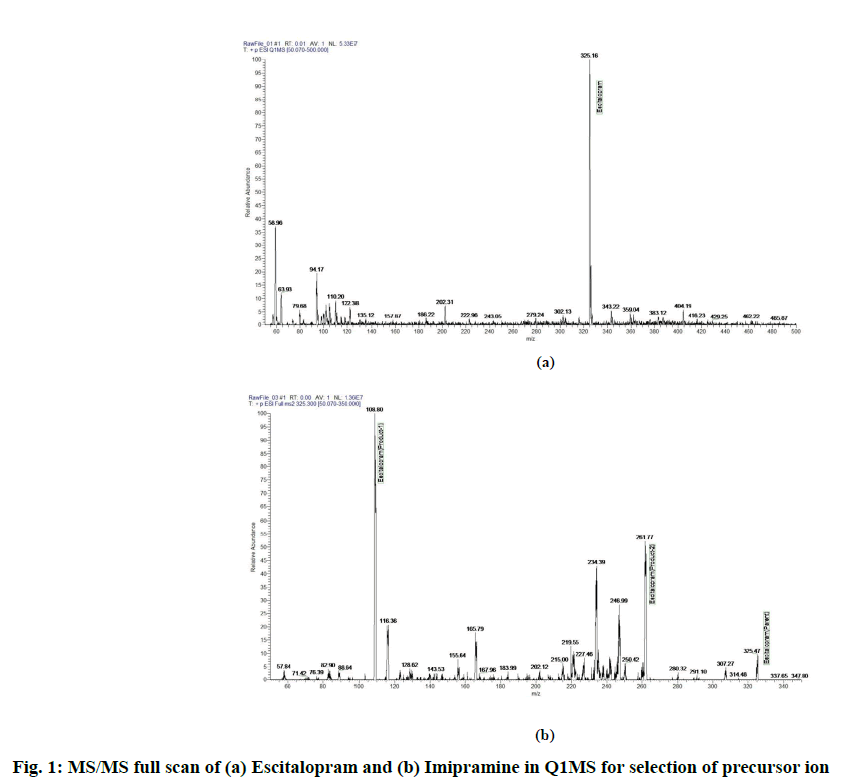
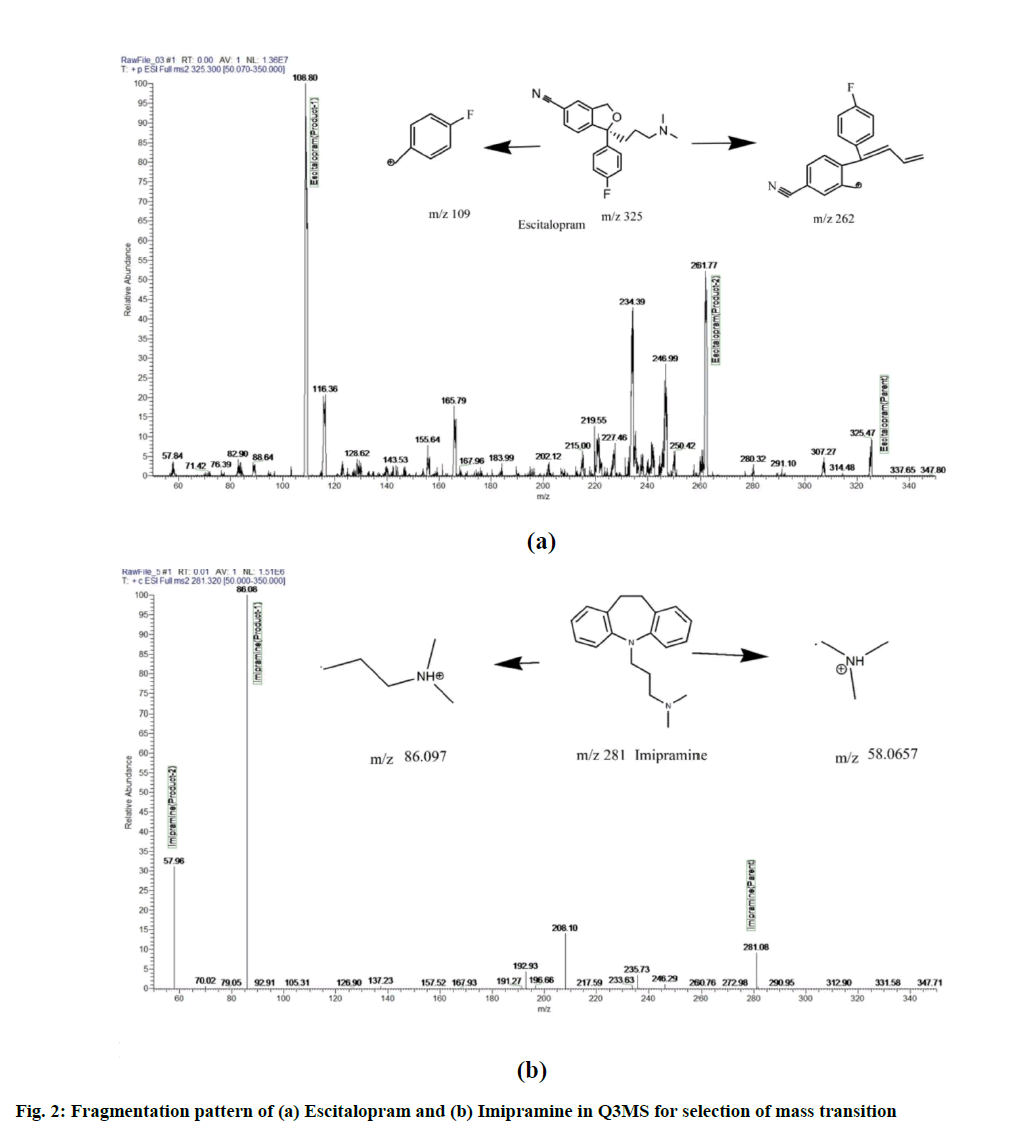
LC-MS/MS method development is as follows. Various methods by using LC-MS/MS detection for the estimation of escitalopram in plasma have been reported. In the current method, escitalopram was estimated by using HESI mode. Escitalopram and imipramine are basic in nature with ionization constant of 9.7 and 9.4 respectively. Ionization was tried in full scan mode with positive polarity. The (M+1) precursor ions obtained were 325.6 m/z and 281.32 m/z for escitalopram and imipramine respectively. The full scan spectrum of precursor ion for escitalopram and imipramine are presented in fig. 1. Upon identifying the (M+1) precursor ion, MS/MS scanning was performed to identify the stable product ion. The most stable and consistent product ions in the Q3 mass spectra were found at m/z 108.98 and 262.00 for escitalopram and at m/z 86.19 and 58.20 for imipramine as shown in fig. 2. After identifying, the stable fragment ion further scanning was performed in SRM mode to obtain the optimum voltage, collision energy, spray voltage and other detector parameters.
After finalizing the mass transition with detector parameters, the chromatographic conditions were optimized to obtain adequate retention, consistent and stable response and reproducible peak shape. The type of buffer, its strength, pH, strength of organic solvent and ratio of buffer to organic solvent in mobile phase had significant role in the chromatography specific to peak shape, resolution, retention and reproducibility for both analyte and internal standard. The mobile phase ratio was optimized by using columns of different chemistry namely BetaBasic-8 100×4.6 mm, 5 μm dimension, SummeryShieldTM RP8, 3.5×100 A°, symmetry shield RP18 5 μ 4.6 mm, Gemini C18 4.6×100 mm, Betabasic C18 4.6×100 mm and Hypurity RP18, 150×4.6 mm, 5 μ. Among the tried columns Hypurity RP18, 150×4.6 mm, 5 μ was finalized with the mobile phase of methanol and 2 mM ammonium formate pH-3.0 (90:10 % v/v) which gave good peak and consistent response. In bioanalysis, extraction of drug from biological matrix is very crucial step as the presence of endogenous components and drug related metabolites in matrix may interfere in the analysis of the analyte of interest. Considering the log p-values of both the analyte and internal standard are 3.5 and 4.8, the extraction solvent was selected as combination of tertiary butyl methyl ether and dichloromethane in the ratio of 70:30 % v/v as this combination have polarity near to 4.8 so that both analyte and internal standard can easily partition into organic layer. Additionally, sample pre-treatment was done with basic buffer (50 mM sodium bicarbonate) to prevent the analyte and internal standard from getting dissociated while extraction.
The current method developed and validated is simple, rapid, economic and of highest sensitivity as compared to other reported methods in terms of minimal plasma usage with LLOQ of 0.050 ng/ml. Method validation is as follows.
Six aqueous replicate injections of system suitability solution were injected to check the performance before the beginning of every new sequence. The percentage Coefficient of Variation (% CV) for the peak response area of escitalopram and imipramine were ≤3.11 and ≤3.07 respectively. The % CV for the retention time of escitalopram and imipramine were 0.00 and ≤0.30 respectively.
Carryover experiment was conducted to confirm if there is any significant carryover of the analyte and internal standard from the previous injection. The experiment was performed at the Upper Limit of Quantification (ULOQ) level.
One blank solution, one blank sample, one extracted ULOQ and three extracted LLOQ samples were prepared. Sample carryover check was assessed by injecting blank solution, blank sample, extracted ULOQ sample twice followed by the blank sample again and further followed by extracted ULOQ sample twice followed by the blank sample. The blank sample response was compared with the average response of three LLOQ samples. Percentage of carryover in the blank sample after respective ULOQ injection was calculated. No carryover was observed in the blank sample for escitalopram and imipramine.
12 lots from different source of rat Dipotassium Ethylenediaminetetraacetic Acid (K2EDTA) plasma which included lipemic and hemolytic were procured and analysed to find out the degree of contribution of endogenous components to assess the interference in the chromatography of analyte or internal standard. The experiment was performed with freshly prepared standards and QCs and there was no significant interference at the retention time of analyte and internal standard.
Specificity was performed for escitalopram to determine the extent of cross-interference from internal standard and same was done for imipramine. Blank sample and extracted LLOQ sample was prepared, analyzed and the response in blank was evaluated against the calculated concentration of LLOQ response of analyte and response of internal standard. There was no significant response found at the retention time of analyte and internal standard.
The sensitivity was determined at LLOQ of escitalopram, which was 0.050 ng/ml. Six LLOQ samples were prepared and were submitted along with the linearity samples in four different batches. Percentage deviation from the actual concentration, percentage coefficient of variation and signal to noise ratio were evaluated for conformity to acceptance criteria. The % CV obtained in the experiments were between 2.47 to 14.29 and mean percentage nominal concentration was in the range of 98.00 % to 106.10 %. Signal to noise ratio for escitalopram was greater than 52.
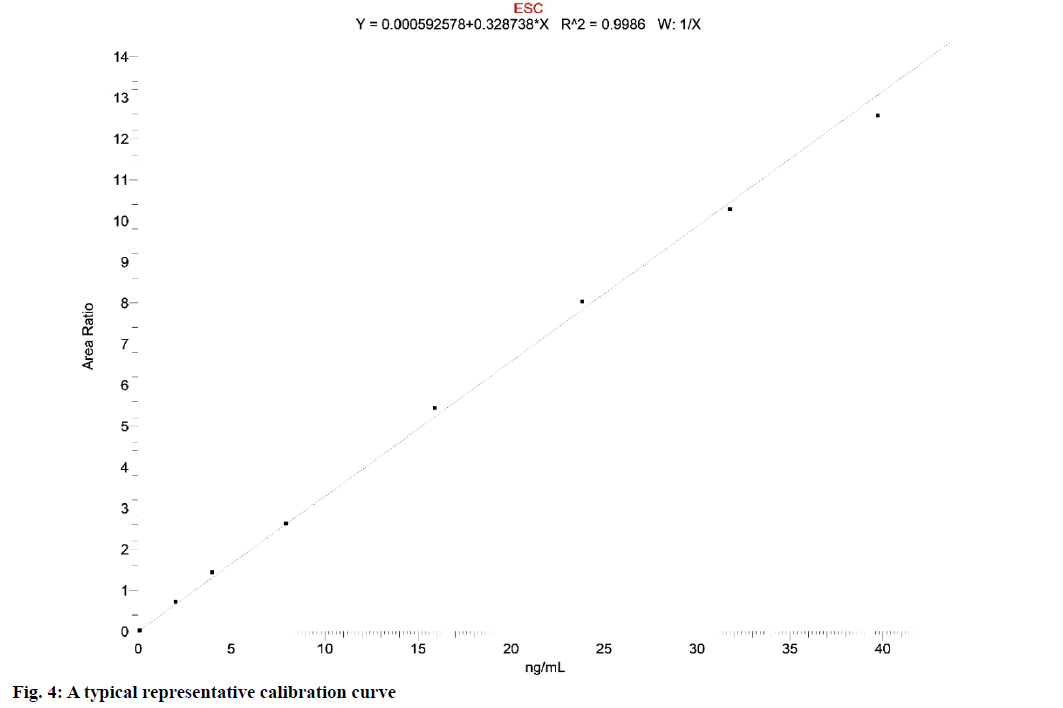
The various calibration models were tried by checking the linear algorithm by applying weighting factors of equal, 1/x, 1/x2. The calibration model with 1/x regression gave the best fit, which was the reproducible and simplest model to minimize the bias of back calculated values.
The nine-point calibration curve was created by plotting the peak area ratio of escitalopram against the nominal concentration of CSs.
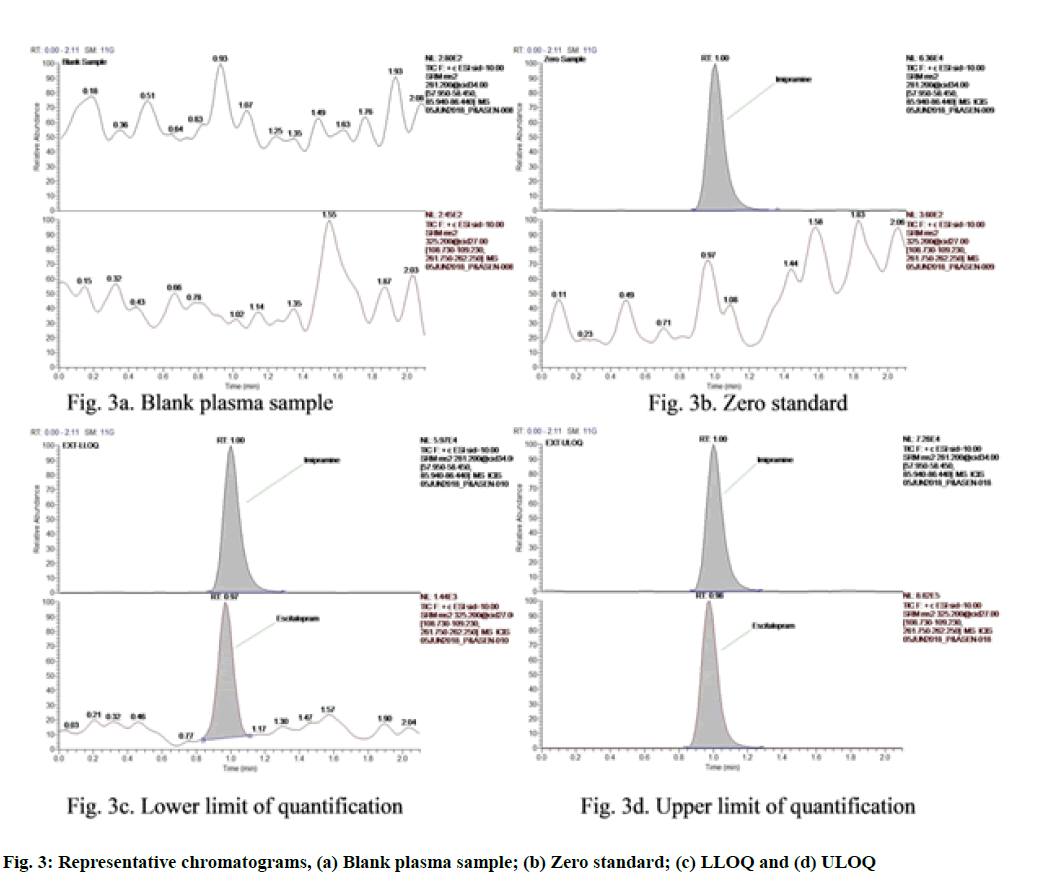
Calibration curves obtained were consistent, accurate and precise for escitalopram in the concentration range of 0.050 to 39.708 ng/ml. The coefficient of determination (r2) was greater than 0.9988. Calibration curves were used for the back-calculations to find out the concentrations of escitalopram at each calibration standard. The weighting factor applied in the calibration model was 1/x as it gave the best fit. By applying the weighting factor of 1/x the simplest, the continuous and reproducible model was obtained which reduced the bias of back-calculated values. The representative chromatogram of fasted blank sample, zero standard (spiked with internal standard) and sample spiked at the LLOQ and ULOQ concentration are given in fig. 3. The typical calibration curve is presented in fig. 4.
Intra-batch precision and accuracy were evaluated by performing a calibration curve along with four sets of QC samples where the QCs were in a replicate of six in the four different batches and the QC levels were Lowest Limit of Quality Control (LLOQC), LQC, MQC and HQC of sample on three different days. The average percentage nominal concentration and CV of escitalopram at all QC levels are calculated.
Inter-batch precision and accuracy is also evaluated by analyzing the data of four batches of 3 different days. The results of interday and intraday precision and accuracy are tabulated in Table 1.
| Intra-day and inter-day precision and accuracy for the determination of escitalopram mass spectrometry (n=3 d, six replicates per day) | |||||
|---|---|---|---|---|---|
| Intra batch | Calibration line (r2) value | LLOQC % accuracy, % RSD (n=6) | LQC % accuracy, % RSD (n=6) | MQC % accuracy, % RSD (n=6) | HQC % accuracy, % RSD (n=6) |
| 1 | 0.9996 | 106.34, 4.13 | 98.86, 1.64 | 97.34, 0.24 | 95.91, 1.37 |
| 2 | 0.9997 | 110.24, 2.65 | 102.60, 1.90 | 99.79, 1.67 | 98.47, 1.60 |
| 3 | 0.9988 | 109.27, 2.23 | 104.22, 9.81 | 99.38, 3.57 | 99.47, 5.41 |
| 4 | 0.9998 | 106.83, 1.32 | 98.21, 1.32 | 96.15, 0.79 | 95.78, 1.10 |
| Inter-batch | NA | 108.29, 3.15 | 100.97, 5.47 | 98.16, 2.08 | 97.40, 3.27 |
Note: % RSD: Percentage Relative Standard Deviation and NA: Not applicable
Table 1: Intra-Day and Inter-Day Accuracy and Precision
Recovery is defined as the efficiency of a method to extract the analyte from biological matrix. Recovery was determined by comparing the response obtained from extracted QC sample with corresponding post spiked QC samples (extract of blank samples spiked with analyte post extraction).
Six aliquots LQC, MQC and HQC level were processed (extracted) parallely with 18 samples of drug free biological matrix (blank sample). Escitalopram and imipramine were added to the processed blank sample to obtain post-spiked LQC, MQC and HQC level (six samples each). For escitalopram, the mean extracted recovery of the analyte from plasma samples was highly consistent at all QC levels. The extraction recovery of escitalopram is tabulated in Table 2.
| QC level | Mean area response | Extraction recovery | |
|---|---|---|---|
| Post spiked (A) | Extracted (B) | ||
| LQC | 26748 | 19406 | 72.55 |
| MQC | 3616128 | 2715187 | 75.09 |
| HQC | 6611436 | 5331879 | 80.65 |
| Mean | 76.10 | ||
| SD | 4.143 | ||
| % CV | 5.44 | ||
Note: % CV: Percentage Coefficient of Variation and SD: Standard Deviation
The mean percentage recovery for imipramine was 63.19 and % CV of the later spiked and extracted samples area of imipramine was ≤10.40.
Matrix factor analyzed at LQC and HQC samples in six dissimilar lots of rat K2EDTA plasma, which included 1 haemolysed and 1 lipemic plasma lot.
Processing of blank rat K2EDTA plasma was done and was spiked later with lower and higher spiked stock solutions of analyte and internal standard.
The equivalent aqueous QC samples were prepared along with post-spiked samples and all samples were analysed.
Matrix factor was calculated by comparing the response of samples, which were post spiked with aqueous equivalent QC samples for all the plasma lots.
The % CV obtained for matrix factor at each level, internal standard and Internal Standard (ISTD) normalised matrix factor at each level was within the acceptable limit. Results of matrix effect experiment are presented in Table 3.
| Lot number | Matrix factor | ISTD normalized matrix factor | |||
|---|---|---|---|---|---|
| LQC | HQC | ISTD | LQC | HQC | |
| K2E-R1 | 0.91 | 0.94 | 0.98 | 0.93 | 0.96 |
| K2E-R2 | 0.91 | 0.96 | 0.99 | 0.92 | 0.97 |
| K2E-R3 | 0.91 | 0.97 | 0.98 | 0.93 | 0.99 |
| K2E-R4 | 0.93 | 0.97 | 0.98 | 0.95 | 0.99 |
| L-098 | 0.90 | 0.98 | 0.96 | 0.94 | 1.02 |
| H-099 | 0.92 | 0.97 | 0.96 | 0.96 | 1.01 |
| Mean | 0.91 | 0.97 | 0.98 | 0.94 | 0.99 |
| SD | 0.010 | 0.014 | 0.012 | 0.015 | 0.023 |
| % CV | 1.10 | 1.44 | 1.22 | 1.60 | 2.32 |
Note: K2E: Dipotassium Ethylenediaminetetraacetic Acid and R1, R2, R3, R4: Rats
Table 3: Matrix Effect For Escitalopram in Rat Plasma
Dilution integrity was assessed to find out whether by keeping the final concentrations unaffected the samples can be diluted with blank sample or not. The experiment was performed with six samples each of two times (1/2) and of four times dilution (1/4) of 2× HQC samples. The diluted samples processing was performed and was evaluated by using calibration curve and final concentrations was calculated by applying respective dilution factor. The percentage nominal concentration of escitalopram was obtained as 96.01 and 97.44 for half and quarter dilution respectively. % CV of escitalopram was ≤1.08.
Drug stability is the function of storage condition in a biological matrix, stability testing is evaluated according to the storage condition which would be required during sample collection and handling. Various stabilities were performed and the details of stability are briefed in Table 4.
| Storage condition | QC level | Mean % change |
|---|---|---|
| Bench top stability (06.00 h at room temperature) | LQC | -0.77 |
| HQC | 4.94 | |
| In-injector stability at 5° for 29.00 h | LQC | -1.50 |
| HQC | -0.97 | |
| Freeze and thaw stability after 4th cycle at -70°±5° | LQC | -1.50 |
| HQC | -0.72 | |
| Wet extract stability for 04.00 h at room temperature | LQC | 0.00 |
| HQC | 0.13 | |
| Dry extract stability for 04:00 h at room temperature | LQC | -4.98 |
| HQC | -4.12 | |
| Long-term stability for 52 d at -70° | LQC | 3.85 |
| HQC | -3.25 |
Table 4: Stability Results For Escitalopram Under Different Conditions
Main stock solution stability for 19 d at temperature of 2°-8° (long term) was described below. Solution of escitalopram and imipramine were prepared and were kept in refrigerator as stability sample. After 19 d aqueous equivalent ULOQ concentration of escitalopram and working solution of imipramine were made from the stock of stability samples and analysed along with freshly prepared samples. Mean area of stability and freshly prepared samples were compared to find out mean percent (%) change. The mean % change was within the acceptance criteria of ±10 %.
Spiking stock solution stability for 19 d at temperature of 2°-8° (Long term) was shown below. Spiking stock solutions of escitalopram was prepared and kept in refrigerator at 2°-8° as stability sample. After 19 d, aqueous sample of LLOQ and ULOQ were analysed against freshly prepared aqueous equivalent LLOQ and ULOQ of escitalopram of prepared samples. Mean area of stability of freshly prepared samples were compared to find out mean % change. The mean % change was within the acceptance criteria of ±10 %.
Stability of escitalopram in bench at room temperature for 6 h is as follows. LQC and HQC bulk spiked samples were kept at bench for 6 h, after stability hours the samples were processed and analysed along with freshly prepared linearity and QC samples of same concentration. The mean area of stability and freshly prepared samples were compared to find out mean % change. The mean % change for escitalopram was found to be within the acceptance criteria of ±15 %.
Stability of escitalopram at 5° in auto sampler for 29.00 h (In-injector) is as follows. LQC and HQC samples were processed and after processing they were stored in auto sampler for 29.00 h at 5°. After the stability hours, the samples were compared with freshly processed linearity and QC samples. Mean % change was calculated. The mean % change for escitalopram was found to be within the acceptance criteria of ±15 %.
LQC and HQC bulk spiked samples were prepared and stored in frozen condition at -70°±5°. Samples were retrieved and thawn four times. Processing of freeze-thaw samples was done and estimated with fresh linearity and quality samples at lower and higher level (comparison samples). Mean % change was calculated after 4th freeze-thaw cycle. The mean % change for escitalopram was within the acceptance criteria of ±15 %.
et extract stability of escitalopram at room temperature for 04.00 h is as follows. LQC and HQC which were bulk spiked and stored were retrieved for processing. After processing, the samples were stored at room temperature. After 04.00 h the samples were submitted for quantification with freshly prepared linearity and quality samples at lower and higher level (Comparison samples). Mean % change was calculated. The mean % change for escitalopram was within the acceptance criteria of ±15 %.
Dry extract stability of escitalopram at room temperature for 04.00 h is as follows. During the processing steps, after evaporation the samples were kept at room temperature for 4 h. After that the reconstitution solution was added and analyzed with freshly prepared linearity and QC samples (Comparison samples). Mean % change was calculated. The mean % change for escitalopram was within the acceptance criteria of ±15 %.
Samples were prepared at LQC and HQC levels and stored at -70°±5° (stability samples). After 52 d these stability samples were retrieved, processed and analysed against freshly prepared CSs, LQC and HQC samples (comparison samples). The calculated concentrations of stability and comparison samples were used to determine the mean % change. The mean % change for escitalopram was found to be within the acceptance criteria of ±15 %.
The present work demonstrate LC-MS/MS method with LLOQ of 0.050 ng/ml, which is 10 times more sensitive and with 50 μl of plasma volume which is 20 times less than the reported methods of similar sensitivity with 2.10 min of run time. Few earlier reported sensitive methods demonstrated a long run time of 10 min with 0.5 ng/ ml[4], LLOQ levels 1 ng/ml)[5], LLOQ of 0.1 ng/ml using 1 ml plasma[7]. Comparing those sensitive methods, the present methods showed more acceptability for animal sample. It requires less plasma volume and sensitivity is also improved. Additionally, this method involves the Liquid-Liquid Extraction (LLE) technique of sample processing which is very simple and cost-effective. The method is also validated in alignment with the recent USFDA guidelines released on May 2018[9].
Application of the method to pharmacokinetic study is shown below. This developed and validated LC-MS/ MS method was applied to animal pharmacokinetic study escitalopram by dosing the animal with 2.5 mg/ kg p.o. of the drug and the method was able to quantify the escitalopram in the presence of other endogenous materials and drug metabolites. This was conducted in Sprague-Dawley rats after obtaining the approval from the Institutional Animal Ethics Committee (IAEC), Kasturba Medical College, Manipal Academy of Higher Education.
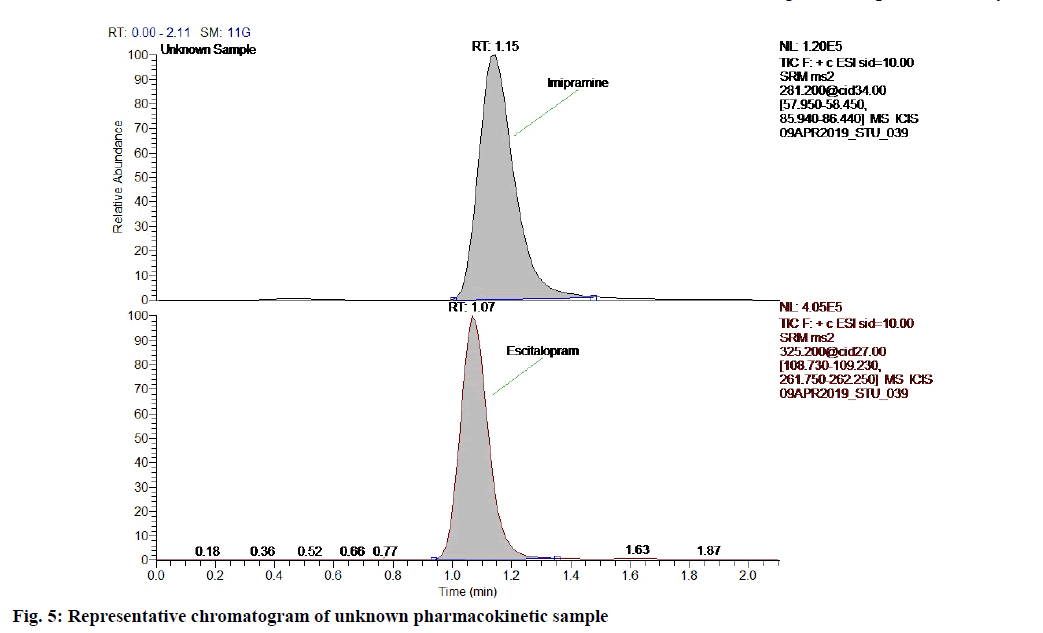
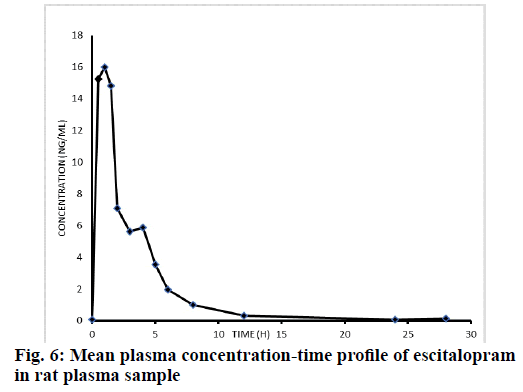
The rats were fasted overnight, however were allowed to free access water. In morning, the animals were dosed with 2.5 mg/kg in the form of suspension by using carboxymethylcellulose and blood samples were collected. The representative chromatogram of the unknown pharmacokinetic sample is given in fig. 5 to demonstrate that no interference peaks were found at the retention time of analyte and internal standard. The mean plasma concentration-time profile of escitalopram in rat plasma is presented in fig. 6. This also indicates that all pharmacokinetic samples were accurately quantified in the linearity range of 0.050-39.708 ng/ml.
In this paper, a rapid highly sensitive, reproducible and a rugged LC-MS/MS method for the estimation of escitalopram in rat plasma was developed and validated as per the current USFDA guideline (May 2018). This method involves simple and economic LLE procedure with good recovery and no matrix effect. The LLOQ reported in this method is 10 times lesser with the reported method using 50 μl of plasma volume which is very critical for animal pharmacokinetic study. The application of this method to animal pharmacokinetic study demonstrates that the validated method is very reliable and accurate.
Acknowledgements:
We would like to acknowledge Ecron Acunova limited and Manipal College of Pharmaceutical Sciences, Manipal for the support and necessary facilities provided for this work.
Conflict of interests:
The authors declared no conflict of interest.
References
- Escitalopram. Bethesda (MD): National Library of Medicine. In: Drugs and Lactation Database (LactMed). United States; 2006.
- Rao N. The clinical pharmacokinetics of escitalopram. Clin Pharmacokinet 2007;46(4):281-90.
[Crossref] [Google Scholar] [PubMed]
- Rampono J, Hackett LP, Kristensen JH, Kohan R, Page‐Sharp M, Ilett KF. Transfer of escitalopram and its metabolite demethylescitalopram into breastmilk. Br J Clin Pharmacol 2006;62(3):316-22.
[Crossref] [Google Scholar] [PubMed]
- Pistos C, Panderi I, Atta-Politou J. Liquid chromatography–positive ion electrospray mass spectrometry method for the quantification of citalopram in human plasma. J Chromatogr B Analyt Technol Biomed Life Sci 2004;810(2):235-44.
[Crossref] [Google Scholar] [PubMed]
- Singh SS, Shah H, Gupta S, Jain M, Sharma K, Thakkar P, et al. Liquid chromatography-electrospray ionisation mass spectrometry method for the determination of escitalopram in human plasma and its application in bioequivalence study. J Chromatogr B Analyt Technol Biomed Life Sci 2004;811(2):209-15.
[Crossref] [Google Scholar] [PubMed]
- Sauvage FL, Gaulier JM, Lachatre G, Marquet P. A fully automated turbulent-flow liquid chromatography-tandem mass spectrometry technique for monitoring antidepressants in human serum. Ther Drug Monit 2006;28(1):123-30.
[Crossref] [Google Scholar] [PubMed]
- Rocha A, Marques MP, Coelho EB, Lanchote VL. Enantioselective analysis of citalopram and demethylcitalopram in human and rat plasma by chiral LC‐MS/MS: Application to pharmacokinetics. Chirality 2007;19(10):793-801.
[Crossref] [Google Scholar] [PubMed]
- De Castro A, Concheiro M, Quintela O, Cruz A, López-Rivadulla M. LC-MS/MS method for the determination of nine antidepressants and some of their main metabolites in oral fluid and plasma: Study of correlation between venlafaxine concentrations in both matrices. J Pharm Biomed Anal 2008;48(1):183-93.
[Crossref][Google Scholar] [PubMed]
- USFDA. Bioanalytical Method Validation, Guidance for Industry. FDA-2013-D-1020: Food and Drug Administration, Rockville, Maryland, MD 20852: U. S. Department of Health and Human Services; Food and Drug Administration; Center for Drug Evaluation and Research (CDER); Center for Veterinary Medicine (CVM), Silver Spring, Maryland; 2018. p. 1-41.
