- *Corresponding Author:
- P. R. Kammela
Department of Chemistry
Bapatla Engineering College
Bapatla, Guntur
Andhra Pradesh 522101, India
E-mail: prasad17467@gmail.com
| Date of Received | 10 January 2020 |
| Date of Revision | 17 June 2020 |
| Date of Acceptance | 14 July 2021 |
| Indian J Pharm Sci 2021;83(4):701-713 |
This is an open access article distributed under the terms of the Creative Commons Attribution-NonCommercial-ShareAlike 3.0 License, which allows others to remix, tweak, and build upon the work non-commercially, as long as the author is credited and the new creations are licensed under the identical terms
Abstract
The present work describes the development and subsequent validation of a novel, simple, selective and stability indicating gradient reversed phase high performance liquid chromatography method for the quantitative determination of related substances, assay of cabozantinib and nivolumab and its application to dissolution studies. The chromatographic method was optimized using the impurity-spiked solution. A good resolution between the peaks was achieved under selected chromatographic conditions. The separation was accomplished on an X-Bridge C18, 150×4.6 mm, 3.5 μ column connected to a photo diode array detector using 0.1 % orthophosphoric acid in water as mobile phase A and acetonitrile as mobile phase B, under gradient elution. The mobile phase flow rate was maintained at 1.0 ml/min. The detection of the constituents was done at 216 nm using a ultra-violet detector. Recovery studies were satisfactory and the correlation coefficient for two active pharmaceutical ingredients and their related substances, 0.999 indicates the linearity of the method within the limits. Limit of detection and limit of quantification for all impurities and cabozantinib and nivolumab were established with respect to the test concentration. Specificity, accuracy, precision, ruggedness and robustness were determined as part of the method validation. The performance of the method was validated according to the current International Council for Harmonisation requirements. Moreover, the dissolution study was performed on active pharmaceutical ingredients to estimate the recovery using the same method. Validation of the developed reversed phase high performance liquid chromatography procedure revealed that all the degradation products formed during stress conditions and related impurities were well separated from their active pharmaceutical ingredients and peaks were well resolved from each other with appropriate retention time. The method was characterized by good linearity, specificity, low values of limit of detection and quantisation, accuracy, precision, ruggedness and robustness. All statistical results were within the acceptance criteria and the proposed method is simple, fast, accurate, precise and reproducible hence, it can be applied for routine dissolution analysis and employed for quality control of drug samples during stability studies.
Keywords
Validation, reversed phase high performance liquid chromatography, cabozantinib, nivolumab
Pharmaceutical product comprises of various undesirable chemicals that remain with active pharmaceutical ingredients (APIs). Even trace amounts of these unwanted impurities can affect the efficacy and safety of a pharmaceutical product. Hence, the identification and isolation of impurities is one of the most daunting activities of analytical chemists in the pharmaceutical industry. As part of the method validation we have identified four impurities in samples of cabozantinib (CBZ) and nivolumab (NVB) drug formulation product, characterized by high performance liquid chromatography (HPLC) analytical data.
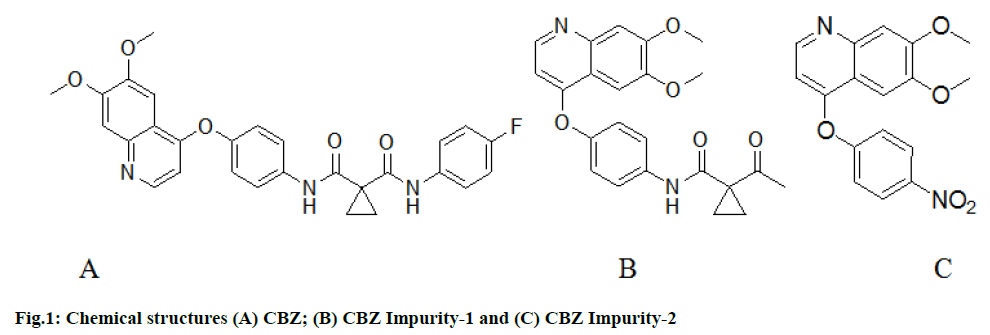
CBZ, chemically N-{4-[(6,7-dimethoxyquinolin -4-yl)oxy]pheny1}-N-(4-fluorophenyl)-cyclopropane-1,1-dicarboxamide, (2S)-hydroxybutanedioate. Impurity-1 and impurity-2 are the names assigned to the impurities of drug (fig. 1) and their chemical names are 1-((4-((6,7-dimethoxyquinolin-4-yl)oxy) phenyl)carbamoyl)cyclopropane-1-carboxylic acid and 6,7-dimethoxy-4-(4-nitrophenoxy) quinoline. CBZ was approved by the United States Food and drug administration (USFDA) in 2012 under the brand name Cometriq for the treatment of advanced, metastatic medullary thyroid cancer[1] and a second line treatment for renal cell carcinoma[2,3] among others it was also approved by the European Medicines Agency in 2015 for the same indications. It is a novel small molecule inhibitor of multiple tyrosine kinases with potent activity toward hepatocyte growth factor receptor (HGFR/ MET) and vascular endothelial growth factor receptor (VEGFR)-1, VEGFR-2 and VEGFR-3[4,5]. CBZ has been shown to inhibit the tumor growth, invasiveness, angiogenesis and metastasis in both preclinical[6-8] and clinical studies[9], leading to tumor regression. However, tumor regression was not observed when CBZ was discontinued after 10 d, suggesting that CBZ levels must be sustained during vaccine therapy to achieve synergic effects. CBZ can exhibit antitumor activitiy in patients suffering from multiple cancer problems like pancreatic cancer, prostate cancer[10,11], breast cancer. In addition, recent research indicates that CBZ could be the most efficacious tyrosine kinase inhibitor (TKI) for metastatic renal cell carcinoma, not only after TKI therapy but also as a first line treatment[12,13].
NVB, also known as Opdivo, is the first PD- 1(Programmed cell death-1) antibody mediated inhibitor and works as a checkpoint inhibitor. The USFDA and European Medicines Agency[14] have approved NVB for the treatment of metastaic melanoma in conjunction with ipilimumab[15], advanced squamous or non-squamous Non small cell lung carcinoma (NSCLC) and other indications. The rate of objective response in patients with NSCLC treated with NVB is about 20 %[16] NVB and other immune checkpoint agents,[17,18,19] on the oher hand, cause a variety of immune-related adverse effects including dermatological, gastrointestinal, endocrine, hepatic, neurological and other effects on other organs. NVB has not been studied in pregnant women, but it is likely to affect a baby based on how the medication functions and animal studies, it is unclear whether NVB is secreted in breast milk[20]. Impurity-1 and impurity-2 are the names assigned to impurities NVB.
A review of the literature revealed that only a few analytical methods for evaluating CBZ and NVB had been published. Liquid chromatography–mass spectrometry estimation[21,22] and enzyme-linked immunosorbent assay (ELISA) estimation[23], forced degradation[24] and bio-analytical[20] studies by HPLC, CBZ estimation[25] by HPLC, are some of these approaches. However, no stability indicating HPLC methods for the analysis of related substances (RS) of CBZ and NVB in combined dosage forms have yet been published to our knowledge. Hence it was felt necessary to develop a reliable, sensitive, accurate, selective and stability indicating reversed phase HPLC (RP-HPLC) method for the simultaneous determination of RS of CBZ and NVB in combined dosage forms. Moreover, it's worth mentioning that no previous research on the dissolution rate of these API has been done. So that present research work was undertaken. The newly developed method was fruitfully validated as per the International Conference on Harmonization (ICH) guidelines[26,27].
Materials and Methods
Acetonitrile, ortho phosphoric acid and water (HPLC grade) were purchased from Merk (India) Ltd. Worli, Mumbai, India. All APIs of CBZ and NVB as reference standards were procured from Zydus cadila, Ahmedabad, India (99.7-99.9 % purity).
Instrumentation:
HPLC analysis was performed on a Waters alliance e-2695 chromatographic system equipped with a quaternary pump and photo diode array detector (PDA detector) 2996. The data was collected and the purity of the peak was checked using the Empower-2.0 software.
Chromatographic conditions:
Separation was accomplished on a X-BRIDGE C18 column (150×4.6mm, 3.5μm). 1.0 ml/min flow rate and 10 μl injection volume was used for RS as well as assay determination. The ultraviolet (UV) detection wavelength was carried out at 216 nm at ambient column temperature.
Selection of wavelength:
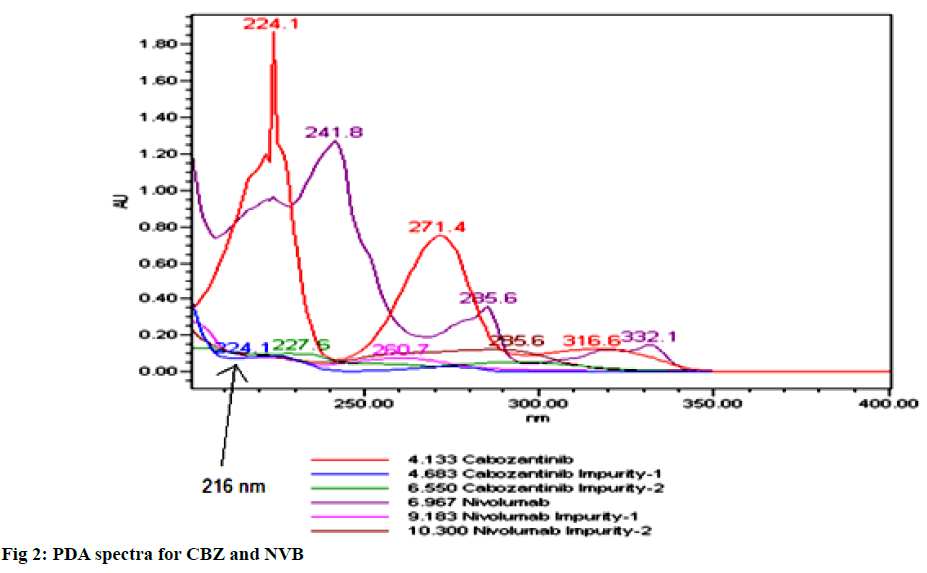
To analyze both drugs detection were tried at various wavelengths from 200-400 nm in order to raise the sensitivity of the method, where the wavelength at which 216 nm gave considerable sensitivity for all the studied components (fig. 2).
Preparation of the mobile phase:
1 ml ortho phosphoric acid was introduced into 1 l water and filtered by using 0.45 μ membrane filter and degas was used as mobile phase A. Acetonitrile was used as mobile phase B. Mobile phase A and B in the ratio of 50:50 v/v was used as diluent.
Optimization of mobile phase:
Different types of buffer solutions and mobile phases were utilised for developing the process but good resolution was not observed between API and RS. Thereafter, the selected mobile phase has slightly enhanced the resolution and gave the best resolution among CBZ, NVB and their impurities.
Preparation of standard solution for RS:
Accurately weighed and transferred 200 mg of CBZ and 50 mg of NVB (working standards) in 100 ml volumetric flask, about 70 ml of mobile phase was added and it was sonicated to dissolve and diluted upto the mark with diluent and mixed thoroughly. Further, 5 ml of above solution was diluted to 50 ml with diluent (Table 1).
| Time (min) | Mobile Phase-A | Mobile Phase-B |
|---|---|---|
| 0 | 80 | 20 |
| 5 | 50 | 50 |
| 7 | 20 | 80 |
| 10 | 20 | 80 |
| 12 | 80 | 20 |
| 17 | 80 | 20 |
Table 1: Gradient Program for CBZ and NVB
Preparation of sample solution for RS:
20 tablets were weighed and triturated in a mortar. This powder equivalent to 600 mg of sample was taken in a 100 ml clean and dry volumetric flask. To this added 70 ml mobile phase and sonicated it for about 30 min with occasional shaking and make up to the mark. Further, 5.0 ml of this solution was diluted to 50 ml with diluent and filtered the solution through 0.45 μ nylon syringe filter.
Impurity stock solution for RS:
Accurately weighed and transferred each 10 mg of CBZ impurity-1 and impurity-2 and 10 mg of NVB impurity-1 and 5 mg of NVB impurity-2 in 100 ml volumetric flask. To this 70 ml of diluent was added and sonicated to dissolve it and diluted up to the mark.
Spiked sample solution for RS:
Transferred 600 mg of sample into 100 ml volumetric flask, added 70 ml of the diluent and added 10 ml of impurity standard stock solution and diluted up to the mark by diluent, filtered the solution through 0.45 μ syringe filter.
Preparation of standard solution for assay:
Accurately weighed 50 mg of CBZ and 12.5 mg of NVB (working standards) and transferred in 100 ml volumetric flask, added about 70 ml of the mobile phase and it was sonicated for 10 min for complete dissolution and diluted up to the mark with mobile phase and thoroughly mixed. 5 ml of this solution was taken and diluted to 50 ml with diluent.
Preparation of sample solution for assay:
10 tablets were weighed and triturated in a mortar. The tablet powder which is equivalent to 150 mg of sample was transferred to a 100 ml clean and dry volumetric flask. To this 70 ml of mobile phase was added and sonicated for 30 min with occasional shaking and made it up to the mark. Further, 5 ml of the above solution was diluted to 50 ml with mobile phase and it was filtered through 0.45 μ nylon syringe filter.
Results and Discussion
Primary objective of the chromatographic method was to separate API from their impurities and degradation products generated from the peak of the analyte. Moreover, dissolution study was performed on API to estimate the recovery using the same method.
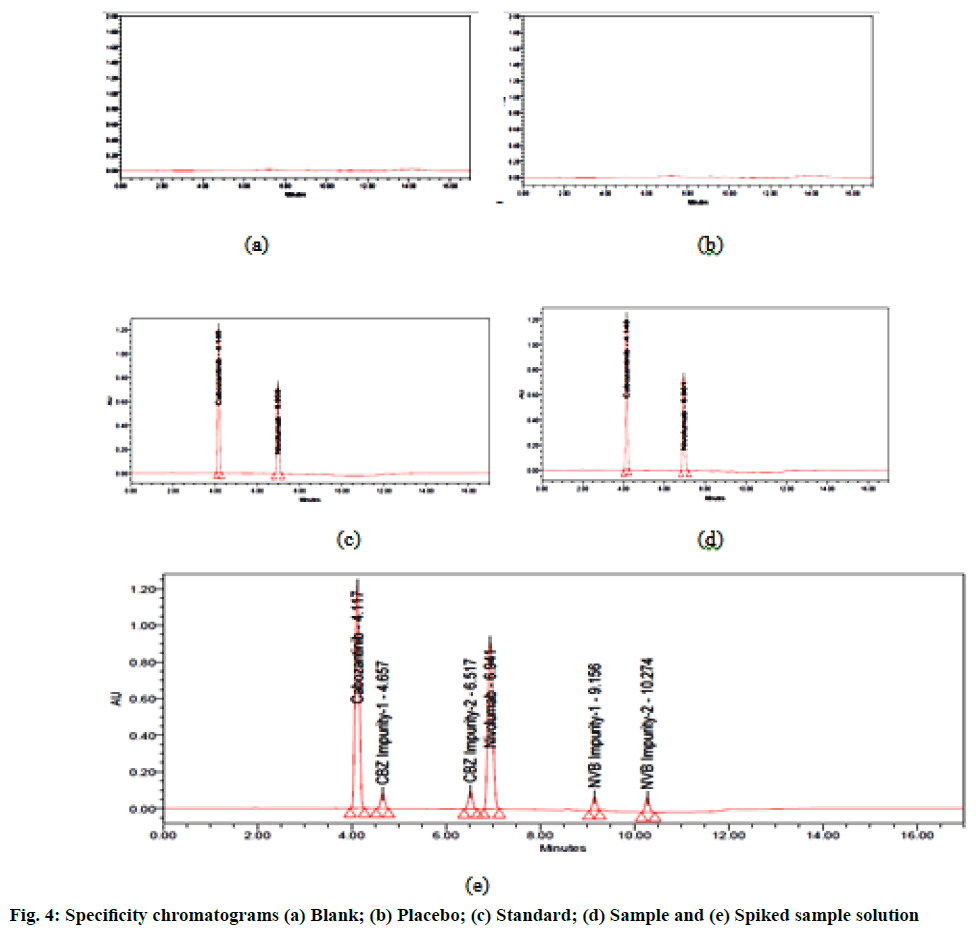
Different trails were conducted to achieve good resolution between CBZ and NVB and their impurities. Several types of buffer solutions and organc phases were used for developing this method but good resolution was not obseved between API and connected substances. Thereafter, the selected mobile phase (A and B) slightly enhanced the resolution and gave better resolution among CBZ, NVB and their impurities. Phosphate buffer and and acetonitrile were used as mobile phase A and mobile phase B respectively. Development trails were performed with C4, C8, amino, Cyano, phenyl columns but separation of these impurities and API were achieved with X-Bridge C18, 150×4.6 mm, 3.5 μ column connected to PDA detector. Mobile phase flow rate was maintained at 1.0 ml/min. The detection of constituents was done at 216 nm using UV detector. Under these conditions, the resolution between the impurities and analyte was almost achieved except between impurity-2 of CBZ and NVB, when the impurity-spiked sample solution was injected. In mobile phase B, acetonitrile was taken in different ratios with change in gradient program to increase resolution between these two peaks. The gradient program was further optimized to increase the resolution between impurity-2 of CBZ and NVB. In optimized chromatographic conditions, all the impurities, degradation products and API were well separated and retention time of CBZ and NVB was 4.15 and 7.10 with a tailing factor of 0.98 and 1.05 and typical relative retention times of impurity-1 and impurity-2 of CBZ were approximately 1.13, 1.58 and impurity-1, impurity-2 of NVB were about 1.32, 1.48 respectively. The number of theoretical plates for CBZ and NVB peak was 3984, 5532 and percentage relative standard deviation (RSD) for six replicate injections was around 1.2 %. All the results were within the limits so the developed method was selected for purity of CBZ and NVB. Such an optimized method was used to study the impurity study of CBZ and NVB in tablet dosage form. Moreover, by using optimized chromatographic conditions and the solubility data of the drugs, various dissolutions were performed to optimize the parameters like dissolution media and its volume, apparatus and rotations per minute (rpm) to get the maximum percentage release of the drug.
The developed chromatographic method was validated as per ICH guidelines with the aspect of system suitability (SST), linearity and range, precision in terms of percentage RSD, accuracy in terms of percentage recovery, robustness study.
HPLC system was stabilized for 60 min inorder to get a stable baseline. As per the given method a standard solution was injected for six times into the HPLC system. The SST parameters were evaluated and results were illustrated and found to be within the limits (fig. 3). Results are furnished in table (Table 2).
| System suitability parameter | Acceptance criteria | Drug name | |||
|---|---|---|---|---|---|
| CBZ | NVB | ||||
| RS | Assay | RS | Assay | ||
| Percentage RSD | NMT 2.0 | 0.86 | 0.44 | 0.75 | 0.52 |
| USP Tailing | NMT 2.0 | 0.54 | 0.35 | 0.48 | 0.64 |
| USP Plate Count | NLT 3000 | 7826 | 6458 | 8478 | 9436 |
Table 2: System Suitability Data
The specificity of an analytical method is the ability to measure accurately and specifically the analyte response in the presence of its potential impurities. The specificity of the proposed method for active ingredients was carried out in the presence of their impurities. Solutions of standard, placebo and blank were injected into the system and its chromatograms were recorded. All the peaks were found pure in presence of each other and found no interference of placebo with the principal peak, hence the method is specific (fig. 4).
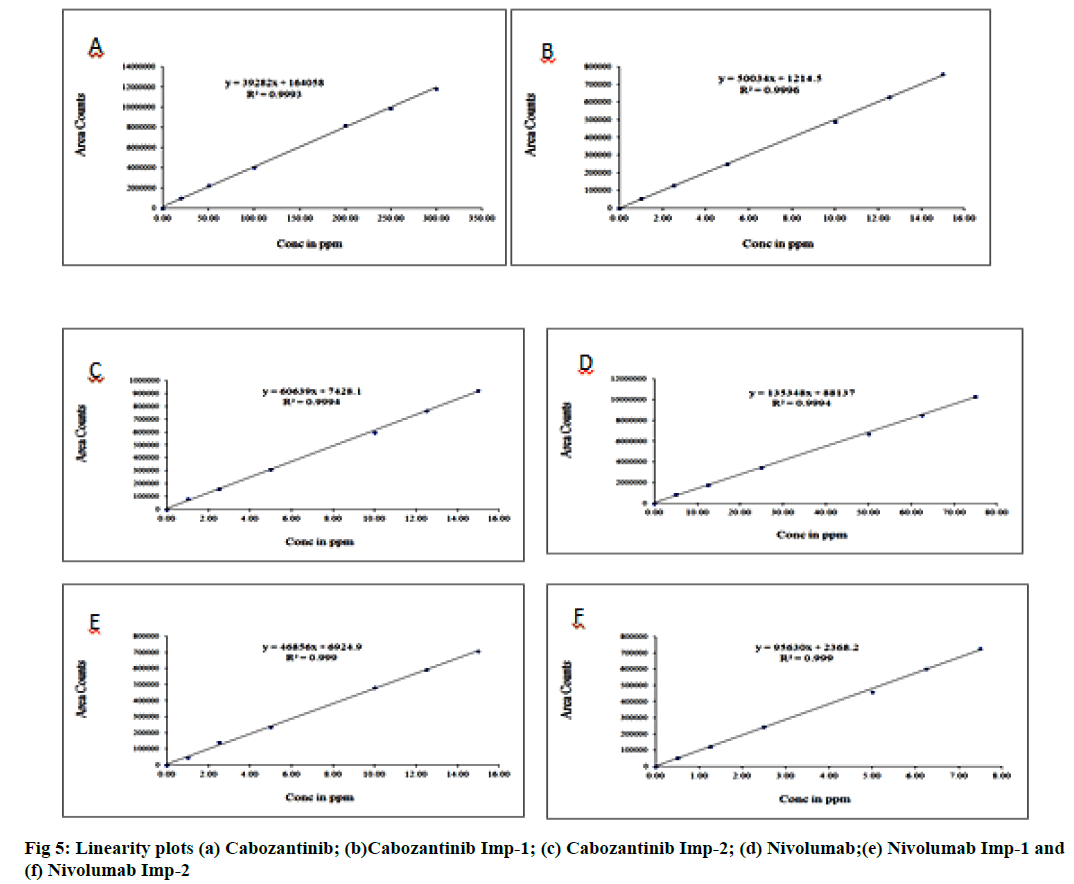
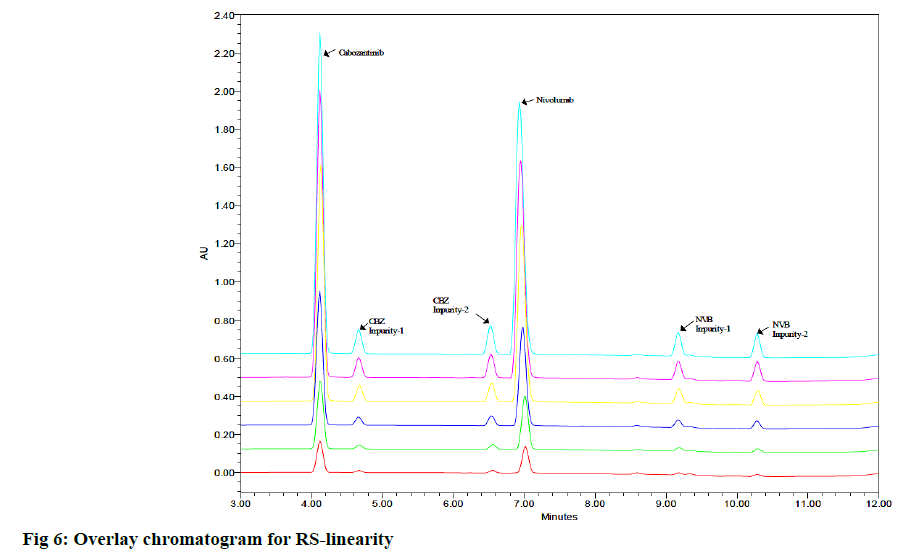
Linearity is its ability to obtain the test results which are directly proportional to the concentration of the analyte in the sample. Linearity test solutions for related substance method were prepared from impurity stock solution at different concentration levels for CBZ, NVB and their impurities. The linearity range was found to be 20 μg/ml to 300 μg/ml for CBZ, 1.0 μg/ml to 15.0 μg/ml for CBZ impurity-1, 1.0 μg/ml to 15.0 μg/ ml for CBZ impurity-2 and 5 μg/ml to 75 μg/ml for NVB, 1.0 μg/ml to 15.0 μg/ml for NVB impurity-1, 0.5 μg/ml to 7.5 μg/ml for NVB impurity-2. We got linear relationships between the mean integrated peaks height and the corresponding concentrations under optimum chromatographic conditions (fig. 5). The evaluation parameters like correlation coefficients, slopes and y-intercepts were calculated. Calibration plots for all the RS were linear over the ranges tested. The correlation coefficients were under limit for all impurities. There was an excellent correlation between the peak area and the concentration for all impurities and mentioned (fig. 6).
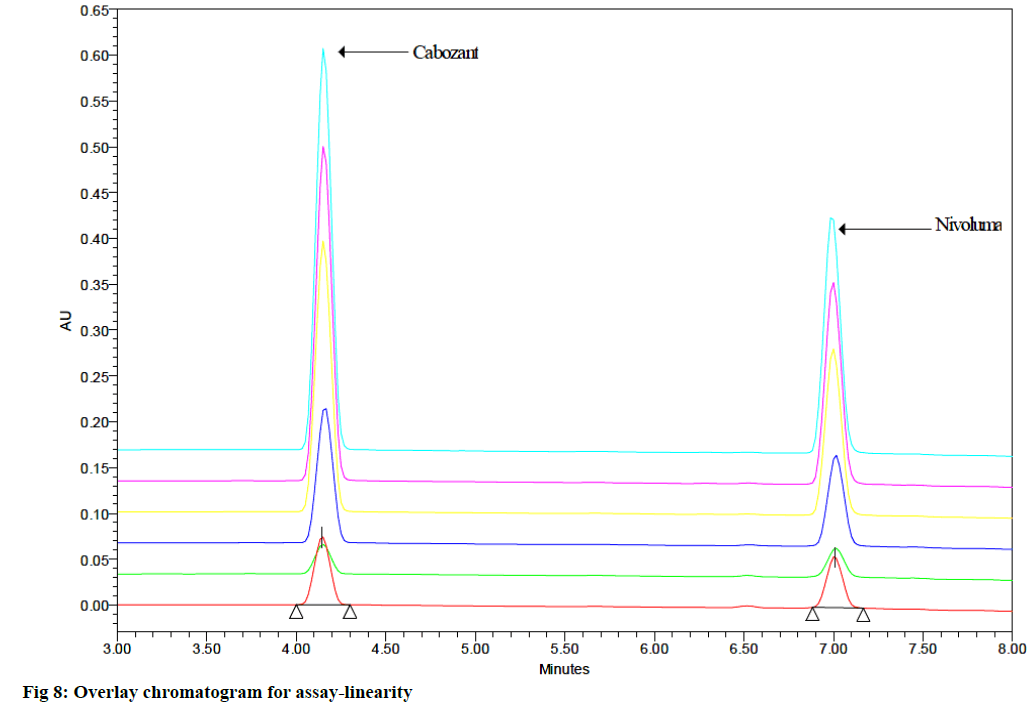
Linearity test solutions for the assay method were prepared from 10 to 150 % with respect to an analyte concentration of 50 μg/ml (CBZ) and 12.5 μg/ml (NVB). The linearity range was found to be 5 μg/ml to 75 μg/ ml for CBZ and 1.25 μg/ml to 18.75 μg/ml for NVB. The linear relationships between the mean integrated peaks height and the corresponding concentrations were obtained (fig. 7). The evaluation parameters like correlation coefficients, slopes and y-intercepts were calculated. The correlation coefficients were under limit. The results demonstrates that an excellent correlation was existed between the peak area and corresponding concentrations (fig. 8).
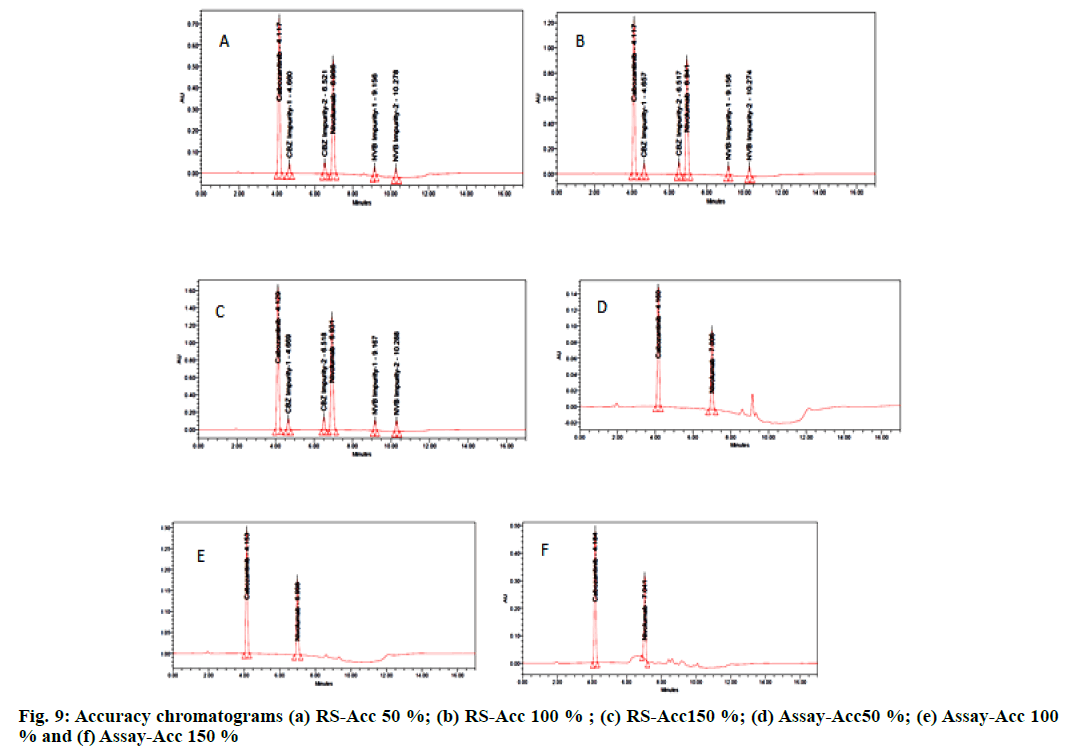
The accuracy of an analytical method is in agreeement with acceptable true value and found value. The accuracy of the related substance was evaluated by spiking known amount of impurities to the CBZ and NVB test sample in triplet at a level of 50 %, 100 % and 150 %. The percentage recoveries for all impurities were calculated. The accuracy of the assay method was evaluated in triplicate at three different level of 50 %, 100 % and 150 % of the target concentration of 25, 50 and 75 μg/ml of CBZ; 6.25, 12.5 and 18.75 μg/ml of NVB and the test solution was injected three times for each spike level as per the test method. Good percentage recoveries were noticed. The recovery results must be not less than (NLT) 95.0 % and not more than (NMT) 105.0 % (fig. 9). Results are furnished in Table 3 and Table 4.
| S.No. | Percentage Level | CBZ RS average percentage recovery | CBZ assay average percentage recovery |
|---|---|---|---|
| 1 | 50 | 100.18 | 100.24 |
| 2 | 100 | 100.86 | 100.35 |
| 3 | 150 | 100.1 | 100.41 |
Table 3: Accuracy Results for CBZ
| S. No. | Percentage level | NVB RS average percentage recovery | NVB assay |
|---|---|---|---|
| average percentage recovery | |||
| 1 | 50 | 100.57 | 100.96 |
| 2 | 100 | 100.49 | 99.98 |
| 3 | 150 | 100.62 | 100.11 |
Table 4: Accuracy Result for NVB
The precision of the analytical method is the closeness of replicate results obtained from multiple sampling of homogeneous sample. The precision of related substance method was checked by injecting six individual determinations of CBZ (200 μg/ml) and NVB (50 μg/ml) spiked with 5 % each of CBZ impurity-1 and CBZ impurity-2 and 20 % and 10 % level of NVB impurity-1 and NVB impurity-2. The percentage RSD of area was determined for each impurity and results confirming the good precision of the developed method. The precision of the assay method was evaluated by conducting six independent assays of the test sample of CBZ (50μg/ml) and NVB (12.5μg/ml) against qualified working standard and the RSD percentage of assay was calculated. The intermediate precision of the method was also performed by analyzing the six replicate of standard and sample solution on a different day, by a different analyst and by using an instrument of a different make in the same laboratory. Results are furnished in Tables 5-8.
| Sample No. | Percentage of RS | Percentage assay | ||
|---|---|---|---|---|
| Spiked Impurities | Total Impurities | Percentage purity (100-Total Imp.) |
||
| 1 2 3 4 5 6 Average Percentage RSD |
1.26 1.23 1.25 1.28 1.27 1.24 1.26 1.49 |
0.24 0.27 0.25 0.22 0.23 0.26 0.25 7.64 |
99.76 99.73 99.75 99.78 99.77 99.74 99.76 0.02 |
100.30 100.54 99.98 100.12 100.36 100.78 100.36 0.32 |
Table 5: RS and ASSAY Results for Method Precision of CBZ
| Sample No. | Percentage of RS | Percentage Assay | ||
|---|---|---|---|---|
| Spiked Impurities | Total Impurities | Percentage Purity (100-Total Imp.) |
||
| 1 2 3 4 5 6 Average Percentage RSD |
2.46 2.43 2.45 2.49 2.51 2.48 2.47 1.17 |
0.54 0.57 0.55 0.51 0.49 0.52 0.53 5.47 |
99.46 99.43 99.45 99.49 99.51 99.48 99.47 0.03 |
100.58 100.24 100.98 100.05 100.11 100.37 100.35 0.37 |
Table 6: RS and Assay Results for Method Precision of NVB
| Sample No. | Percentage of Related Substances | Percentage Assay | ||
|---|---|---|---|---|
| Spiked Impurities | Total Impurities | Percentage Purity (100-Total Imp.) |
||
| 1 2 3 4 5 6 Average Percentage RSD |
1.27 1.24 1.28 1.25 1.27 1.25 1.26 1.23 |
0.23 0.26 0.22 0.25 0.23 0.25 0.25 7.64 |
99.77 99.74 99.78 99.75 99.77 99.75 99.76 0.016 |
100.02 99.98 100.36 100.51 100.08 100.16 100.22 0.21 |
Table 7: RS and Assay Results for Intermediate Precision of CBZ
| Sample No. | Percentage of Related Substances | Percentage Assay | ||
|---|---|---|---|---|
| Spiked Impurities | Total Impurities | Percentage Purity | ||
| (100-Total Imp.) | ||||
| 1 | 2.46 | 0.52 | 99.48 | 99.95 |
| 2 | 2.43 | 0.55 | 99.45 | 100.31 |
| 3 | 2.45 | 0.54 | 99.46 | 100.58 |
| 4 | 2.49 | 0.56 | 99.44 | 100.05 |
| 5 | 2.51 | 0.55 | 99.45 | 99.99 |
| 6 | 2.48 | 0.54 | 99.46 | 100.14 |
| Average | 2.47 | 0.54 | 99.46 | 100.21 |
| Percentage RSD | 1.17 | 2.51 | 0.01 | 0.24 |
Table 8: RS and Assay NVB
Limit of Detection (LOD) is the smallest concentration of the analyte which gives the measurable response (3.3 σ/S) and Limit Of Quantification (LOQ) is the smallest concentration of the analyte that gives accurately quantified response (10 σ/S), where σ is the standard deviation of the response and S is the slope of the calibration plot. These two were determined separately by calibration curve method and for all impurities these two were estimated at signal to noise ratio of 3:1 and 10:1 respectively[28] by injecting progressively lower concentrations of standard solutions. The LOD concentrations for CBZ, CBZ impurity-1 and CBZ impurity-2 are 0.2, 0.001, 0.01 μg/ml and their s/n values are 3, 5 and 7 and NVB and NVB impurity-1 and NVB impurity-2 are 0.05, 0.01, 0.0005 μg/ml and their s/n values 4, 6 and 8. The LOQ concentration for CBZ, CBZ impurity-1 and CBZ impurity-2 are 2.0, 0.1, 0.1 μg/ml and their s/n values are 22, 25 and 27 and NVB and NVB impurity-1 and NVB impurity-2 are 0.5, 0.1, 0.005 μg/ml and their s/n values are 24, 26 and 28 (fig. 10).
The chromatographic conditions were purposfully altered to evaluate the robustness of the developed method. In all the deliberately varied experimental conditions, the resolution between API from their impurities was not significantly effected. The following parameters were altered. The mobile phase flow rate was altered by 0.2 units, organic solvent content by ±10 % and detection wavelength was altered by ±5 units. In all varied conditions there was negligible variation in resolution between peaks and no significant effect on the plate count, tailing factor and retention time. Hence this method was robust for the estimation of active ingredients and their RS. Results are furnished in Table 9.
| Parameter name | Percentage RSD | |||
|---|---|---|---|---|
| CBZ | NVB | |||
| RS | Assay | RS | Assay | |
| Flow (0.8 ml/min) Flow (1.2 ml/min) Organic solvent (+10 %) Organic solvent (-10 %) Wave length (+5 nm) Wave length (-5 nm) |
0.89 0.47 0.56 1.05 0.62 0.88 |
0.45 0.34 0.78 0.86 0.59 0.78 |
0.84 1.02 0.34 0.27 1.01 0.35 |
0.98 0.55 0.68 0.72 0.36 0.41 |
Table 9: Robustness Data for CBZ and NVB
The solution stability of CBZ and NVB were determined by analyzing sample solution, initially to 24 h at room temperature and at 2-8°. No significant changes have been found out during stability of the solution experiment and results confirmed that standard and sample solutions were stable upto 24 h during the analysis. Results are furnished in Table 10.
| Stability | Purity of CBZ | Percentage of Deviation | Purity of NVB | Percentage of Deviation |
|---|---|---|---|---|
| Initial 6 h 12 h 18 h 24 h |
99.76 99.72 99.68 99.64 99.58 |
0.00 0.04 0.08 0.12 0.18 |
99.52 99.48 99.42 99.36 99.30 |
0.00 0.04 0.10 0.16 0.22 |
Table 10: Solution Stability Results of CBZ and NVB
Active drugs have been subjected to different stress conditions such as acid and base hydrolysis, peroxide and thermal degradation to effect partial degradation of the drug. Under these stress conditions, the samples were analyzed at an initial concentration of 200 μg/ml of CBZ and 50 μg/ml of NVB by spiking with known impurity-1 and impurity-2 using a PDA detector to make homogeneity of CBZ and NVB peaks. The degradation studies were performed as follows. The acid hydrolysis (0.1 N Hydrochloric acid (HCl) at 60º for 15min), base hydrolysis (0.1N sodium hydroxide (NaOH) at 60º for 15 min), peroxide degradation (10 % Hydrogen peroxide (H2O2) at 30 min), reduction degradation (10 % Sodium bicarbonate (NaHCO3) at 60º for 15 min). No considerable degradation was observed in thermal and photolytic stress study. Results are furnished in Table 11.
| Degradation Condition | CBZ | NVB | ||
|---|---|---|---|---|
| Purity | Total Impurities | Purity | Total Impurities | |
| Acid degradation Alkali degradation Peroxide degradation Reduction degradation Thermal degradation Photolytic degradation |
94.36 93.17 92.44 95.21 94.18 90.16 |
5.64 6.83 7.56 4.79 5.82 9.84 |
92.14 90.54 89.17 94.36 92.77 84.36 |
7.86 9.46 10.83 5.64 7.23 15.64 |
Table 11: Results for Forced Degradation
Phosphate buffer (pH 7.8) is used as dissolution medium. Accurately weighed and transferred each 16.284 g of Dipotassium hydrogen phosphate (K2HPO4) and 0.888 g of Monopotassium phosphate (KH2PO4) to 1 l distilled water and pH (7.8) was adjusted with dilute HCl. It was prepared according to the Indian Pharmacopoeia.
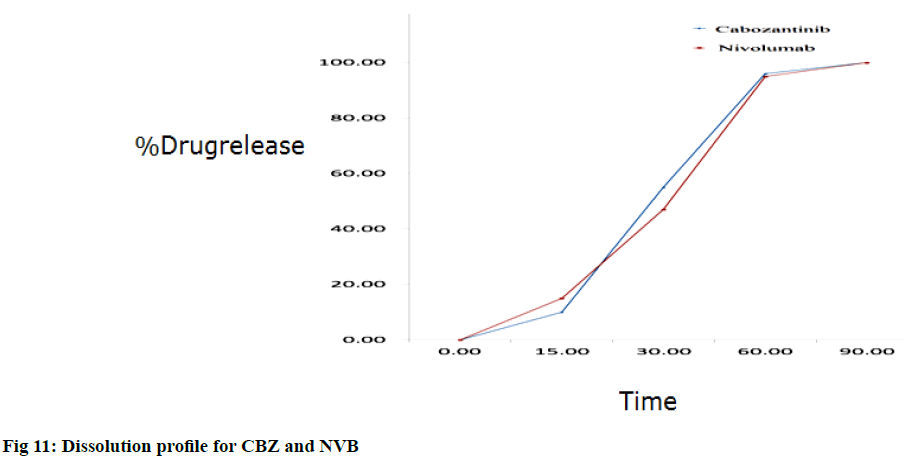
Drug release test was performed with the use of paddle stirrer kind of apparatus in 900 ml of pH 7.8 phosphate buffer at a stirring rate of 50 rpm and the temperature was maintained at 37±5°. Weighed and dropped one tablet in each of the six dissolution vessel containing dissolution media. The aliquots of sample were withdrawn at 15, 30, 60 min and immediately replaced with an equal volume of fresh medium. Sample aliquots were filtered through 0.45 μ syringe filter after the end of each test time. As per the assay test concentration samples were prepared equal volumes of these test solutions were injected into the HPLC system and peak areas were measured. The percentage content was calculated, these results were used to calculate the percentage release on each time of dissolution (fig. 11). Results are furnished in Table 12.
| Tablet | Percentage Drug Release | |||||||
|---|---|---|---|---|---|---|---|---|
| CBZ | NVB | |||||||
| 15 min | 30 min | 60 min | REC | 15 min | 30 min | 60 min | REC | |
| 1 2 3 4 5 6 Avg. RSD |
10 10 10 10 10 10 10 0.00 |
53 56 54 54 55 54 55 1.89 |
95 98 97 96 94 95 96 1.53 |
100 99 101 99 100 101 100 0.89 |
15 15 15 15 15 15 15 0.00 |
48 47 47 47 46 47 47 1.35 |
92 95 93 97 95 96 95 1.96 |
101 100 98 102 98 100 100 1.61 |
Table 12: Results for Dissolution Study for CBZ and NVB
The present study emerged with a simple and the selective stability-indicating gradient RP-HPLC method for the quantitative determination of CBZ and NVB and also their RS in tablet dosage form. All the degradation products obtained during the stress conditions and its related impurities were well separated from their API and peaks were well resolved from each other with an appropriate retention time. A simple, specific, precise and accurate assay method for the determination of drug content as well as dissolution studies were well established. The developed method demonstrated to be fast, simple, feasible and affordable when challenged for robustness either in RS, assay and dissolution conditions. The information presented here could be very useful for routine dissolution analysis and employed for quality control of drug samples during stability studies.
Acknowledgement:
One of the authors Bhavani Podili is grateful to Icon Labs, Vijayawada, India, for providing necessary instrumental facilities.
Conflict of interest:
No conflict of interest between any of the authors.
References
- US Food and Drug Administration. FDA approves Cometriq to treat rare type of thyroid cancer. Silver Spring, MD: US Food and Drug Administration; 2012.
- Rini BI, Campbell SC, Escudier B. Renal cell carcinoma. Lancet 2009;373(9669):1119-32.
- Cohen HT, McGovern FJ. Renal-cell carcinoma. New Eng J Med 2005;353(23):2477-90.
- Atreya CE, Song EK, Messersmith W, Purkey A, Bagby S, Quackenbush K, et al. Abstract LB-302: Potent antitumor activity of XL184 (cabozantinib), a c-MET and VEGFR2 inhibitor, in colorectal cancer patient-derived tumor explant models. Cancer Res 2013;73:LB-302.
- Aftab D, Schimoller F, Zayzafoon M, Chung L, Zhau H, Fagerlund K. Mechanistic Studies of Cabozantinib, A Met-VEGFR2 Inhibitor With Anti-Tumor Activity In Soft Tissue And Bone. Ann Oncol 2012;23:20.
- Yakes FM, Chen J, Tan J, Yamaguchi K, Shi Y, Yu P, et al. Cabozantinib (XL184), a novel MET and VEGFR2 inhibitor, simultaneously suppresses metastasis, angiogenesis, and tumor growth. Mol Cancer Ther 2011;10(12):2298-308.
- You WK, Sennino B, Williamson CW, Falcón B, Hashizume H, Yao LC, et al. VEGF and c-Met blockade amplify angiogenesis inhibition in pancreatic islet cancer. Cancer Res 2011;71(14):4758-68.
- Bentzien F, Zuzow M, Heald N, Gibson A, Shi Y, Goon L, et al. In vitro and in vivo activity of cabozantinib (XL184), an inhibitor of RET, MET and VEGFR2, in a model of medullary thyroid cancer. Thyroid 2013;23(12):1569-77.
- Kurzrock R, Sherman SI, Ball DW, Forastiere AA, Cohen RB, Mehra R, et al. Activity of XL184 (Cabozantinib), an oral tyrosine kinase inhibitor, in patients with medullary thyroid cancer. J Clin Oncol 2011;29(19):2660.
- Hussain MM, Smith MR, Sweeney C, Corn PG, Elfiky A, Gordon MS, et al. Cabozantinib (XL184) in metastatic castration-resistant prostate cancer (mCRPC): Results from a phase II randomized discontinuation trial. J Clin Oncol 2011;29(15):4516.
- Smith DC, Smith MR, Sweeney C, Elfiky AA, Logothetis C, Corn PG, et al. Cabozantinib in patients with advanced prostate cancer: results of a phase II randomized discontinuation trial. J Clin Oncol 2013;31(4):412.
- Choueiri TK, Escudier B, Powles T, Mainwaring PN, Rini BI, Donskov F, et al. Cabozantinib versus everolimus in advanced renal-cell carcinoma. N Eng J Med 2015;373(19):1814-23.
- Choueiri TK, Halabi S, Sanford BL, Hahn O, Michaelson MD, Walsh MK, et al. Cabozantinib versus sunitinib as initial targeted therapy for patients with metastatic renal cell carcinoma of poor or intermediate risk: the alliance A031203 CABOSUN trial. J Clin Oncol 2017;35(6):591-7.
- Sundar R, Cho BC, Brahmer JR, Soo RA. Nivolumab in NSCLC: latest evidence and clinical potential. Ther Adv Med Oncol 2015;7(2):85-96.
- Yervoy, ipilimumab-Product profile-Bio Century. Bio Century Online Intelligence. New York: Bio Century Publications; 2012.
- Zago G, Muller M, Van Den Heuvel M, Baas P. New targeted treatments for non-small-cell lung cancer–role of nivolumab. Biol Targets Ther 2016;10:103.
- Postow MA. Managing immune checkpoint-blocking antibody side effects. Am Soc Clin Oncol Educ Book 2015;35(1):76-83.
- Schmerling RA. Toxicity of checkpoint inhibitors. Chin Clin Oncol 2014;3(3):31.
- Torino F, Barnabei A, Paragliola R, Marchetti P, Salvatori R, Corsello S. Endocrine side-effects of anti-cancer drugs: mAbs and pituitary dysfunction: clinical evidence and pathogenic hypotheses. Eur J Endocrinol 2013;169(6):R153-64.
- Pravallika KE, Prameela RA. Method development for simultaneous estimation of cabozantinib and Nivolumab in rat plasma by HPLC. Int J Pharm Sci Rev Res 2020;61(2):8-12.
- Su Q, Li J, Ji X, Li J, Zhou T, Lu W, et al. An LC-MS/MS method for the quantitation of cabozantinib in rat plasma: Application to a pharmacokinetic study. J Chromatogr B 2015;985:119-23.
- Iwamoto N, Shimada T, Terakado H, Hamada A. Validated LC–MS/MS analysis of immune checkpoint inhibitor Nivolumab in human plasma using a Fab peptide-selective quantitation method: nano-surface and molecular-orientation limited (nSMOL) proteolysis. J Chromatogr B 2016;1023:9-16.
- Puszkiel A, Noé G, Boudou-Rouquette P, Le-Cossec C, Arrondeau J, Giraud JS, et al. Development and validation of an ELISA method for the quantification of nivolumab in plasma from non-small-cell lung cancer patients. J Pharm Biomed Anal 2017;139:30-6.
- Gopinath k, Yanadirao M, Pavani Y, Subba rao M. A study of method development, validation and forced degradation for simultaneous quantification of cabozantinib and Nivolumab in bulk and pharmaceutical dosage form by HPLC. Asi J Pharm Clin Res 2019;12(2):102-6.
- Patel RB, Patel HU, Patel U. Development and validation of stability indicating rp-hplc method for the estimation of cabozantinib in pharmaceutical dosage form. Int J of Res Anal Rev 2020;7(4):892-907.
- International Conference On Harmonisation, Q2 (R1) Validation of Analytical Procedures 2005.
- International Conference On Harmonisation, Q1A (R2) Stability Testing of New Drug Substances and Products 2003.
- Ribani M, Bottoli CG, Collins CH, Jardim IF, Melo LC. Validation for chromatographic and electrophoretic methods. Química Nova 2004;27(5):771-80.
