- Corresponding Author:
- A. K. Bothra
Cheminformatics Bioinformatics Laboratory, Department of Chemistry, Raiganj College (University College), Raiganj P.O. Uttar Dinajpur-733 134, Department of Chemistry, Raiganj College (University College), Raiganj P.O. Uttar Dinajpur-733 134, India
E-mail: asimbothra@gmail.com
| Date of Submission | 30 June 2010 |
| Date of Revision | 6 April 2011 |
| Date of Acceptance | 8 April 2011 |
| Indian J Pharm Sci, 2011, 73 (2): 165-170 |
Abstract
The c-Jan N-terminal kinases are members of the mitogen activated protein kinase family of signaling proteins. Amino pyridine based compounds, 4-anilino pyrimidine derivatives, and 2-pyridine carboxamide derivatives have been identified as potent JNK inhibitors with good cellular activity. In this study we calculated molecular topological and quantum chemical descriptors of 15 training compounds and three quantitative structure activity relationships models have been constructed. The significance of three models is judged on the basis of correlation, Fischer F test and quality factor (Q). This study is helpful for screening potent inhibitors of protein kinases.
Keywords
Amino pyridine, JNK inhibitors, pyridine carboxamide, QSAR, regression analysis
Mitogen activated protein kinase 8 (MAPK8) is involved in integrating multiple biochemical signals that regulate proliferation, differentiation, transcription regulation and development [1,2]. The c-Jan N-terminal kinases (JNKs), which exist as three isoforms, JNK1, JNK2, JNK3, are also members of the MAP kinase family of signaling proteins. JNKs can be activated by various stimuli such as environmental stress, cytokinase and fatty acids. In a number of human diseases, JNK1 activity is involved as JNK1 is widely expressed in tissues, and was believed to play a key role in linking obesity and insulin resistance. By way of phosphorylation of the insulin receptor substrate (IRS-1), JNK1 disrupts the insulin signaling cascade, which leads to the degradation of IRS-1. Apart from playing this role JNK1 activity is elevated in adipocytes of type 2 diabetic patients. Hence JNK1 could potentially increase the insulin sensitivity and may be useful as therapeutics for the treatment of type 2 diabetes.
Aminopyridine based compounds, 4-anilinopyrimidine derivatives, and 2-pyridine carboxamide derivativeshave been identified as potent JNK inhibitors with good cellular activity. These compounds bind to the ATP site in an unusual manner, provide the crucial hinge interactions needed for JNK1 activity [3-5]. Benzothiazol-2-yl acetonitrile pyrimidine core base derivatives are explored as potent JNK3 Inhibitors [6]. Docking studies of aminopyridine carboxamide inhibitors of JNK1 has also been performed [7].
In quantitative structure activity relationships (QSAR) studies, two components are essential; calculation of the structural descriptors from the three dimensional molecular structure and a statistical relationship between a set of parameters determined from their structures and the biological activity exerted by a series of compounds.
In this communication we have considered different parameters and indices SIC (Structural Information Content), CIC (Complementary Information Content), W (Wiener index), hχ (Randiac’s connectivity index) and some quantum chemical parameters namely HOMO energy (EH), LUMO energy (EL), Dipole moment (μ) to build three QSAR models.
The training set and the test set data were taken from a binding DB [8-10] database (www.bindingdb.org).
The initial structures of training and test molecules were constructed by ChemSketch. For all the molecules studied, calculations of quantum mechanical descriptors were performed using the Gamess quantum chemistry package installed in pentium-IV machine with Dual Core processor in Windows platform.
We attempted several descriptors and it is found (data not shown) that graph theoretical descriptors (topological indices) such as SIC, CIC, W, hχ and quantum chemical indices that incuded EH, E and μ can better represent the biological activity of molecules. Graph theoretical descriptors usually known as topological indices are very important in computational chemistry. The molecules may be recognized as a chemical graph (G) with several vertices and edges and the graphs are associated with invariants.
The Wiener index (W) [11], the first topological
index reported in the chemical literature, may be
calculated as,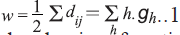 , where gh is the
number of unordered pairs of vertices whose distance
is h. Randiac’s connectivity index [12], and higher
order path connectivity index were calculated using
the method of Kier and Hall [13]. The generalized
form of the simple path connectivity index is,
, where gh is the
number of unordered pairs of vertices whose distance
is h. Randiac’s connectivity index [12], and higher
order path connectivity index were calculated using
the method of Kier and Hall [13]. The generalized
form of the simple path connectivity index is, 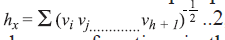 where,
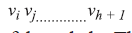 are the
degrees of vertices in the path of length h. The path
length parameter (Ph), number of path of length h
(h=0, 1,…,10) in the hydrogen suppressed graph, are
calculated using standard algorithms.
are the
degrees of vertices in the path of length h. The path
length parameter (Ph), number of path of length h
(h=0, 1,…,10) in the hydrogen suppressed graph, are
calculated using standard algorithms.
The average information content is defined on the basis
of the Shannon information theory and is calculated
as follows [14,15], 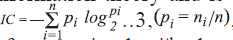 where ni
is the number of atoms in the ith class and n is
a total number of atoms in the molecule. The
division of atoms into different classes depends
upon the coordination sphere that one has taken into
account. This leads to the indices of different order
k. The information content (IC) is equal to average
information content multiplied by the total number
of atoms. Other information content indices (SICstructural
IC, CIC-complementary IC) [16] are defined
as, SICk = ICk/logD
2…(4) and CICk = logn
2- ICk…(5).
Calculations of quantum mechanical descriptors like
HOMO energy, LUMO energy, and Dipole Moment,
were performed by DFT/B3LYP calculation and
the basis set 6-31G (d) was used [17]. The statistical method used in this study was multiple linear
regression (MLR). Topological indices and MLR
were computed using program written by us in
Fortran-77.
where ni
is the number of atoms in the ith class and n is
a total number of atoms in the molecule. The
division of atoms into different classes depends
upon the coordination sphere that one has taken into
account. This leads to the indices of different order
k. The information content (IC) is equal to average
information content multiplied by the total number
of atoms. Other information content indices (SICstructural
IC, CIC-complementary IC) [16] are defined
as, SICk = ICk/logD
2…(4) and CICk = logn
2- ICk…(5).
Calculations of quantum mechanical descriptors like
HOMO energy, LUMO energy, and Dipole Moment,
were performed by DFT/B3LYP calculation and
the basis set 6-31G (d) was used [17]. The statistical method used in this study was multiple linear
regression (MLR). Topological indices and MLR
were computed using program written by us in
Fortran-77.
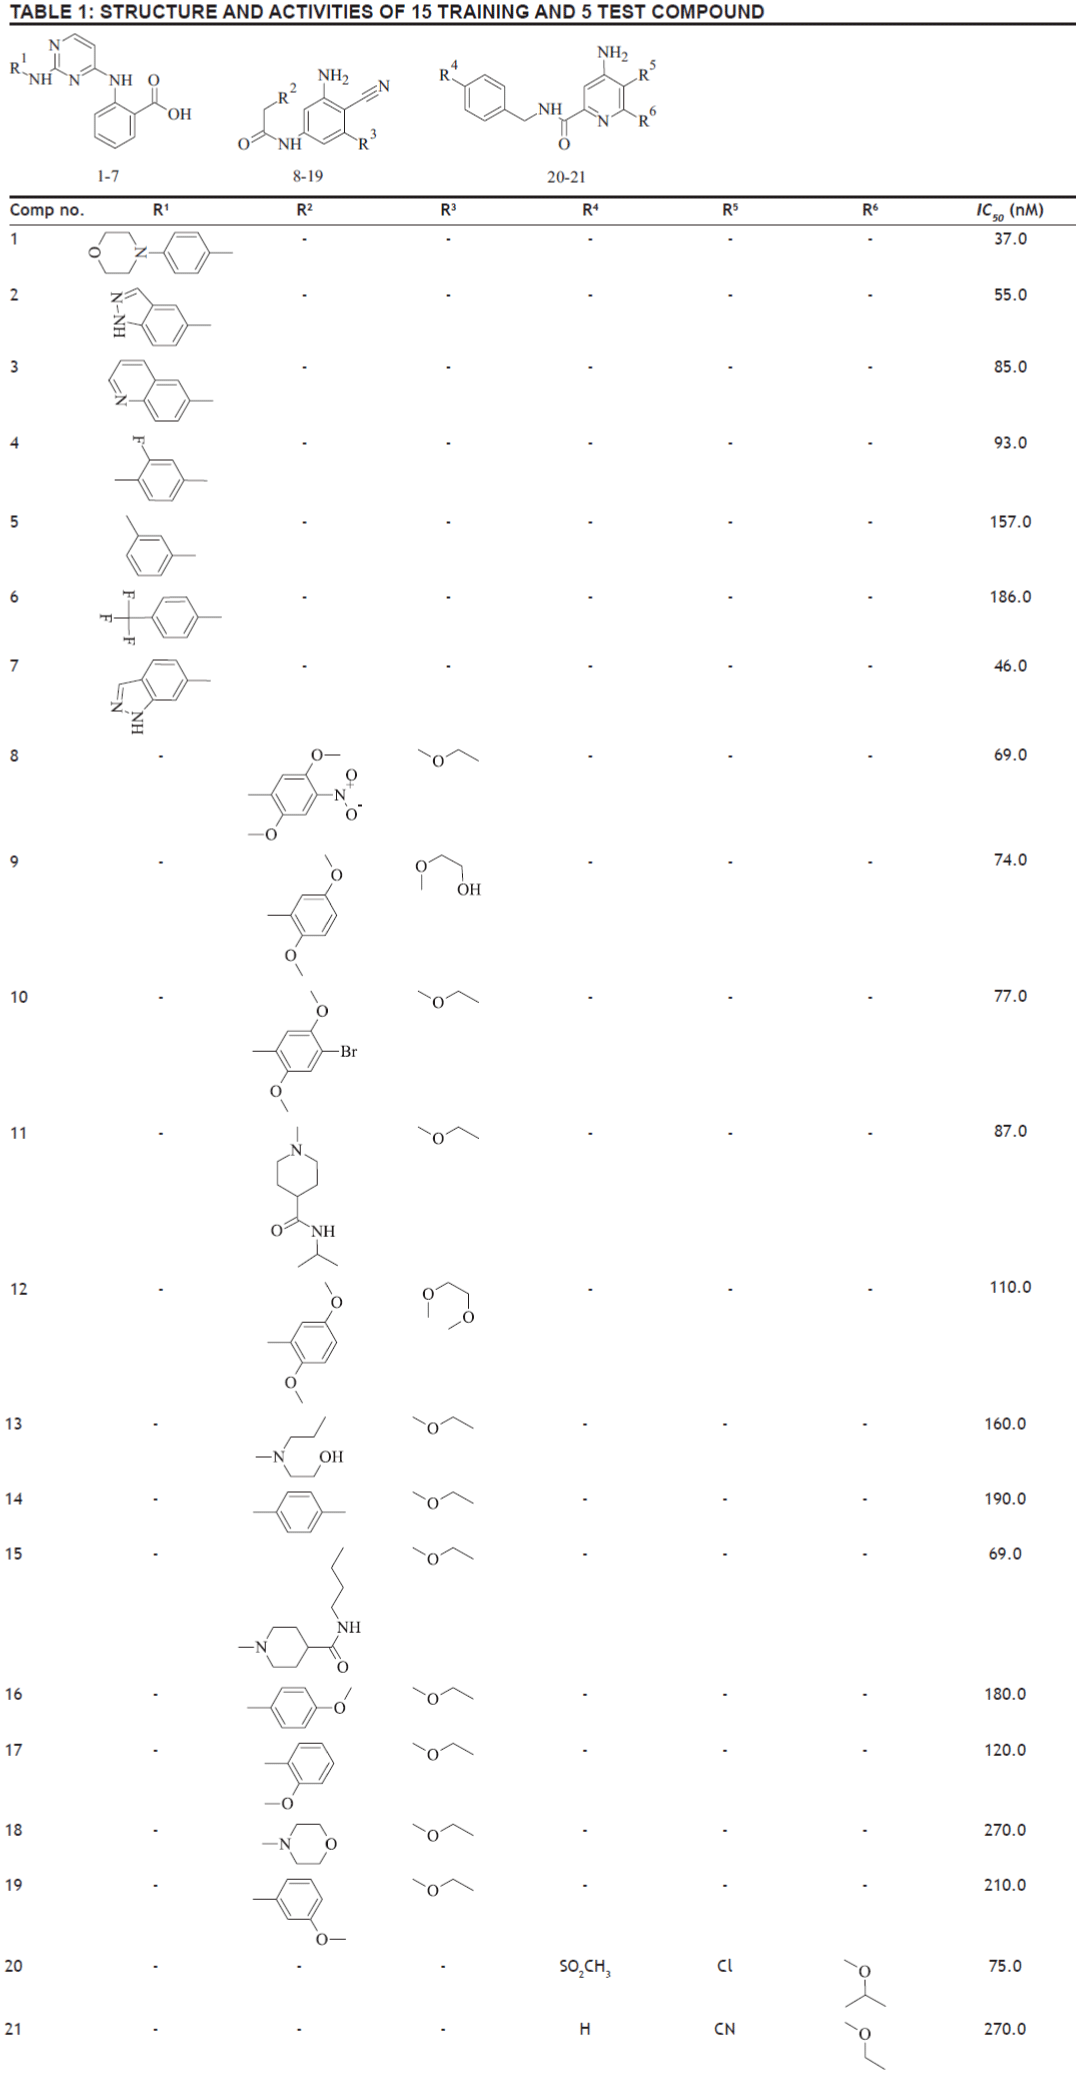
Structural details of the compounds (training and test set) used in this study and their biological activity are given in Table 1. The list of the structural descriptors (SIC, CIC, W, hχ), dipole moment (μ), HOMO, LUMO energies obtained from DFT calculation of 15 training compounds and are presented in Table 2.
| Comp no. | SIC1 | CIC1 | lnW | 0χ | EH | EL | µ |
|---|---|---|---|---|---|---|---|
| 1 | 0.5806 | 2.3669 | 7.8694 | 20.0538 | -0.1643 | -0.0355 | 1.8818 |
| 2 | 0.6489 | 1.8682 | 7.5115 | 17.9325 | -0.1863 | -0.0468 | 5.8296 |
| 3 | 0.5861 | 2.2321 | 7.6217 | 18.6396 | -0.1891 | -0.0419 | 6.6979 |
| 4 | 0.6382 | 1.9255 | 7.3512 | 17.8112 | -0.1976 | -0.0384 | 4.0879 |
| 5 | 0.5930 | 2.1659 | 7.2862 | 16.9409 | -0.1966 | -0.0468 | 2.7003 |
| 6 | 0.6406 | 1.9126 | 7.6487 | 19.4409 | -0.2099 | -0.0432 | 5.0552 |
| 8 | 0.6961 | 1.6786 | 7.7899 | 21.5517 | -0.2348 | -0.1023 | 4.9070 |
| 9 | 0.6571 | 1.9045 | 7.6099 | 19.8112 | -0.2071 | -0.0360 | 7.6870 |
| 10 | 0.6684 | 1.8318 | 7.5959 | 19.9743 | -0.2132 | -0.0390 | 4.9504 |
| 11 | 0.5737 | 2.4645 | 7.7919 | 20.6814 | -0.1974 | -0.0364 | 10.158 |
| 12 | 0.6023 | 2.2444 | 7.7222 | 20.5183 | -0.2148 | -0.0349 | 7.8298 |
| 13 | 0.6292 | 2.0483 | 7.1869 | 17.2423 | -0.2237 | -0.0377 | 5.3432 |
| 14 | 0.6280 | 1.9932 | 7.2145 | 16.9494 | -0.2127 | -0.0351 | 6.7821 |
| 20 | 0.6602 | 1.8767 | 7.5533 | 19.4828 | -0.2326 | -0.0552 | 9.0236 |
| 21 | 0.6371 | 1.9045 | 7.0440 | 15.6565 | -0.2368 | -0.0677 | 1.5427 |
Table 2: Calculated descriptors of 15 training compounds studied
In this study, several regression equations were constructed. Among the regression results, three equations were selected as models, which are given in Table 3. In these models, N is the number of data points; R is the correlation coefficient between observed values of the dependent and the values calculated from the equation. R2 is the square of the correlation coefficient, and is a measure of the fit of the regression equation. R2 CV, the “leave one out” (LOO) scheme, a model is build with N-1 compounds and the Nth compound is predicted. Each compound is left out of the model derivation and predicted in turn. An indication of the performance of the model is obtained from the cross validated coefficient (R2 CV). S is the standard deviation of the regression. Fischer statistics (F) is the ratio between explained and unexplained variance for a given number of degree of freedom. Higher values of F test indicate the significance of the QSAR model. Q is the quality factor. High values of Q indicate high predictive power of the QSAR models and the lack of “over fittings”. By using model number 1, 2, and 3 the theoretical log IC50 values of 15 training compounds are given in Table 4 together with experimental log IC50. Among the models, the Model 3 with the R=0.930, R2=0.865, R2 CV=0.470, S=0.216, F=11.533, Q=4.306 turns out to be the best fit model.
| Model no. | Model (Predicted) | R | R2 | R2CV | S | F | Q | |
|---|---|---|---|---|---|---|---|---|
| 1. | Log IC50=15.6713+(17.7781)SIC1+(-2.3204)CIC1+(-10.7053) | 0.898 | 0.806 | 0.490 | 0.220 | 10.387 | 4.276 | |
| EH+(-0.0002)µ | ||||||||
| 2. | Log IC50=29.9689+(-24.5031)SIC1+(-3.3135)CIC1+(-6.1227) | 0.918 | 0.843 | 0.470 | 0.210 | 7.159 | 4.173 | |
| EH+(0.0002)µ+(-1.5242)ln W+(0.2314)Xº | ||||||||
| 3. | Log IC50=13.8749+(15.7605)SIC1+(-2.0932)CIC1+(12.3043) | 0.930 | 0.865 | 0.470 | 0.216 | 11.533 | 4.306 | |
| EH+(4.3037)EL+(-0.0118)µ | ||||||||
N=15 is total number of training compounds.
Table 3: Qsar Models
| Comp no. | Experimental log IC50 in nM | Predicted log IC50 in nM | ||
|---|---|---|---|---|
| Model 1 | Model 2 | Model 3 | ||
| 1 | 1.5682 | 1.6166 | 1.5519 | 1.6165 |
| 2 | 1.7404 | 1.7943 | 1.7210 | 1.7595 |
| 3 | 1.9294 | 2.0962 | 2.0669 | 2.0328 |
| 4 | 1.9685 | 1.9729 | 2.0784 | 2.0039 |
| 5 | 2.1959 | 2.2082 | 2.2806 | 2.1810 |
| 6 | 2.2695 | 2.0916 | 2.0605 | 2.1123 |
| 8 | 1.8388 | 1.9145 | 1.9026 | 1.7812 |
| 9 | 1.8692 | 1.7866 | 1.8122 | 1.8347 |
| 10 | 1.8865 | 1.8202 | 1.8721 | 1.9032 |
| 11 | 1.9395 | 1.8655 | 1.8653 | 1.8267 |
| 12 | 2.0414 | 2.0545 | 2.0684 | 2.0847 |
| 13 | 2.2041 | 2.1271 | 2.1708 | 2.1980 |
| 14 | 2.2788 | 2.1582 | 2.2059 | 2.1911 |
| 20 | 1.8751 | 2.0687 | 1.9951 | 2.0594 |
| 21 | 2.4314 | 2.4613 | 2.3840 | 2.4515 |
Table 4: The list of experimental and theoretical log ic50 of 15 training compound
The correlation graph of training and test
compounds between experimental log IC50 and
predicted log IC50 (using Model 3) is presented
in figs. 1a and 1b, respectively. The indices of
the 6 test compounds are presented in Table 5.
Using the model number 3, we calculated the
theoretical log IC50 of the test set, which appeared in Table 6. The results appear to be in fair agreement
with experimental log IC50.This QSAR study has been carried out by considering
the density functional theory (DFT) and statistical
methods. Three QSAR models with different
parameters are formed. An analysis of the descriptors
that involved in the models indicated that log IC50
is influenced by first order SIC, first order CIC, W
(Wiener index) hχ (Randiac’s connectivity index),
HOMO energy, LUMO energy, and Dipole Moment
of the compound studied and these QSAR models
may be employed to determine the activity of the
designed compounds.
| Comp no. | SIC1 | CIC1 | EH | EL | µ |
|---|---|---|---|---|---|
| 7 | 0.6490 | 1.8682 | -0.1821 | -0.0499 | 6.4101 |
| 15 | 0.5614 | 2.5799 | -0.2114 | -0.0397 | 10.5123 |
| 16 | 0.6513 | 1.8802 | -0.2158 | -0.0365 | 6.4674 |
| 17 | 0.6513 | 1.8802 | -0.2021 | -0.0319 | 6.5452 |
| 18 | 0.6597 | 1.8232 | -0.2068 | -0.0347 | 5.9027 |
| 19 | 0.6513 | 1.8801 | -0.2123 | -0.0354 | 7.0432 |
SIC1: first order structural information content, CIC1 : first order complementary information content, EH: energy of HOMO (hartree), EL: energy of LUMO (hartree), µ: dipole moment (debye).
Table 5: Calculated descriptors of 6 test compounds studied
| Comp no. | Experimental log IC50 | Predicted log IC50 (by Model number3) |
|---|---|---|
| 7 | 1.6628 | 1.6860 |
| 15 | 1.8388 | 1.9329 |
| 16 | 2.2553 | 2.0963 |
| 17 | 2.0792 | 1.9466 |
| 18 | 2.4314 | 1.9869 |
| 19 | 2.3222 | 2.0514 |
Table 6: The list of experimental log ic50 and predicted log ic50 of 6 test set

Figure 1: The correlation graph using Model 3
The correlation graph between experimental and predicted Log IC50, for (a) training compounds and (b) test compounds.
Acknowledgements
We acknowledge the Department of Biotechnology, Government of India for providing two grants BT/ BI/004/93 and BT/BI/019/99.
References
- David JP, Sabapathy K, Hoffmann O, Idarraga MH, Wagner EF. JNK1 modulates osteoclastogenesis through both c-Jun phosphorylation–dependent and independent mechanism. J Cell Sci 2002;115:4317-25.
- Schaeffer HJ, Weber MJ. Mitogen Activated protein kinase: Specific message from ubiquitous messengers. Mol Cell Biol 1999;19: 2435-44.
- Liu M, Wang S, Clampit JE, Gum RJ, Haasch DL, Rondinone CM, et al. Discovery of a new class of 4-anilinopyrimidines as potent c-JanN-terminal kinase inhibitors: Synthesis and SAR studies. Bioorg Med ChemLett 2007;17:668-72.
- Szczepankiewicz BG, Kosogof C, Nelson LT, Liu G, Liu B, Zhao H, et al. Aminopyridin-based c-Jan N-terminal kinase inhibitors withcellular activity and minimal cross-kinase activity. J Med Chem 2006;49: 3563-80.
- Zhao H, Serby MD, Xin Z, Szczepankiewicz BG, Liu M, Kosogof C, et al. Discovery of potent, highly selective and orally bio availablepyridine carboxamide c-Jan NH2 terminal kinase inhibitors. J Med Chem 2006;49:4455-8.
- Sharma P, Ghoshal N. Exploration of a binding mode benzothiazol-2-yl acetonitrile pyrimidine core based derivatives as potent c-Jun N-terminal kinase-3 inhibitors and 3D-QSAR analyses. J ChemInf Model 2006;46:1763-74.
- Yi P, Qiu M. 3D-QSAR and docking studies of aminopyridinecarboxamide inhibitors of c-Jun N-terminal kinase-1. Eur J Med Chem 2008;43:604-13.
- Chen X, Liu M, Gilson MK. Binding DB: A Web-accessible molecular recognition database. Comb Chem High Throughput Screen 2002;4: 719-25.
- Chen X, Lin Y, Liu M, Gilson MK. The binding database: Data management and interface design. Bioinformatics 2002;18: 130-9.
- Chen X, Lin Y, Gilson MK. The binding database: Overview and user's guide Biopolymers 2002;61:127-41.
- Wiener H. Structural determination of paraffin boiling points. J Am ChemSoc 1947;69:17-20.
- Randiac M. On the characterization of Molecular branching. J Am ChemSoc 1975;97:6609.
- Kier LB, Hall LH. Molecular connectivity in structure-activity analysis, Letchworth, Hertfordshire; UK: Research Studies Press; 1986.
- Eroglu E. Some QSAR Studies for a group of sulfonamide schiff base as carbonic Anhydrase CA 2 inhibitors. Int J MolSci 2008;9:181-97.
- Kier LB. Use of molecular negentropy to encode structure governing biological-activity. J Pharm Sci 1980;69:807-10.
- Basak SC, Harriss DK, Magnuson VR. Comparative study of lipophilicityvessus topological molecular descriptors in biological correlation. J Pharm Sci 1984;73:429-37.
- Schmidt MW, Baldridge KK, Boatz JA, Elbert ST, Gordon MS, Jensen JH, et al. GAMESS Version= 24 Mar 2007 (R1) from Iowa State University. J ComputChem 1993;14:1347-63.


